
16.7: Climatology
- Page ID
- 10499

\( \newcommand{\vecs}[1]{\overset { \scriptstyle \rightharpoonup} {\mathbf{#1}} } \)
\( \newcommand{\vecd}[1]{\overset{-\!-\!\rightharpoonup}{\vphantom{a}\smash {#1}}} \)
\( \newcommand{\id}{\mathrm{id}}\) \( \newcommand{\Span}{\mathrm{span}}\)
( \newcommand{\kernel}{\mathrm{null}\,}\) \( \newcommand{\range}{\mathrm{range}\,}\)
\( \newcommand{\RealPart}{\mathrm{Re}}\) \( \newcommand{\ImaginaryPart}{\mathrm{Im}}\)
\( \newcommand{\Argument}{\mathrm{Arg}}\) \( \newcommand{\norm}[1]{\| #1 \|}\)
\( \newcommand{\inner}[2]{\langle #1, #2 \rangle}\)
\( \newcommand{\Span}{\mathrm{span}}\)
\( \newcommand{\id}{\mathrm{id}}\)
\( \newcommand{\Span}{\mathrm{span}}\)
\( \newcommand{\kernel}{\mathrm{null}\,}\)
\( \newcommand{\range}{\mathrm{range}\,}\)
\( \newcommand{\RealPart}{\mathrm{Re}}\)
\( \newcommand{\ImaginaryPart}{\mathrm{Im}}\)
\( \newcommand{\Argument}{\mathrm{Arg}}\)
\( \newcommand{\norm}[1]{\| #1 \|}\)
\( \newcommand{\inner}[2]{\langle #1, #2 \rangle}\)
\( \newcommand{\Span}{\mathrm{span}}\) \( \newcommand{\AA}{\unicode[.8,0]{x212B}}\)
\( \newcommand{\vectorA}[1]{\vec{#1}} % arrow\)
\( \newcommand{\vectorAt}[1]{\vec{\text{#1}}} % arrow\)
\( \newcommand{\vectorB}[1]{\overset { \scriptstyle \rightharpoonup} {\mathbf{#1}} } \)
\( \newcommand{\vectorC}[1]{\textbf{#1}} \)
\( \newcommand{\vectorD}[1]{\overrightarrow{#1}} \)
\( \newcommand{\vectorDt}[1]{\overrightarrow{\text{#1}}} \)
\( \newcommand{\vectE}[1]{\overset{-\!-\!\rightharpoonup}{\vphantom{a}\smash{\mathbf {#1}}}} \)
\( \newcommand{\vecs}[1]{\overset { \scriptstyle \rightharpoonup} {\mathbf{#1}} } \)
\( \newcommand{\vecd}[1]{\overset{-\!-\!\rightharpoonup}{\vphantom{a}\smash {#1}}} \)
\(\newcommand{\avec}{\mathbf a}\) \(\newcommand{\bvec}{\mathbf b}\) \(\newcommand{\cvec}{\mathbf c}\) \(\newcommand{\dvec}{\mathbf d}\) \(\newcommand{\dtil}{\widetilde{\mathbf d}}\) \(\newcommand{\evec}{\mathbf e}\) \(\newcommand{\fvec}{\mathbf f}\) \(\newcommand{\nvec}{\mathbf n}\) \(\newcommand{\pvec}{\mathbf p}\) \(\newcommand{\qvec}{\mathbf q}\) \(\newcommand{\svec}{\mathbf s}\) \(\newcommand{\tvec}{\mathbf t}\) \(\newcommand{\uvec}{\mathbf u}\) \(\newcommand{\vvec}{\mathbf v}\) \(\newcommand{\wvec}{\mathbf w}\) \(\newcommand{\xvec}{\mathbf x}\) \(\newcommand{\yvec}{\mathbf y}\) \(\newcommand{\zvec}{\mathbf z}\) \(\newcommand{\rvec}{\mathbf r}\) \(\newcommand{\mvec}{\mathbf m}\) \(\newcommand{\zerovec}{\mathbf 0}\) \(\newcommand{\onevec}{\mathbf 1}\) \(\newcommand{\real}{\mathbb R}\) \(\newcommand{\twovec}[2]{\left[\begin{array}{r}#1 \\ #2 \end{array}\right]}\) \(\newcommand{\ctwovec}[2]{\left[\begin{array}{c}#1 \\ #2 \end{array}\right]}\) \(\newcommand{\threevec}[3]{\left[\begin{array}{r}#1 \\ #2 \\ #3 \end{array}\right]}\) \(\newcommand{\cthreevec}[3]{\left[\begin{array}{c}#1 \\ #2 \\ #3 \end{array}\right]}\) \(\newcommand{\fourvec}[4]{\left[\begin{array}{r}#1 \\ #2 \\ #3 \\ #4 \end{array}\right]}\) \(\newcommand{\cfourvec}[4]{\left[\begin{array}{c}#1 \\ #2 \\ #3 \\ #4 \end{array}\right]}\) \(\newcommand{\fivevec}[5]{\left[\begin{array}{r}#1 \\ #2 \\ #3 \\ #4 \\ #5 \\ \end{array}\right]}\) \(\newcommand{\cfivevec}[5]{\left[\begin{array}{c}#1 \\ #2 \\ #3 \\ #4 \\ #5 \\ \end{array}\right]}\) \(\newcommand{\mattwo}[4]{\left[\begin{array}{rr}#1 \amp #2 \\ #3 \amp #4 \\ \end{array}\right]}\) \(\newcommand{\laspan}[1]{\text{Span}\{#1\}}\) \(\newcommand{\bcal}{\cal B}\) \(\newcommand{\ccal}{\cal C}\) \(\newcommand{\scal}{\cal S}\) \(\newcommand{\wcal}{\cal W}\) \(\newcommand{\ecal}{\cal E}\) \(\newcommand{\coords}[2]{\left\{#1\right\}_{#2}}\) \(\newcommand{\gray}[1]{\color{gray}{#1}}\) \(\newcommand{\lgray}[1]{\color{lightgray}{#1}}\) \(\newcommand{\rank}{\operatorname{rank}}\) \(\newcommand{\row}{\text{Row}}\) \(\newcommand{\col}{\text{Col}}\) \(\renewcommand{\row}{\text{Row}}\) \(\newcommand{\nul}{\text{Nul}}\) \(\newcommand{\var}{\text{Var}}\) \(\newcommand{\corr}{\text{corr}}\) \(\newcommand{\len}[1]{\left|#1\right|}\) \(\newcommand{\bbar}{\overline{\bvec}}\) \(\newcommand{\bhat}{\widehat{\bvec}}\) \(\newcommand{\bperp}{\bvec^\perp}\) \(\newcommand{\xhat}{\widehat{\xvec}}\) \(\newcommand{\vhat}{\widehat{\vvec}}\) \(\newcommand{\uhat}{\widehat{\uvec}}\) \(\newcommand{\what}{\widehat{\wvec}}\) \(\newcommand{\Sighat}{\widehat{\Sigma}}\) \(\newcommand{\lt}{<}\) \(\newcommand{\gt}{>}\) \(\newcommand{\amp}{&}\) \(\definecolor{fillinmathshade}{gray}{0.9}\)16.7.1. Seasonality
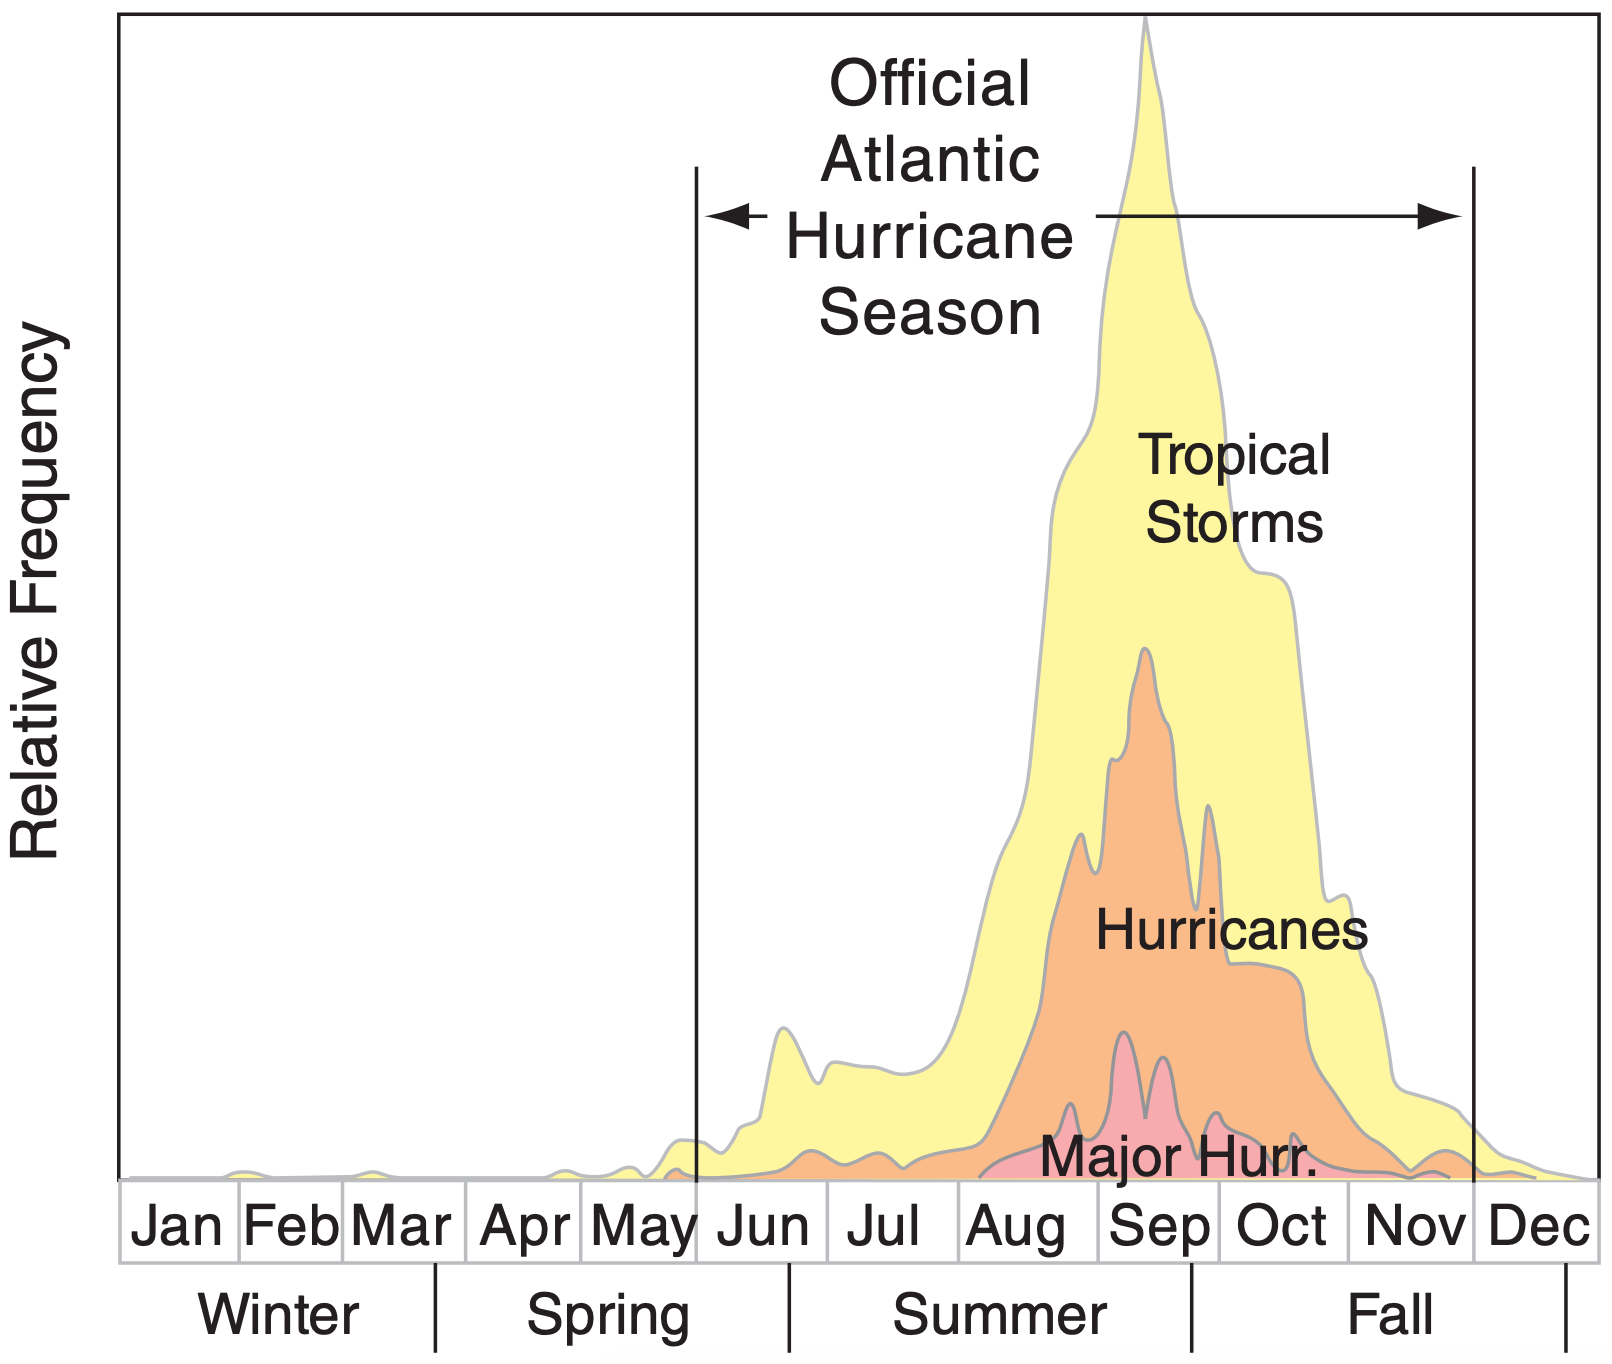
Tropical cyclones are most frequent in late Summer and Fall of their respective hemisphere. This is because the sun has been at its highest in the sky, causing the top layers of the tropical ocean to accumulate the most heat. Fig. 16.40 shows the frequency of Atlantic Hurricanes vs. time. Table 16-6 shows periods of frequent tropical cyclones in all the ocean basins.
| Table 16-6. Tropical Cyclone Seasons. Start & end dates are for the most active period of the storm season, but some storms occur outside of this peak season. | |||
| Location | Start | Peak | End |
|---|---|---|---|
| Atlantic | 1 June | mid Sep | 30 Nov |
| NE Pacific | 15 May | late Aug /early Sep | 30 Nov |
| NW Pacific* | 1 July | late Aug /early Sep | 30 Nov |
| N. Indian | 1 Apr | 2 peaks: Apr-Jun, & late Sep-early Dec | 31 Dec |
| S. Indian | 1 Oct | 2 peaks: mid-Jan, & mid Feb - early Mar | 31 May |
| Australia & SW Pacific | 1 Oct | late Feb - early Mar | 31 May |
* The NW Pacific has typhoons all year.
16.7.2. Locations of Strongest Cyclones
The largest number of strongest tropical cyclones is in the northwestern Pacific. The reason is that the Pacific is a larger ocean with warmer sea-surface temperatures, allowing typhoons more opportunity to organize and strengthen. Activity ranges from 17 typhoons in a slow year (1998) to 35 in an active year (1971). Also, the larger fetch (distance that wind blows over the ocean) allows larger ocean waves, which can cause more destruction (and better surfing further away).
The opposite extreme is the South Atlantic, which has had only 2 recorded tropical cyclones in the past century. One was Cyclone Catarina, which struck Brazil in March 2004. The other was a Tropical Storm that formed west of Congo in April 1991. There may have been other tropical cyclones in the South Atlantic that were not recorded historically.
There are two reasons for the dearth of tropical cyclones in the South Atlantic. One is the weaker and sometimes nonexistent ITCZ, which reduces tropical cyclone triggering because of less convergence and less initial vorticity. The other is strong wind shear in the upper troposphere, which rips apart thunderstorm clusters before they can become tropical cyclones.
16.7.3. Natural Cycles & Changes in Activity
Atlantic hurricanes have a very large natural variability from year to year. For example, in the Atlantic there were only 4 hurricanes recorded in 1983, and 19 in 1994. An active hurricane year was 2005, with 14 hurricanes and 13 other tropical storms.
Hidden behind this large annual variability are longer-time-period variations of weaker amplitude, making them more difficult to detect and confirm. One is a natural 40-year cycle in Atlantic hurricane power (based on wind-speed cubed accumulated over the lifetime of all Atlantic hurricanes). This power was relatively high during the 1950s and 1960s, and was weaker during the 1970s, 1980s, and early 1990s. Since the late 1990s and 2000s, hurricane power has increased again.
El Niño/La Niña, an irregular 3 to 5 year cycle (see the Natural Climate Processes chapter), also causes long time-scale variations in hurricane activity. During El Niño, there is a tendency for reduced tropical cyclone activity, and some displacement of these storms closer to the equator. The reason is that stronger west winds aloft during El Niño cause stronger wind shear across the troposphere, thereby inhibiting tropical cyclogenesis. Conversely, tropical cyclone activity is enhanced during La Niña.
Of concern these days is human-caused global warming. While most scientists suspect that there will be some effect on tropical cyclones if global warming continues, they have not yet found a clear signal. Debate continues.