16.8: Hazards
- Page ID
- 10506
16.8.1. Human Population and Zoning
The most important factor causing increased deaths and destruction from tropical cyclones is the increase in global population. With population growth, more people live in coastal areas, which are seen as desirable in spite of the threat of tropical cyclones. Even if tropical-cyclone activity were to remain relatively constant, the impacts on humans would increase as population increases.
As more structures are built in vulnerable areas, so increase the property losses caused by tropical cyclone destruction. It also becomes more difficult to evacuate people along inadequate transportation networks. As more people move from farms to cities, there are increased fatalities due to urban flooding caused by heavy tropical-cyclone rainfall.
In highly developed countries, an easy solution would be proper land-use zoning. Namely, governments would not let people live and work in threatened areas. Instead, these areas would be used for parks, floodable farmland, wildlife refuges, etc. However, zoning is a political activity that sometimes results in poor decisions in the face of pressure from real-estate developers who want to build more waterfront properties. An example of a questionable decision is the reconstruction of New Orleans, Louisiana, USA, at its original location after being destroyed by hurricane Katrina in 2005.
Also, people are unfortunately encouraged to live in threatened areas because of the existence of hurricane insurance and hurricane disaster relief. Namely, some individuals choose to make these poor decisions on where to live because they do not have to bear the full costs of reconstruction — instead the cost is borne by all taxpayers.
In less developed, highly populated, low-lying countries such as Bangladesh, an additional problem is an inadequate warning system. Even when tropical cyclone tracks are successfully predicted, sometimes the warning does not reach rural people, and often there is inadequate transportation to enable their evacuation. Bangladesh has suffered terribly from tropical cyclones: 500,000 deaths in Nov 1970, over 11,000 deaths in May 1985 , and 150,000 deaths in Apr 1991.
These aspects of tropical-storm hazards are therefore social (cultural, political, religious, etc.). It cannot be assumed that all problems can be ameliorated by technical solutions (more dams; higher levies). Instead, some tough decisions need to be made on zoning, transportation, and population growth.
16.8.2. Storm Surge
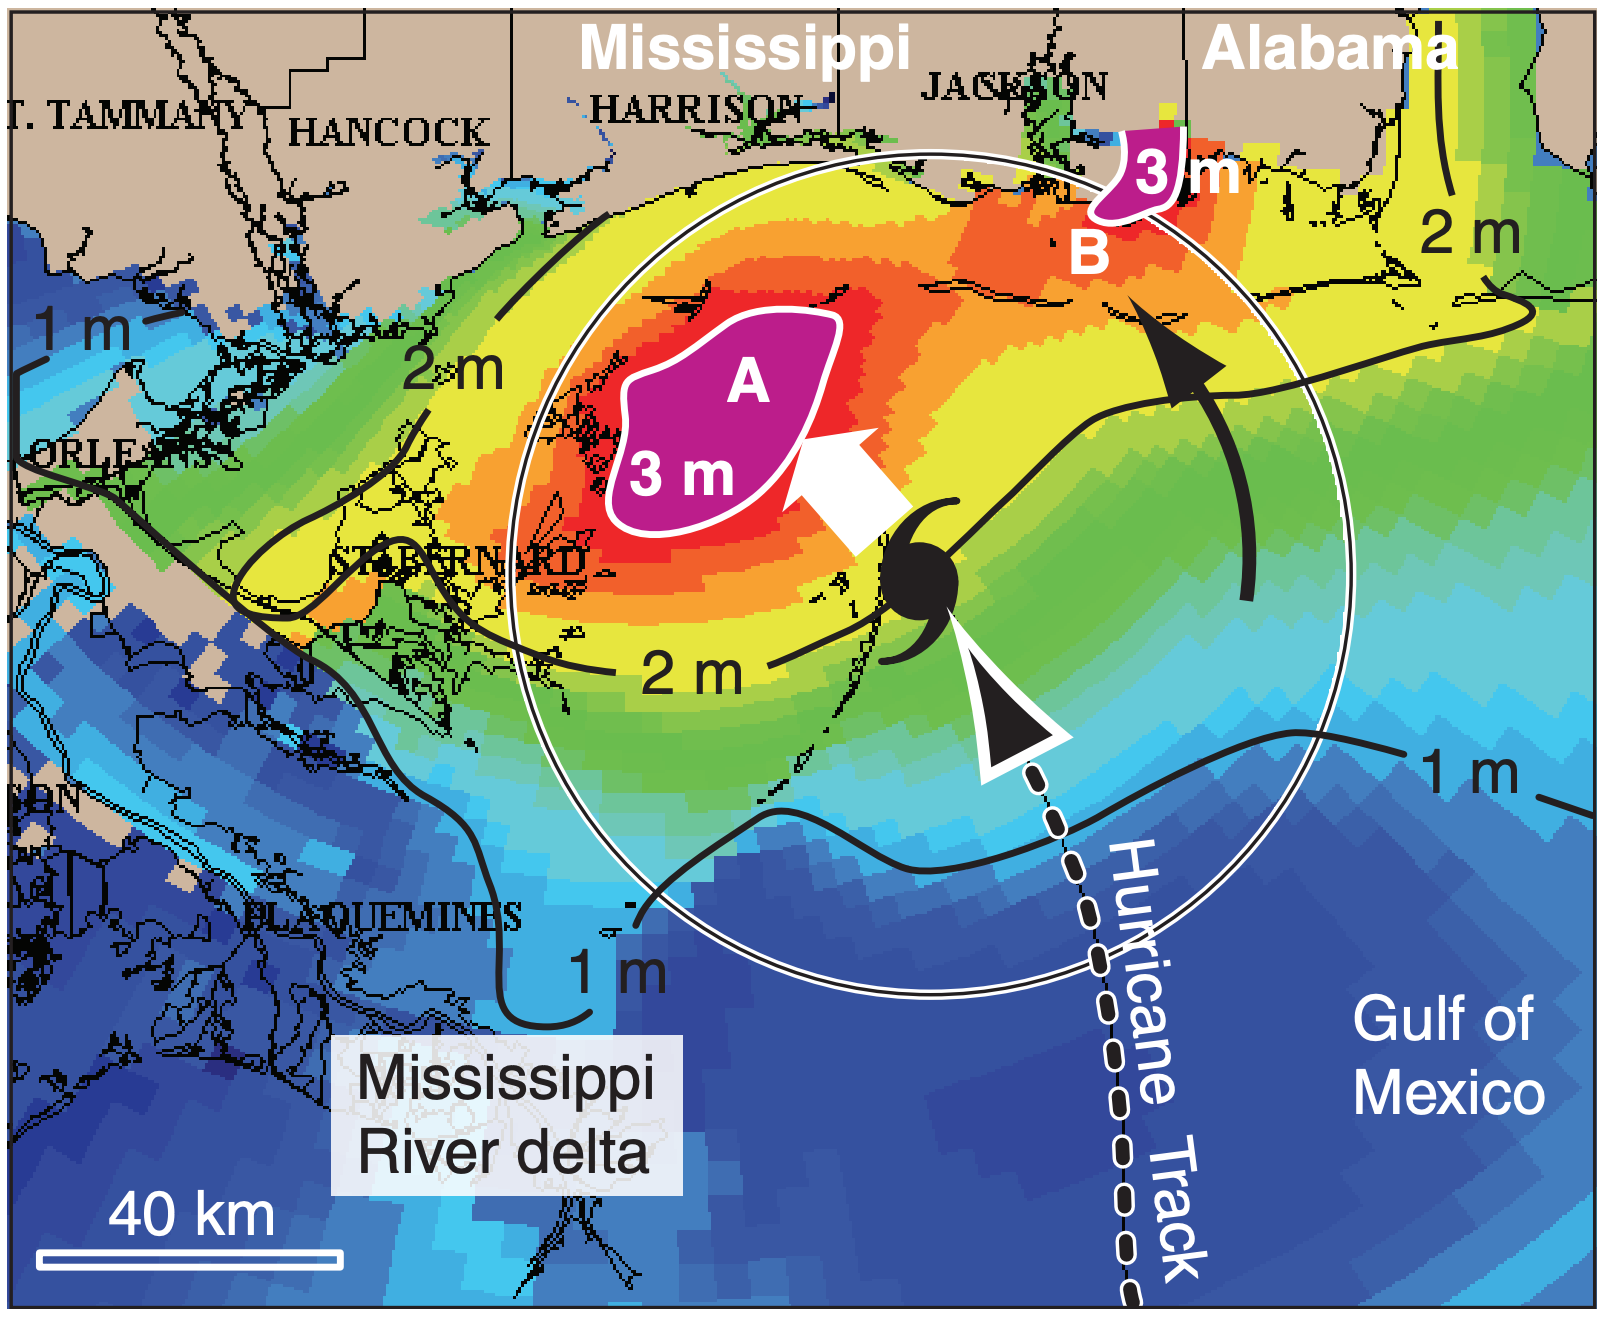
Much of the tropical cyclone-caused damage results from inundation of coastal areas by high seas (Fig. 16.41). The rise in sea level (i.e., the storm surge) is caused by the reduced atmospheric pressure in the eye, and by wind blowing the water against the coast to form a large propagating surge called a Kelvin wave. Table 16-7 gives typical stormsurge heights. High tides and high surface-waves can exacerbate the damage.
16.8.2.1. Atmospheric Pressure Head
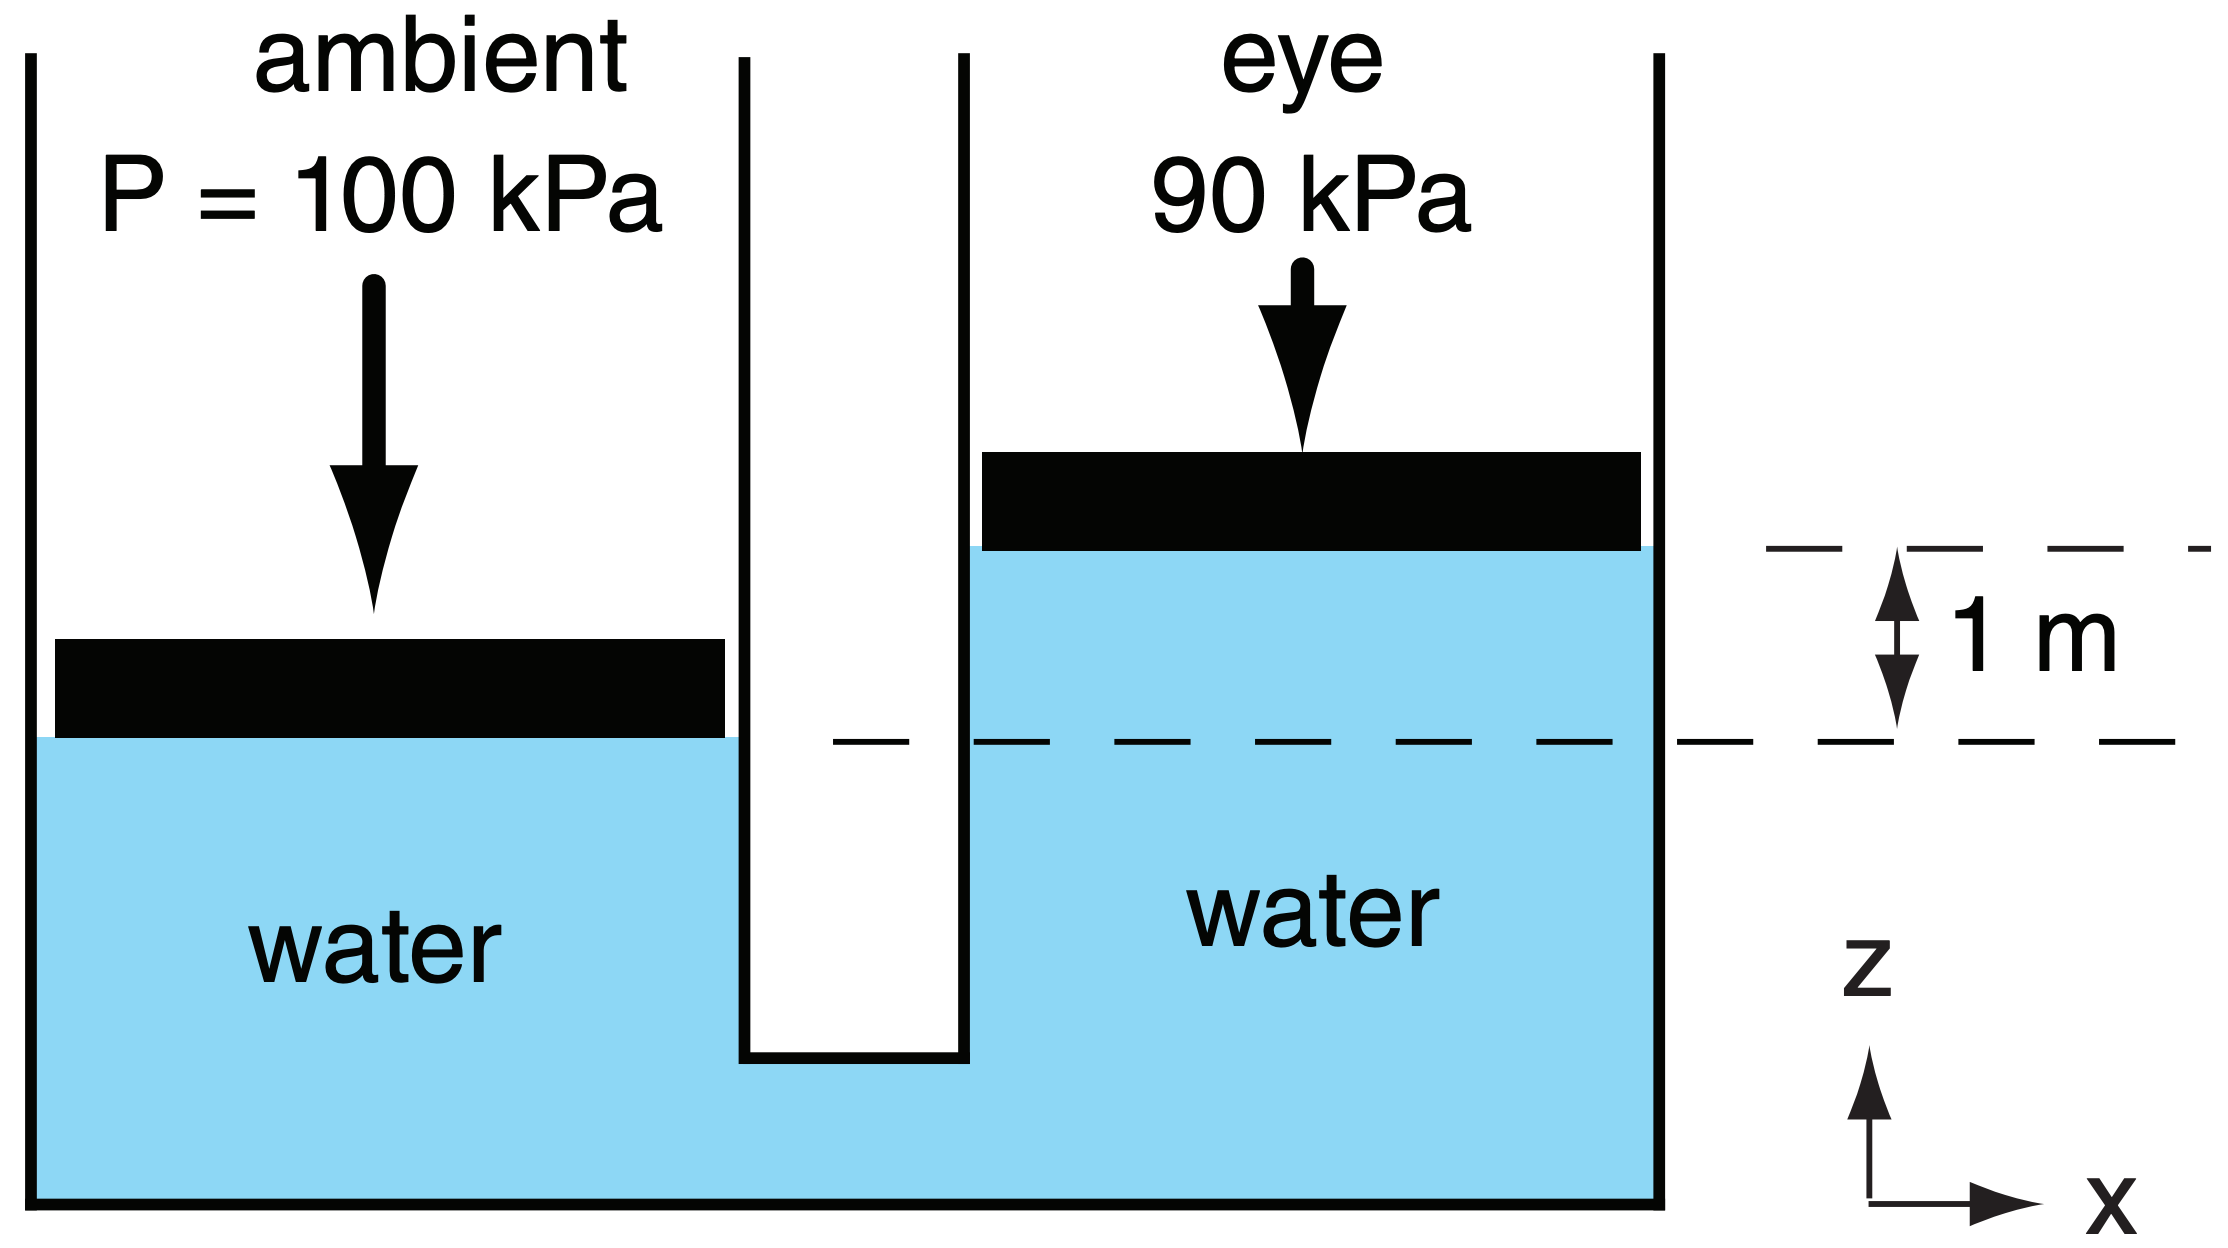
In the eye of the tropical cyclone, atmospheric surface pressure is lower than ambient. Hence the force per unit area pushing on the top of the water is less. This allows the water to rise in the eye until the additional head (weight of fluid above) of water compensates for the reduced head of air (Fig. 16.42).
The amount of rise ∆z of water in the eye is
\(\ \begin{align} \Delta z=\frac{\Delta P_{\max }}{\rho_{\operatorname{liq}} \cdot|g|}\tag{16.19}\end{align}\)
where |g| is gravitational acceleration magnitude (9.8 m s–2), ρliq = 1025 kg m–3 is the density of sea water, and ∆Pmax is the atmospheric surface pressure difference between the eye and the undisturbed environment.
To good approximation, this is
\(\ \begin{align} \Delta z \approx a \cdot \Delta P_{\max }\tag{16.20}\end{align}\)
where a = 0.1 m kPa–1. Thus, in a strong tropical cyclone with eye pressure of 90 kPa (causing ∆Pmax ≈ 10 kPa), the sea level would rise 1 m.
16.8.2.2. Ekman Transport
Recall from the General Circulation chapter that ocean currents are generated by wind drag on the sea surface. The Ekman spiral describes how the current direction and speed varies with depth. The net Ekman transport, accumulated over all depths, is exactly perpendicular to the surface wind direction.
In the Northern Hemisphere, this net transport of water is to the right of the wind, and has magnitude:
\(\ \begin{align} \frac{V o l}{\Delta t \cdot \Delta y}=\frac{\rho_{\text {air}}}{\rho_{\text {water}}} \cdot \frac{C_{D} \cdot V^{2}}{f_{c}}\tag{16.21}\end{align}\)
where Vol is the volume of water transported during time interval ∆t, ∆y is a unit of length of coastline parallel to the mean wind, V is the wind speed near the surface (actually at 10 m above the surface), CD is the drag coefficient, fc is the Coriolis parameter, ρair = 1.225 kg·m–3 is the air density at sea level, and ρwater = 1025 kg·m–3 is sea-water density.
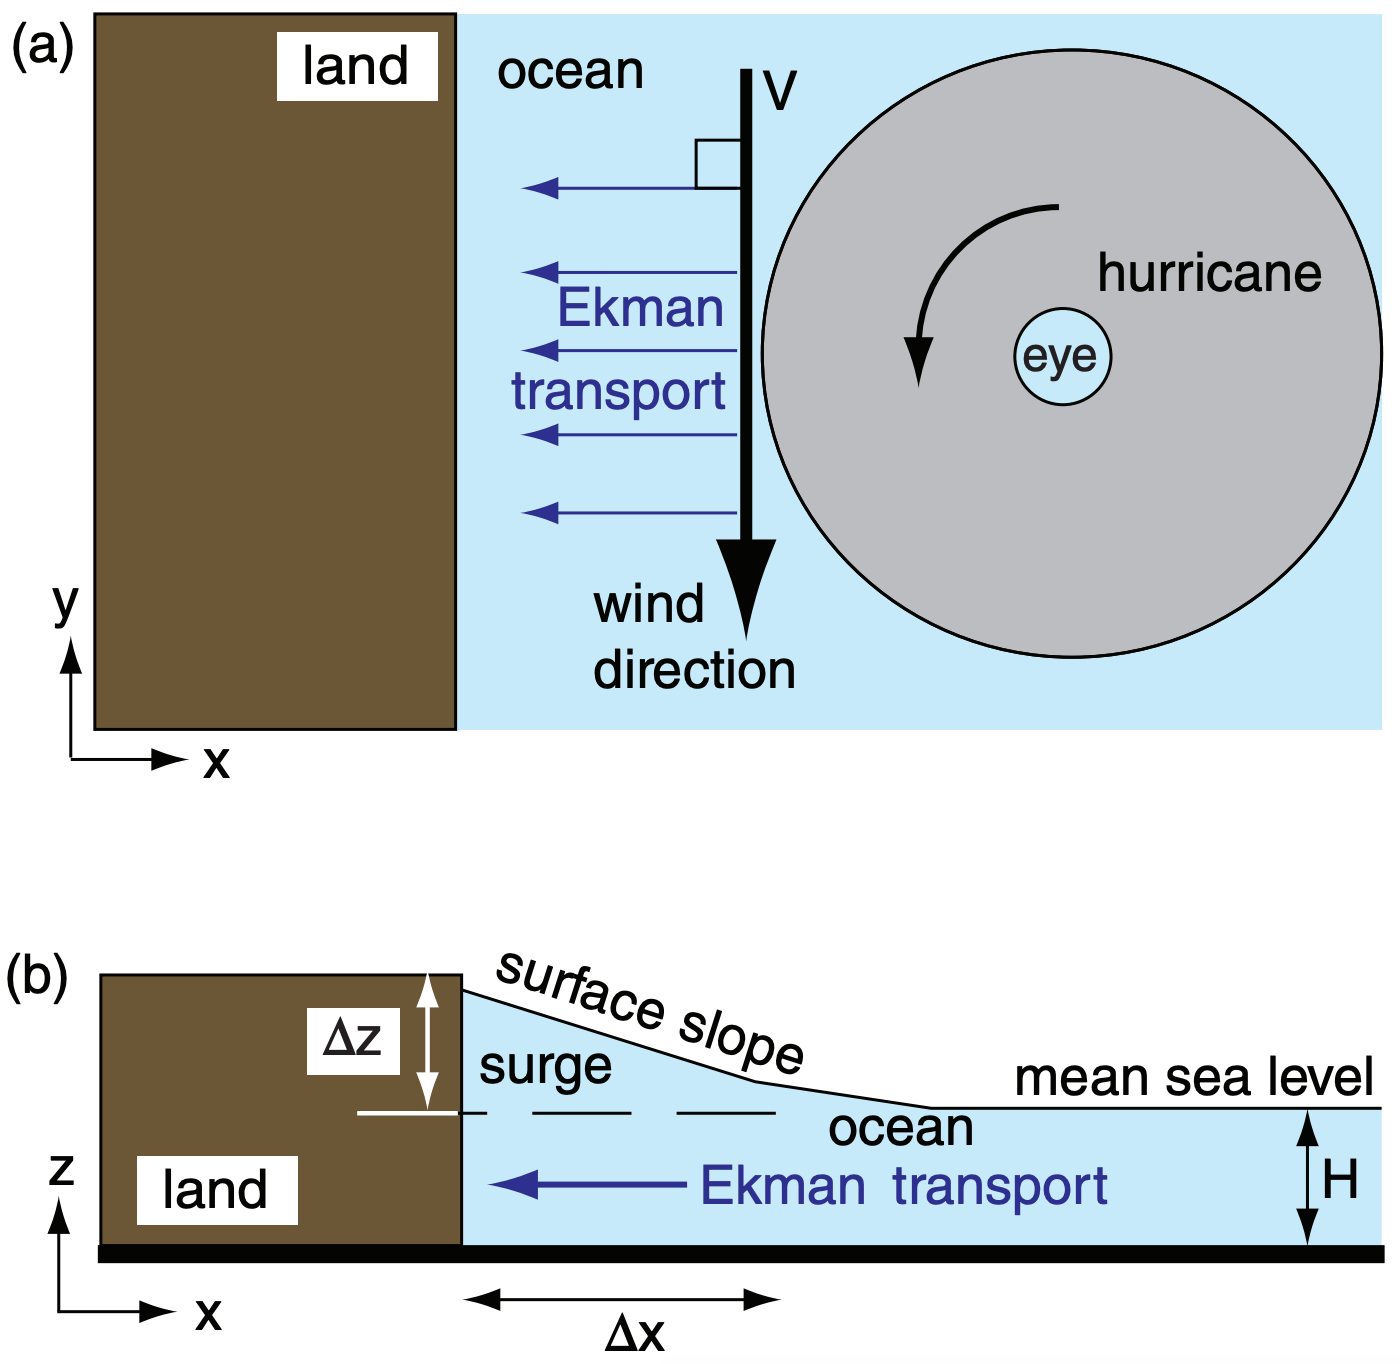
As a tropical cyclone approaches the eastern coast of continents, the winds along the front edge of the tropical cyclone are parallel to the coast, from north to south in the Northern Hemisphere. Hence, there is net Ekman transport of water directly toward the shore, where it begins to pile up, creating a storm surge (Fig. 16.43).
If the tropical cyclone were to hover just offshore for sufficient time to allow a steady-state condition to develop, then the Ekman transport toward the shore would be balanced by downslope sloshing of the surge. The surge slope ∆z/∆x for that hypothetical equilibrium is:
\(\ \begin{align} \frac{\Delta z}{\Delta x} \approx \frac{\rho_{a i r}}{\rho_{w a t e r}} \cdot \frac{C_{D} \cdot V^{2}}{|g| \cdot H}\tag{16.22}\end{align}\)
where H is the unperturbed ocean depth (e.g., 50 m) near the coast, and the other variables are the same as for eq. (16.21).
| Table 16-7. Storm surge height S and sea-level pressure Peye, from the old Saffir-Simpson classification. CAUTION: Actual storm-surge heights can vary significantly from these typical values. This is one of the reasons why the new Saffir-Simpson scale doesn’t use S. | ||
| Category | Peye (kPa) | S (m) |
|---|---|---|
| 1 | ≥ 98.0 | 1.2 - 1.6 |
| 2 | 97.9 - 96.5 | 1.7 - 2.5 |
| 3 | 96.4 - 94.5 | 2.6 - 3.9 |
| 4 | 94.4 - 92.0 | 4.0 - 5.5 |
| 5 | < 92.0 | > 5.5 |
Sample Application
For tropical cyclone-force winds of 40 m s–1, over a continental shelf portion of ocean of depth 50 m, find the volume transport rate and equilibrium surge slope. Assume CD = 0.01 .
Find the Answer
Given: ρair = 1.225 kg·m–3, ρwater = 1025 kg·m–3, M = 40 m s–1, H = 50 m, CD = 0.01
Find: Vol/(∆t·∆y) = ? m2 s–1, and ∆z/∆x = ?
Assume: fc = 0.00005 s–1
Use eq. (16.21):
\(\frac{V o l}{\Delta t \cdot \Delta y}=\frac{\left(1.225 \mathrm{kg} / \mathrm{m}^{3}\right)}{\left(1025 \mathrm{kg} / \mathrm{m}^{3}\right)} \cdot \frac{(0.01) \cdot(40 \mathrm{m} / \mathrm{s})^{2}}{\left(0.00005 \mathrm{s}^{-1}\right)}=\underline{\mathbf{382 \mathrm{m}^{2}\mathrm{s^{-1}}}}\)
Use eq. (16.22):
\(\frac{\Delta z}{\Delta x} \approx \frac{\left(1.225 \mathrm{kg} / \mathrm{m}^{3}\right)}{\left(1025 \mathrm{kg} / \mathrm{m}^{3}\right)} \cdot \frac{(0.01) \cdot(40 \mathrm{m} / \mathrm{s})^{2}}{\left(9.8 \mathrm{m} / \mathrm{s}^{2}\right) \cdot(50 \mathrm{m})}=\underline{\mathbf{3.9 \times 10^{-5}}}\)
Check: Units OK. Physics OK.
Exposition: The flow of water is tremendous. As it starts to pile up, the gradient of sea-level begins to drive water away from the surge, so it does not continue growing. The slope corresponds to 4 cm rise per km distance toward the shore. Over 10s to 100s km, the rise along the coast can be significant.
16.8.2.3. Kelvin Wave
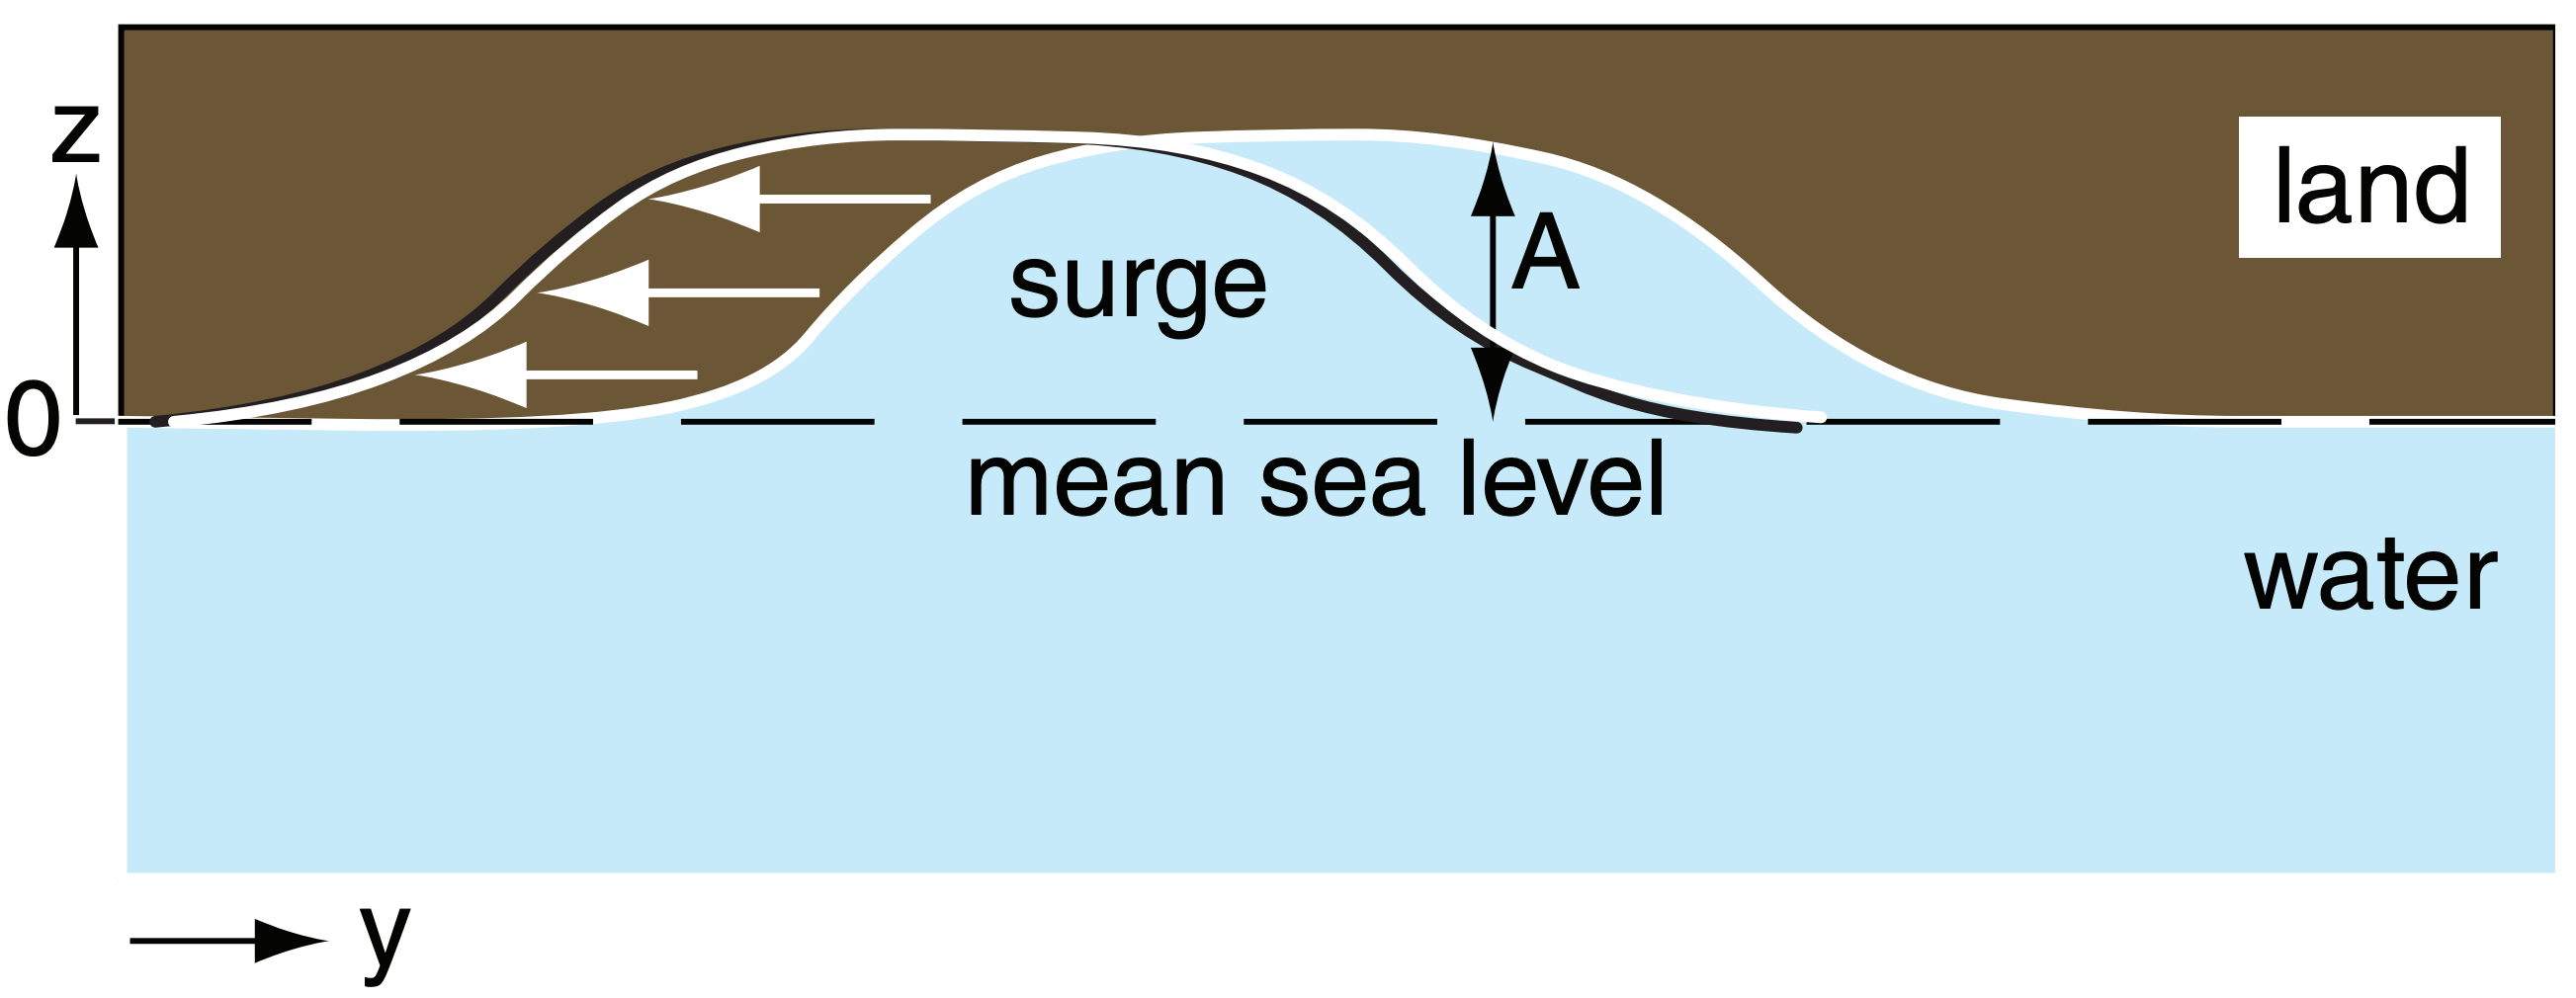
Because the tropical cyclone has finite size, Ekman transport is localized to the region immediately in front of the tropical cyclone. Thus, water is piled higher between the tropical cyclone and the coast than it is further north or south along the coast. When viewed from the East, the surge appears as a long-wavelength wave, called a Kelvin wave (Fig. 16.44).
The propagation speed of the wave, called the phase speed c, is
\(\ \begin{align} c=\sqrt{|g| \cdot H}\tag{16.23}\end{align}\)
which is also known as the shallow-water wave speed, where |g| is gravitational acceleration magnitude and H is average water depth. Typical phase speeds are 15 to 30 m s–1. These waves always travel with the coast to their right in the Northern Hemisphere, so they propagate southward along the east coast of continents, and northward along west coasts.
As the wave propagates south along the East Coast, it will hug the coast and inundate the shore immediately south of the tropical cyclone. Meanwhile, Ekman transport continues to build the surge in the original location. The net result is a continuous surge of high water along the shore that is closest to, and south of, the tropical cyclone. Typical surge depths can be 2 to 10 m at the coast, with extreme values of 13 to 20 m.
Should the tropical cyclone move southward at a speed nearly equal to the Kelvin wave speed, then Ekman pumping would continue to reinforce and build the surge, causing the amplitude of the wave A to grow according to:
\(\ \begin{align} \frac{\Delta A}{\Delta t} \approx \frac{\rho_{\text {air}}}{\rho_{\text {watter}}} \cdot \frac{C_{D} \cdot V^{2}}{\sqrt{|g| \cdot H}}\tag{16.24}\end{align}\)
where the amplitude A is measured as maximum height of the surge above mean sea level, and the other variables are the same as for eq. (16.21).
Sample Application
Using info from the previous Sample Application, find the Kelvin wave phase speed, and the growth rate if the tropical cyclone follows the wave southward.
Find the Answer
Given: (same as previous example)
Find: c = ? m s–1, ∆A/∆t = ? m s–1
Use eq. (16.23):
\(c=\sqrt{\left(9.8 \mathrm{m} / \mathrm{s}^{2}\right) \cdot(50 \mathrm{m})}=\underline{\bf{22.1 \mathrm{m} \mathrm{s}^{-1}}}\)
Use eq. (16.24):
\(\begin{aligned} \frac{\Delta A}{\Delta t} & \approx \frac{\left(1.225 \mathrm{kg} / \mathrm{m}^{3}\right)}{\left(1025 \mathrm{kg} / \mathrm{m}^{3}\right)} \cdot \frac{(0.01) \cdot(40 \mathrm{m} / \mathrm{s})^{2}}{\sqrt{\left(9.8 \mathrm{m} / \mathrm{s}^{2}\right) \cdot(50 \mathrm{m})}}=\underline{\bf{0.00086 \mathrm{m} \mathrm{s}^{-1}}} \end{aligned}\)
Check: Units OK. Physics OK.
Exposition: Tropical cyclones usually turn northward. If tropical cyclones were to translate southward with speed 22.1 m s–1, matching the Kelvin wave speed, then an exceptionally dangerous situation would develop with amplification of the surge by over 3 m h–1.
16.8.3. Surface Wind-waves
Waves are generated on the sea surface by action of the winds. Greater winds acting over longer distances (called fetch) for greater time durations can excite higher waves. High waves caused by tropical cyclone-force winds are not only a hazard to shipping, but can batter structures and homes along the coast.
Four coastal hazards of a tropical cyclone are:
- wave scour of the beach under structures,
- wave battering of structures,
- surge flooding, and
- wind damage.
The first two hazards exist only right on the coast, in the beach area. But the inundation (flooding) from the storm surge can reach 10 to 15 km inland from the coast, depending on the slope of the land.
For wind speeds M up to tropical cyclone force, the maximum-possible wave height (for unlimited fetch and duration) can be estimated from:
\(\ \begin{align} h=h_{2} \cdot\left(\frac{M}{M_{2}}\right)^{3 / 2}\tag{16.25}\end{align}\)
where h2 = 4 m and M2 = 10 m s–1. Wave heights are plotted in Fig. 16.45.
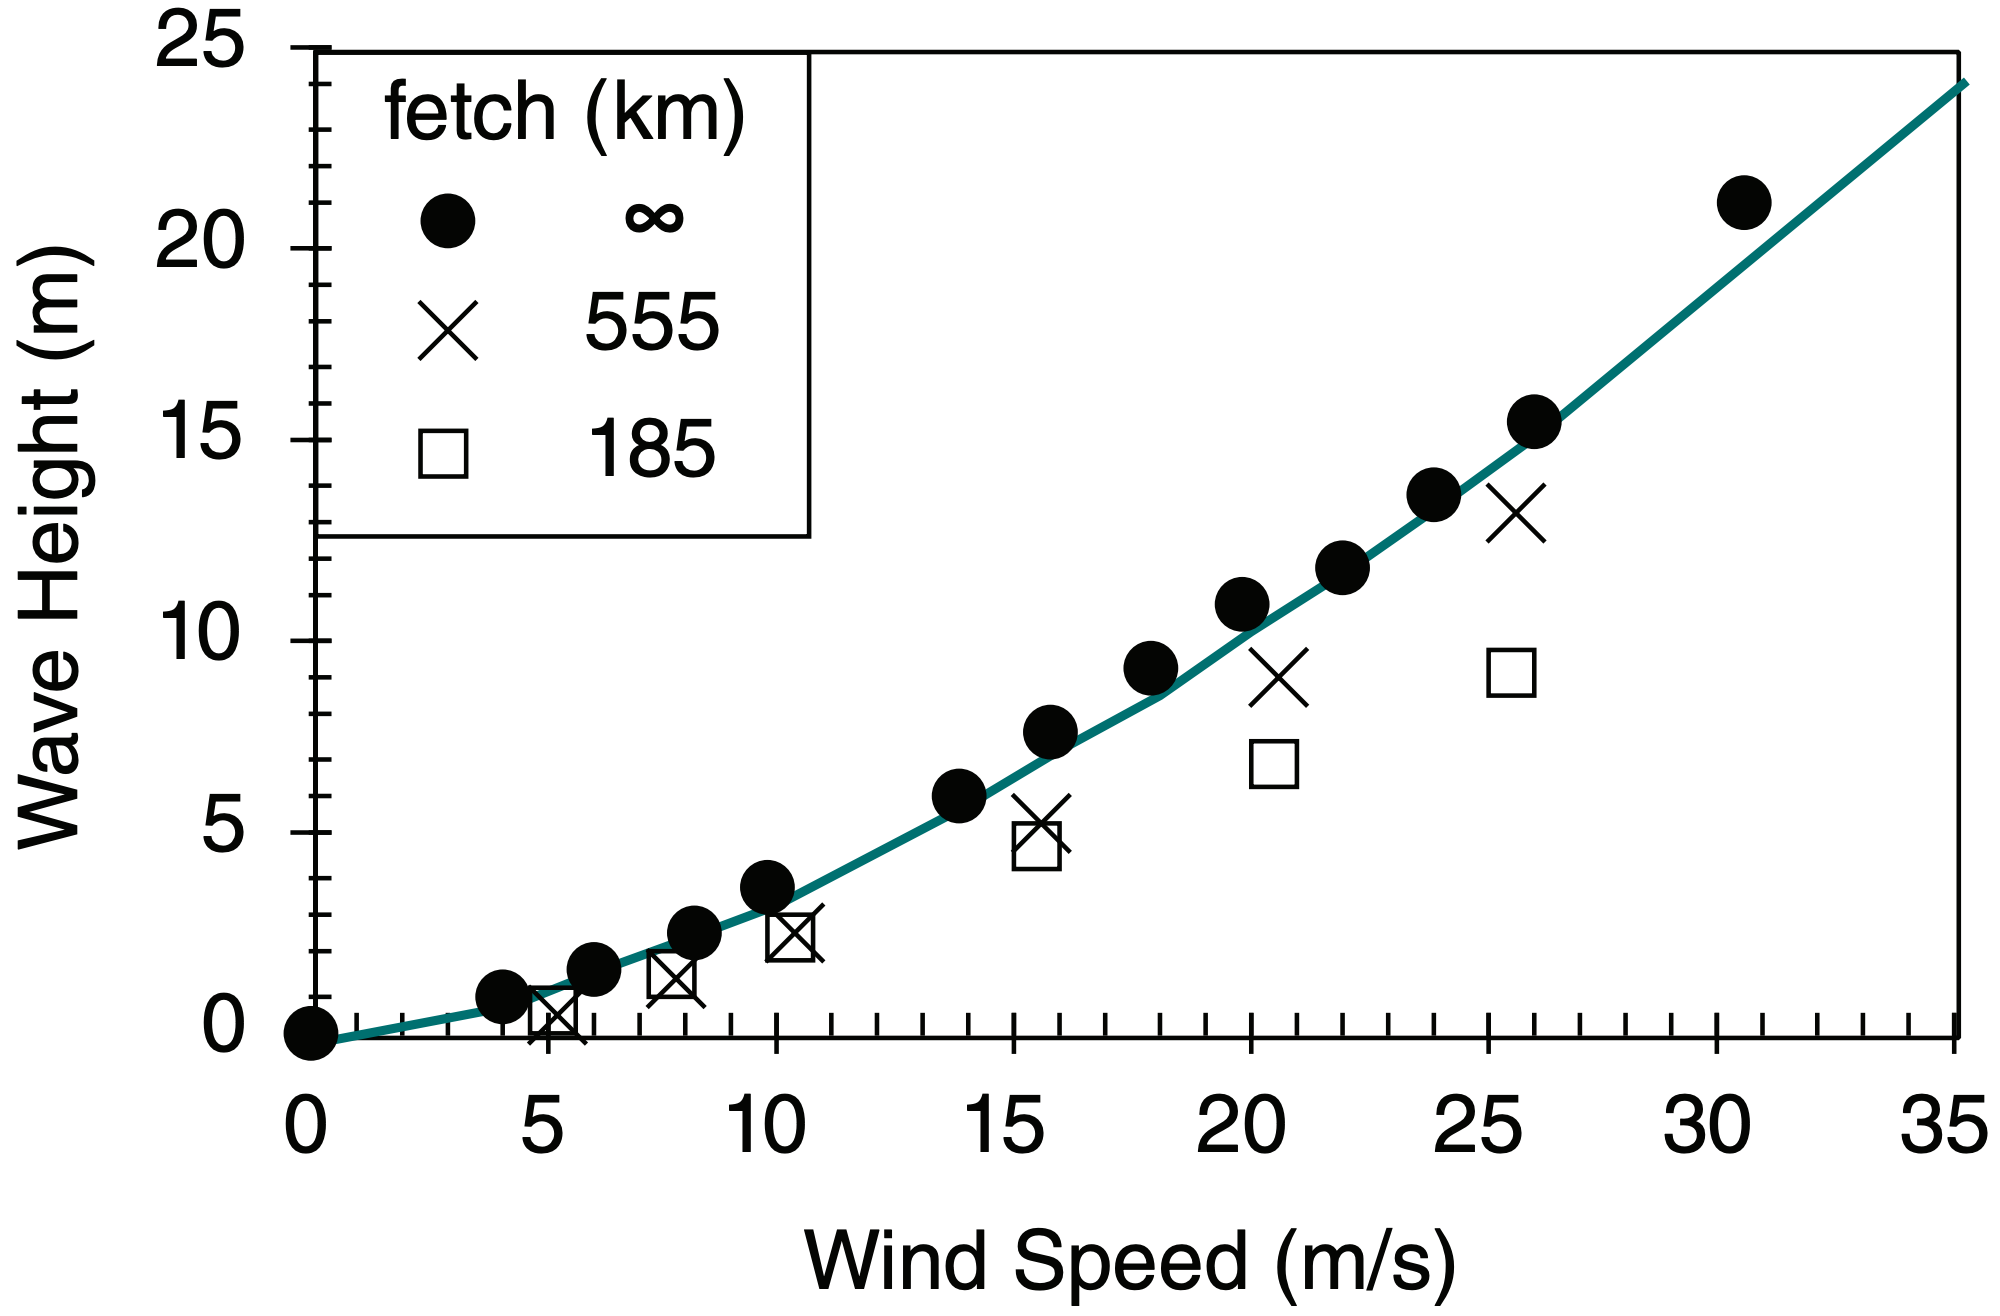
As winds increase beyond tropical cyclone force, the wave tops become partially chopped off by the winds. Thus, wave height does not continue to increase according to eq. (16.25). For extreme winds of 70 m s–1, the sea surface is somewhat flat, but poorly defined because of the mixture of spray, foam, and chaotic seas that appear greenish white during daytime.
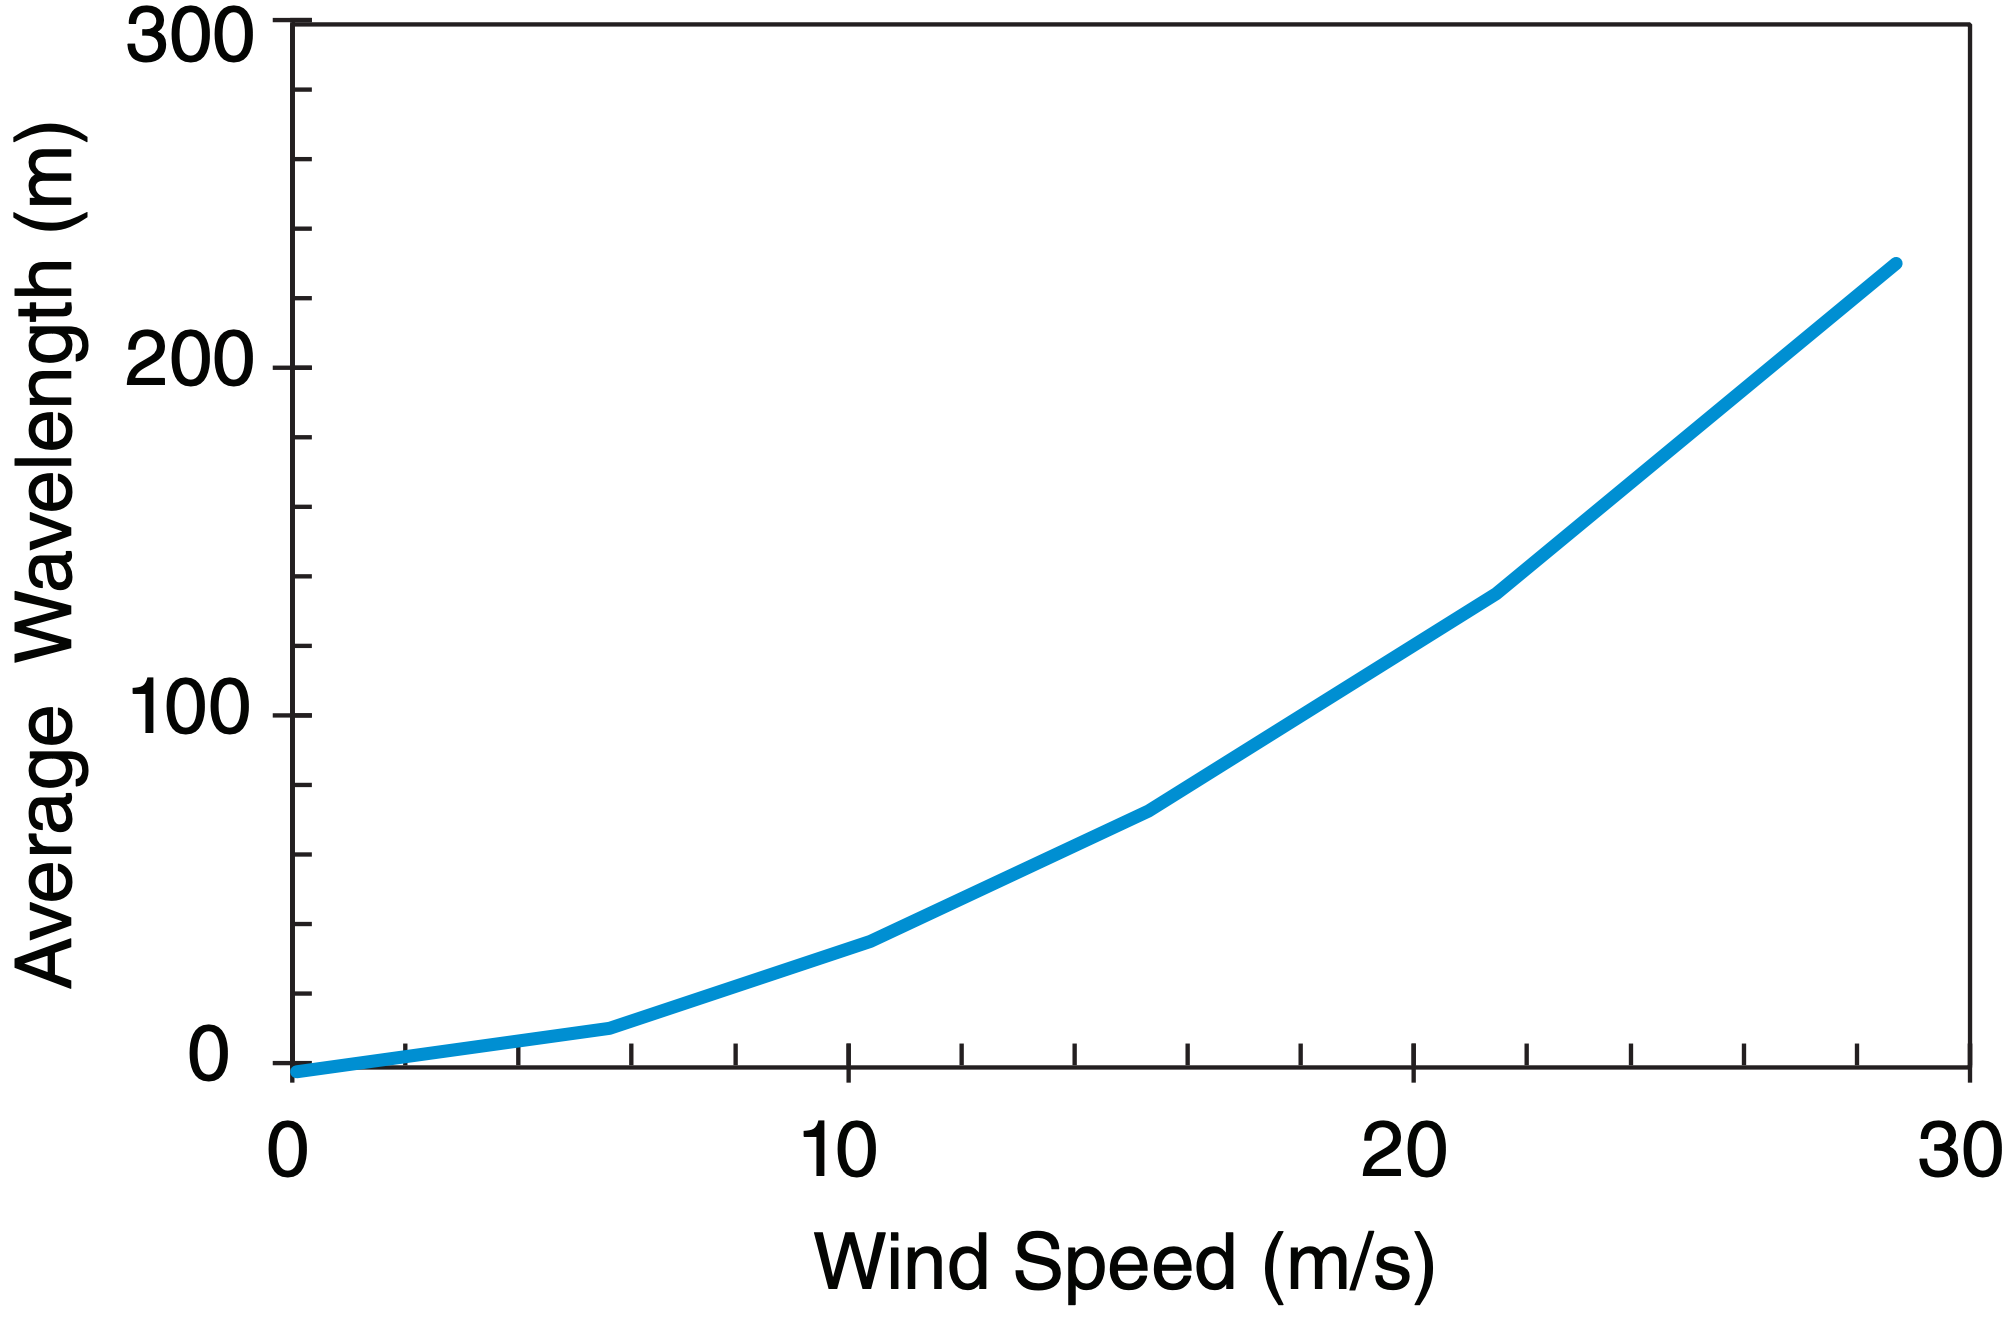
Wavelengths of the wind-waves also increase with wind speed. Average wavelengths λ can be approximated by:
\(\ \begin{align} \lambda=\lambda_{2}\left(\frac{M}{M_{2}}\right)^{1.8}\tag{16.26}\end{align}\)
where λ2 = 35 m, and M2 = 10 m s–1. Wavelengths are plotted in Fig. 16.46.
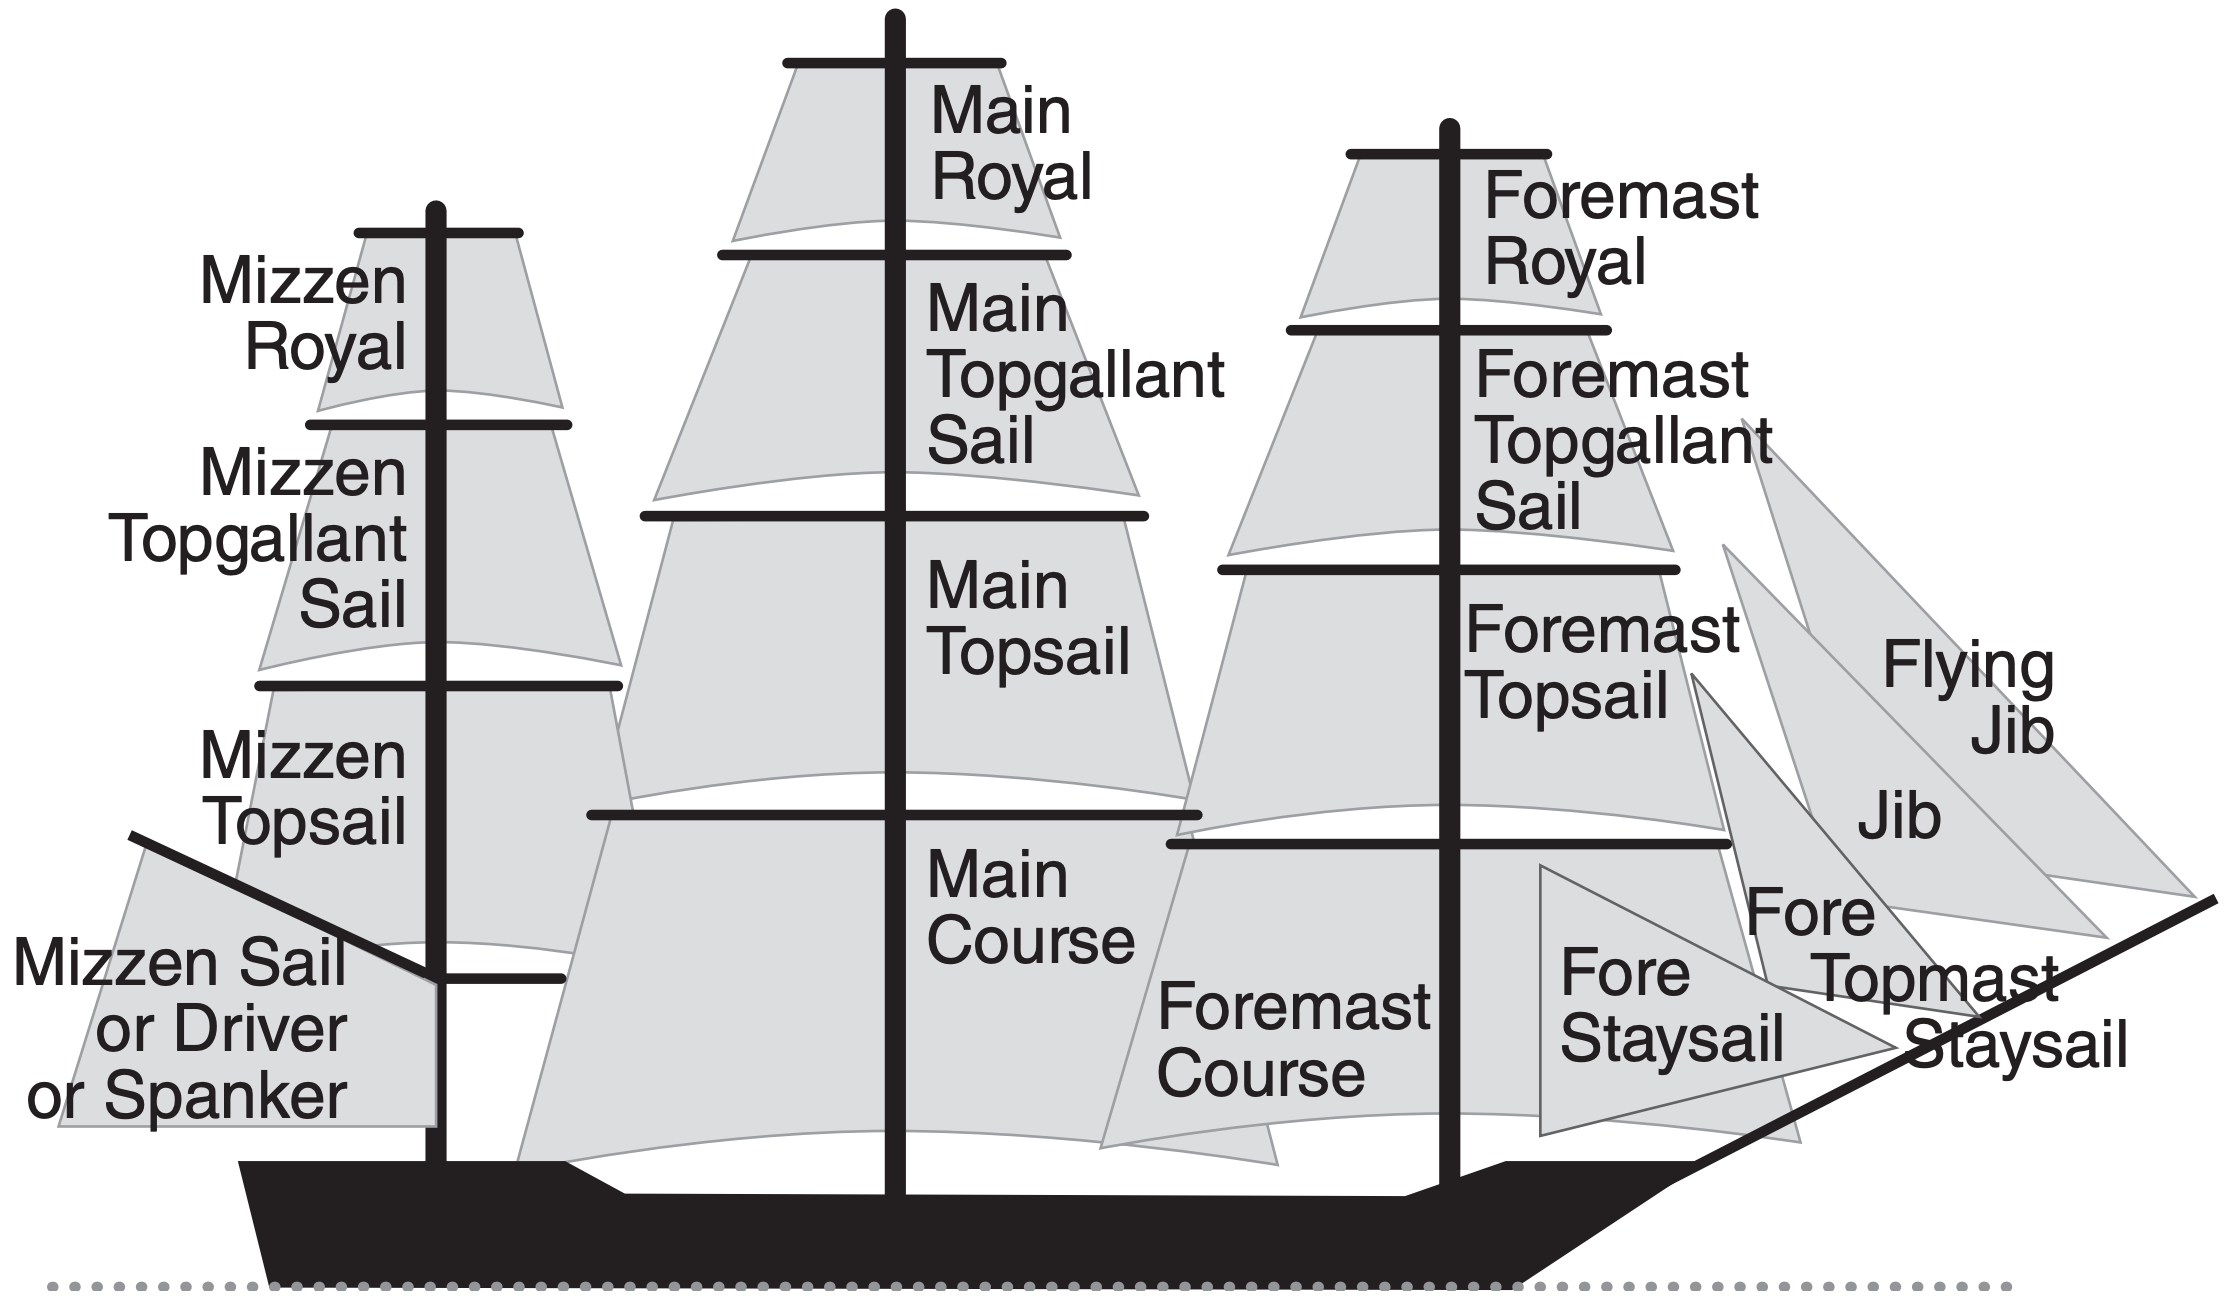
In 1805, Admiral Beaufort of the British Navy devised a system to estimate and report wind speeds based on the amount of canvas sail that a full-rigged frigate could carry. It was updated in 1874, as listed in Table 16-8 for historical interest. Modern descriptors for the Beaufort wind scale are in Table 16-9.
| Table 16-8. Legend: B = Beaufort number; D = modern classification; M = wind speed in knots (2 knots ≈ 1 m s–1), S1 = speed through smooth water of a well-conditioned man-of-war carrying all sails un-reefed (full), sailing close to the wind; S2 = un-reefed (full) sails that a well-conditioned manof-war could just carry in chase, sailing close to the wind; S3 = sails that a well-conditioned man-of-war could scarcely bear. [A reefed sail exposes less than its full area to the wind.] | |||
| B | D | M (kt) | Deep Sea Criteria |
|---|---|---|---|
| 0 | Calm | 0 - 1 | S1 = Becalmed |
| 1 | Light Air | 1 - 3 | S1 = Just sufficient to give steerageway |
| 2 | Slight Breeze | 4 - 6 | S1 = 1 - 2 knots |
| 3 | Gentle Breeze | 7 - 10 | S1 = 3 - 4 knots |
| 4 | Moderate Breeze | 11 - 16 | S1 = 5 - 6 knots |
| 5 | Fresh Breeze | 17 - 21 | S2 = Royals, etc. |
| 6 | Strong Breeze | 22 - 27 | S2 = Topgallant sails |
| 7 | High Wind | 28 - 33 | S2 = Topsails, jib, etc. |
| 8 | Gale | 34 - 40 | S2 = Reefed upper topsails and courses |
| 9 | Strong Gale | 41 - 48 | S2 = Lower topsails and courses |
| 10 | Whole Gale | 49 - 55 | S3 = lower main topsail and reefed foresail |
| 11 | Storm | 56 - 65 | S3 = storm staysails |
| 12 | Hurricane | > 65 | S3 = no canvas |
The longest wavelength waves are called swell, and can propagate large distances, such as across whole oceans. Hence, a tropical cyclone in the middle tropical Atlantic can cause large surf in Florida well before the storm reaches the coast.
Wind and waves as affect mariners are classified according to the Beaufort scale. The INFO Box with Table 16-8 gives a historical description of the Beaufort scale. A modern description is in Table 16-9.
| Table 16-9. Beaufort wind scale. B = Beaufort Number. (See INFO Box for historical info.) | ||||||
| B | Description | Wind Speed | Wave Height (m) | Sea Conditions (in deep ocean) | Land Conditions | |
|---|---|---|---|---|---|---|
| (km/h) | (m/s) | |||||
| 0 | Calm | < 1 | < 0.3 | 0 | Flat. | Calm. Smoke rises vertically. |
| 1 | Light Air | 1 - 5 | 0.3 - 1.5 | 0 -00.2 | Ripples without crests. | Wind motion visible in smoke. |
| 2 | Light Breeze | 6 - 11 | 1.5 - 3.3 | 0.2 - 0.5 | Small wavelets. Crests of glassy appearance, not breaking. | Wind felt on exposed skin. Leaves rustle. |
| 3 | Gentle Breeze | 12 - 19 | 3.3 - 5.5 | 0.5 - 1 | Large wavelets. Crests begin to break; scattered whitecaps. | Leaves and smaller twigs in constant motion. |
| 4 | Moderate Breeze | 20 - 28 | 5.5 - 8.0 | 1 - 2 | Small waves with breaking crests. Fairly frequent whitecaps. | Dust and loose paper raised. Small branches begin to move. |
| 5 | Fresh Breeze | 29 - 38 | 8.0 - 11 | 2 - 3 | Moderate waves of some length. Many whitecaps. Small amounts of spray. | Branches of a moderate size move. Small trees begin to sway. |
| 6 | Strong Breeze | 39 - 49 | 11 - 14 | 3 - 4 | Long waves begin to form. White foam crests are very frequent. Some airborne spray is present. | Large branches in motion. Whistling heard in overhead wires. Umbrella use becomes difficult. Empty plastic garbage cans tip over. |
| 7 | High Wind, Moderate Gale, Near Gale | 50 - 61 | 14 - 17 | 4 - 5.5 | Sea heaps up. Some foam from breaking waves is blown into streaks along wind direction. Moderate amounts of airborne spray. | Whole trees in motion. Effort needed to walk against the wind. Swaying of skyscrapers may be felt, especially by people on upper floors. |
| 8 | Gale, Fresh Gale | 62 - 74 | 17 - 20 | 5.5 - 7.5 | Moderately high waves with breaking crests forming spindrift. Well-marked streaks of foam are blown along wind direction. Considerable airborne spray. | Some twigs broken from trees. Cars veer on road. Progress on foot is seriously impeded. |
| 9 | Strong Gale | 75 - 88 | 21 - 24 | 7 - 10 | High waves whose crests sometimes roll over. Dense foam is blown along wind direction. Large amounts of airborne spray may begin to reduce visibility. | Some branches break off trees, and some small trees blow over. Construction/temporary signs and barricades blow over. Damage to circus tents and canopies. |
| 10 | Storm, Whole Gale | 89 - 102 | 25 - 28 | 9 - 12.5 | Very high waves with overhanging crests. Large patches of foam from wave crests give the sea a white appearance. Considerable tumbling of waves with heavy impact. Large amounts of airborne spray reduce visibility | Trees are broken off or uprooted, saplings bent and deformed. Poorly attached asphalt shingles and shingles in poor condition peel off roofs. |
| 11 | Violent Storm | 103 - 117 | 29 - 32 | 11.5 - 16 | Exceptionally high waves. Very large patches of foam, driven before the wind, cover much of the sea surface. Very large amounts of airborne spray severely reduce visibility. | Widespread vegetation damage. Many roofing surfaces are damaged; asphalt tiles that have curled up and/or fractured due to age may break away completely. |
| 12 | Hurricane | ≥ 118 | ≥ 33 | ≥14 | Huge waves. Sea is completely white with foam and spray. Air is filled with driving spray, greatly reducing visibility. | Very widespread damage to vegetation. Some windows may break; mobile homes and poorly constructed sheds and barns are damaged. Debris may be hurled about. |
Tides, storm surges, and wind waves are additive (Fig. 16.47). Namely, if the storm surge and high waves happen to occur during high tide according to routine astronomic tide tables, then the coastal destruction is likely to be greatest.
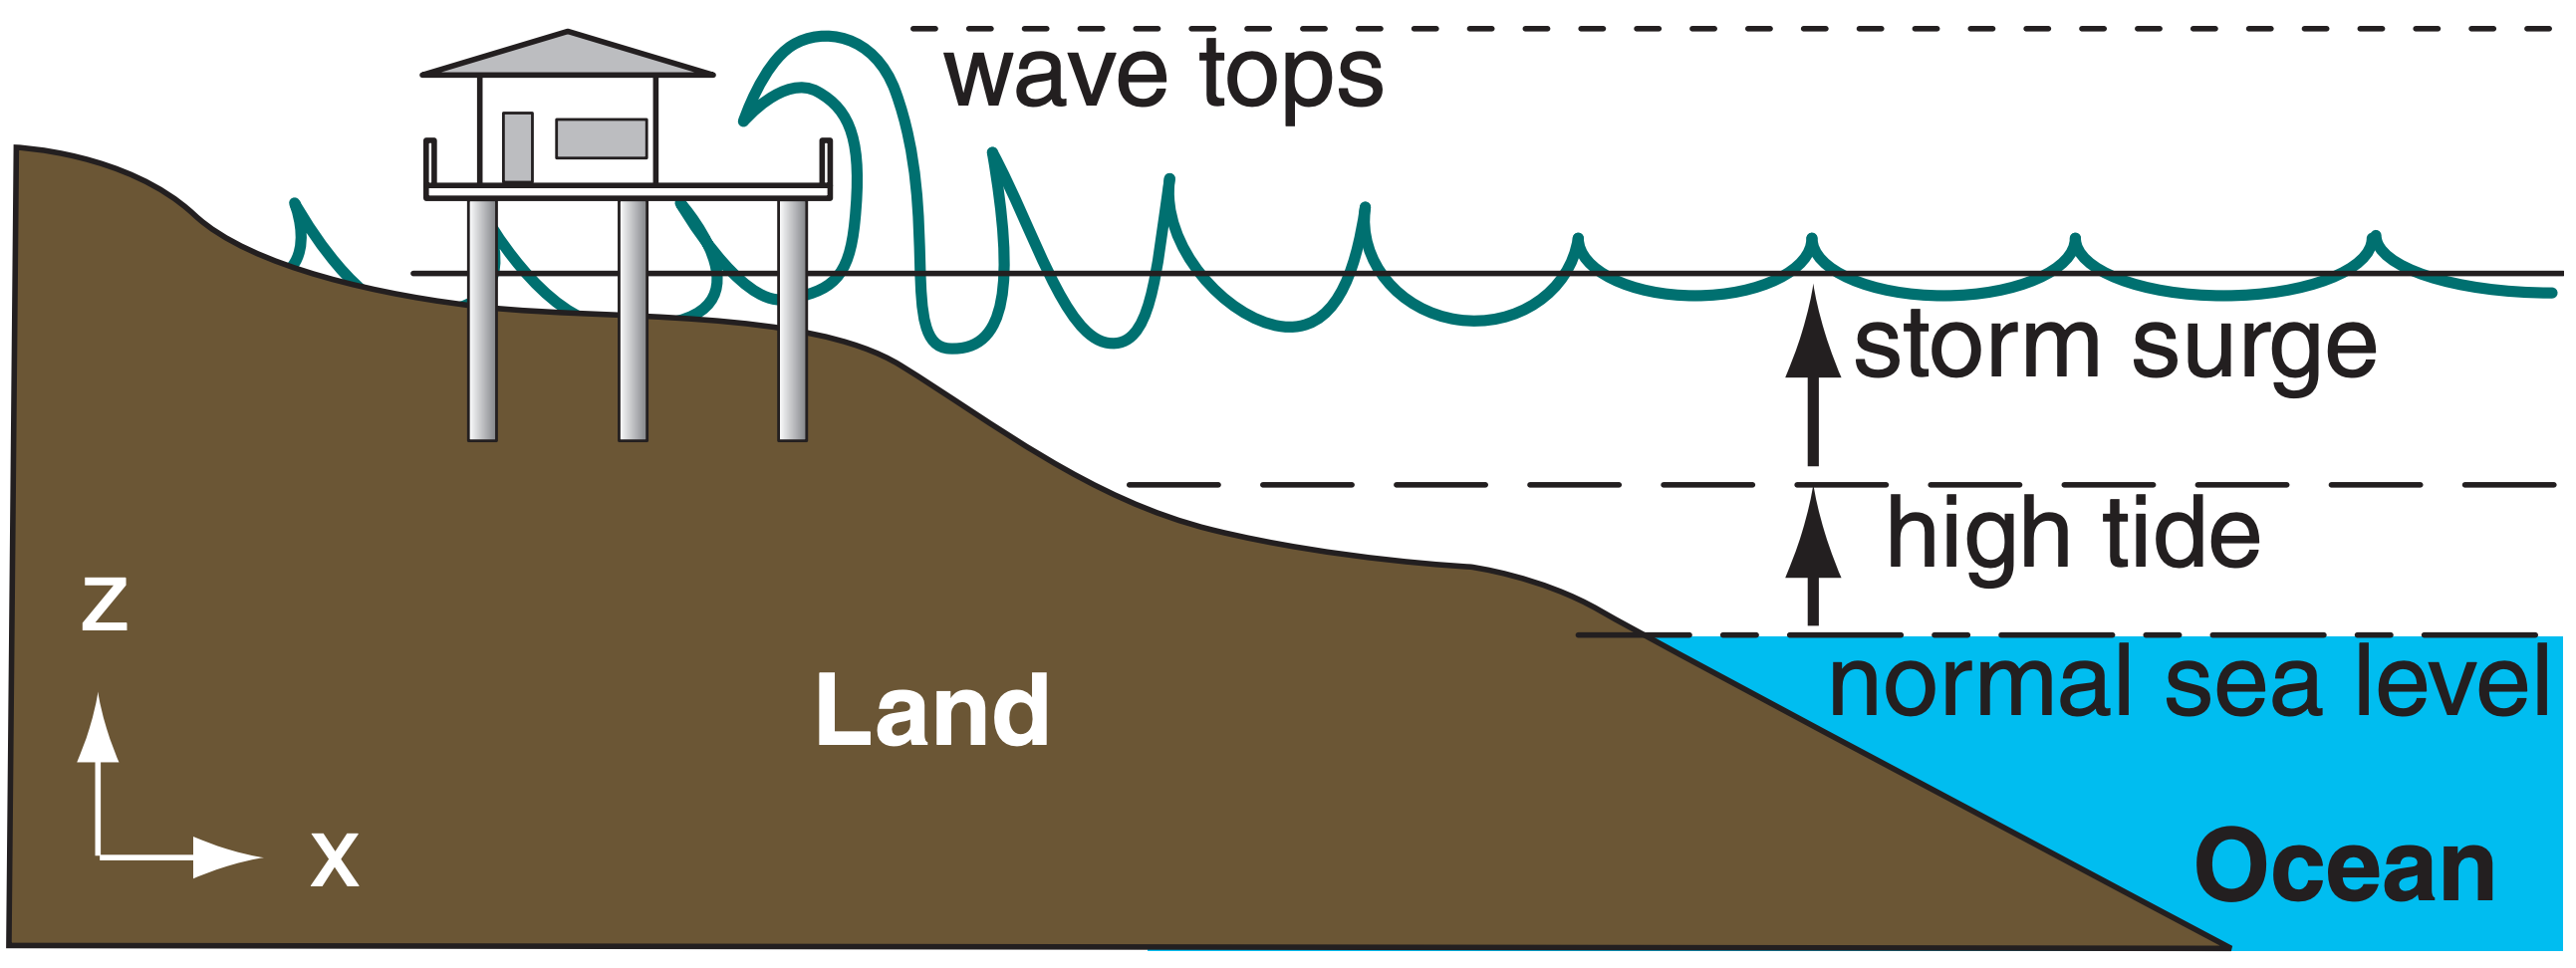
For safety, houses at coasts threatened with storm surges and tsunami are usually built on top of concrete or steel piles. These piles are driven very deep into the land to survive wave scour and erosion of the land. While the floor deck is above expected storm-surge plus high tide levels in this figure, the waves can still batter and damage the structure.
Sample Application
Find the maximum possible wave height (assuming unlimited fetch) and wavelength for tropical cyclone force winds of 35 m s–1.
Find the Answer
Given: M = 35 m s–1
Find: h = ? m, λ = ? m
Use eq. (16.25):
\(h=(4 m) \cdot\left(\frac{35 m / s}{10 m / s}\right)^{3 / 2}=\underline{\bf{26.2 m}}\)
Use eq. (16.26):
\(\lambda=(35 \mathrm{m}) \cdot\left(\frac{35 \mathrm{m} / \mathrm{s}}{10 \mathrm{m} / \mathrm{s}}\right)^{1.8}=\underline{\bf{334 m}}\)
Check: Units OK. Physics OK. Agrees with Figs.
Exposition: Wavelengths are much longer than wave heights. Thus, wave slopes are small — less that 1/10. Only when these waves reach shore does wave slope grow until the waves break as surf.
16.8.4. Inland Flooding
In developed countries such as the USA, stormsurge warning and evacuation systems are increasingly successful in saving lives of coastal dwellers. However, inland flooding due to heavy rain from decaying tropical storms is increasingly fatal — causing roughly 60% of the tropical cyclone-related deaths in the USA during the past 30 years.
Streams and storm drains overflow, trapping people in cars and on roof tops. For this reason, people should not be complacent about former tropical cyclones reaching their inland homes, because these dying tropical cyclones contain so much tropical moisture that they can cause record-setting rainfalls.
The inland flooding hazard can affect people hundreds of kilometers from the coast. Of the 56 people who died in Hurricane Floyd (1999) in the eastern USA, 50 drowned in inland floods caused by heavy rains. Tropical storm Alberto dropped 53 cm of rain over Americus, Georgia, where 33 people drowned in 1994. Over 200 people drowned in Pennsylvania, New York, and New England from Hurricane Diane in 1955.
More recently, many unnecessary drowning fatalities have been caused by people driving into water of unknown depth covering the road. For people comfortable in driving their usual roads day after day, many find it hard to believe that these roads can become impassable. They unknowingly drive into deep water, causing the engine to stall and the car to stop in the middle of the water. If the water continues to rise, the car and passengers can be carried away. An easy solution is to approach each flooded road with caution, and be prepared to interrupt your journey and wait until the flood waters subside.
16.8.5. Thunderstorms, Lightning & Tornado Outbreaks
Because tropical cyclones are made of thunderstorms, they contain all the same hazards as thunderstorms. These include lightning, downbursts, gust fronts, downpours of rain, and tornadoes (see the Thunderstorm chapter for hazard details). Lightning is somewhat infrequent in the eyewall (about 12 cloud-to-ground strikes per hour), compared to about 1000 strikes per hour for midlatitude MCSs.
Tropical cyclones can cause tornado outbreaks. For example, Hurricanes Cindy and Katrina each spawned 44 tornadoes in the USA in 2005. Hurricane Rita spawned 101 tornadoes in Sep 2005. Hurricanes Frances and Ivan spawned 103 and 127 tornadoes, respectively, in Sep 2004.
Most tornadoes are weak (≤ EF2), and occur in the right front quadrant of tropical cyclones in the N. Hemisphere. Although some form near the eyewall, most tornadoes form in the thunderstorms of outer rain bands 80 to 480 km from the cyclone center.


