18.1: Static Stability - a Review
- Page ID
- 9645
\( \newcommand{\vecs}[1]{\overset { \scriptstyle \rightharpoonup} {\mathbf{#1}} } \)
\( \newcommand{\vecd}[1]{\overset{-\!-\!\rightharpoonup}{\vphantom{a}\smash {#1}}} \)
\( \newcommand{\dsum}{\displaystyle\sum\limits} \)
\( \newcommand{\dint}{\displaystyle\int\limits} \)
\( \newcommand{\dlim}{\displaystyle\lim\limits} \)
\( \newcommand{\id}{\mathrm{id}}\) \( \newcommand{\Span}{\mathrm{span}}\)
( \newcommand{\kernel}{\mathrm{null}\,}\) \( \newcommand{\range}{\mathrm{range}\,}\)
\( \newcommand{\RealPart}{\mathrm{Re}}\) \( \newcommand{\ImaginaryPart}{\mathrm{Im}}\)
\( \newcommand{\Argument}{\mathrm{Arg}}\) \( \newcommand{\norm}[1]{\| #1 \|}\)
\( \newcommand{\inner}[2]{\langle #1, #2 \rangle}\)
\( \newcommand{\Span}{\mathrm{span}}\)
\( \newcommand{\id}{\mathrm{id}}\)
\( \newcommand{\Span}{\mathrm{span}}\)
\( \newcommand{\kernel}{\mathrm{null}\,}\)
\( \newcommand{\range}{\mathrm{range}\,}\)
\( \newcommand{\RealPart}{\mathrm{Re}}\)
\( \newcommand{\ImaginaryPart}{\mathrm{Im}}\)
\( \newcommand{\Argument}{\mathrm{Arg}}\)
\( \newcommand{\norm}[1]{\| #1 \|}\)
\( \newcommand{\inner}[2]{\langle #1, #2 \rangle}\)
\( \newcommand{\Span}{\mathrm{span}}\) \( \newcommand{\AA}{\unicode[.8,0]{x212B}}\)
\( \newcommand{\vectorA}[1]{\vec{#1}} % arrow\)
\( \newcommand{\vectorAt}[1]{\vec{\text{#1}}} % arrow\)
\( \newcommand{\vectorB}[1]{\overset { \scriptstyle \rightharpoonup} {\mathbf{#1}} } \)
\( \newcommand{\vectorC}[1]{\textbf{#1}} \)
\( \newcommand{\vectorD}[1]{\overrightarrow{#1}} \)
\( \newcommand{\vectorDt}[1]{\overrightarrow{\text{#1}}} \)
\( \newcommand{\vectE}[1]{\overset{-\!-\!\rightharpoonup}{\vphantom{a}\smash{\mathbf {#1}}}} \)
\( \newcommand{\vecs}[1]{\overset { \scriptstyle \rightharpoonup} {\mathbf{#1}} } \)
\(\newcommand{\longvect}{\overrightarrow}\)
\( \newcommand{\vecd}[1]{\overset{-\!-\!\rightharpoonup}{\vphantom{a}\smash {#1}}} \)
\(\newcommand{\avec}{\mathbf a}\) \(\newcommand{\bvec}{\mathbf b}\) \(\newcommand{\cvec}{\mathbf c}\) \(\newcommand{\dvec}{\mathbf d}\) \(\newcommand{\dtil}{\widetilde{\mathbf d}}\) \(\newcommand{\evec}{\mathbf e}\) \(\newcommand{\fvec}{\mathbf f}\) \(\newcommand{\nvec}{\mathbf n}\) \(\newcommand{\pvec}{\mathbf p}\) \(\newcommand{\qvec}{\mathbf q}\) \(\newcommand{\svec}{\mathbf s}\) \(\newcommand{\tvec}{\mathbf t}\) \(\newcommand{\uvec}{\mathbf u}\) \(\newcommand{\vvec}{\mathbf v}\) \(\newcommand{\wvec}{\mathbf w}\) \(\newcommand{\xvec}{\mathbf x}\) \(\newcommand{\yvec}{\mathbf y}\) \(\newcommand{\zvec}{\mathbf z}\) \(\newcommand{\rvec}{\mathbf r}\) \(\newcommand{\mvec}{\mathbf m}\) \(\newcommand{\zerovec}{\mathbf 0}\) \(\newcommand{\onevec}{\mathbf 1}\) \(\newcommand{\real}{\mathbb R}\) \(\newcommand{\twovec}[2]{\left[\begin{array}{r}#1 \\ #2 \end{array}\right]}\) \(\newcommand{\ctwovec}[2]{\left[\begin{array}{c}#1 \\ #2 \end{array}\right]}\) \(\newcommand{\threevec}[3]{\left[\begin{array}{r}#1 \\ #2 \\ #3 \end{array}\right]}\) \(\newcommand{\cthreevec}[3]{\left[\begin{array}{c}#1 \\ #2 \\ #3 \end{array}\right]}\) \(\newcommand{\fourvec}[4]{\left[\begin{array}{r}#1 \\ #2 \\ #3 \\ #4 \end{array}\right]}\) \(\newcommand{\cfourvec}[4]{\left[\begin{array}{c}#1 \\ #2 \\ #3 \\ #4 \end{array}\right]}\) \(\newcommand{\fivevec}[5]{\left[\begin{array}{r}#1 \\ #2 \\ #3 \\ #4 \\ #5 \\ \end{array}\right]}\) \(\newcommand{\cfivevec}[5]{\left[\begin{array}{c}#1 \\ #2 \\ #3 \\ #4 \\ #5 \\ \end{array}\right]}\) \(\newcommand{\mattwo}[4]{\left[\begin{array}{rr}#1 \amp #2 \\ #3 \amp #4 \\ \end{array}\right]}\) \(\newcommand{\laspan}[1]{\text{Span}\{#1\}}\) \(\newcommand{\bcal}{\cal B}\) \(\newcommand{\ccal}{\cal C}\) \(\newcommand{\scal}{\cal S}\) \(\newcommand{\wcal}{\cal W}\) \(\newcommand{\ecal}{\cal E}\) \(\newcommand{\coords}[2]{\left\{#1\right\}_{#2}}\) \(\newcommand{\gray}[1]{\color{gray}{#1}}\) \(\newcommand{\lgray}[1]{\color{lightgray}{#1}}\) \(\newcommand{\rank}{\operatorname{rank}}\) \(\newcommand{\row}{\text{Row}}\) \(\newcommand{\col}{\text{Col}}\) \(\renewcommand{\row}{\text{Row}}\) \(\newcommand{\nul}{\text{Nul}}\) \(\newcommand{\var}{\text{Var}}\) \(\newcommand{\corr}{\text{corr}}\) \(\newcommand{\len}[1]{\left|#1\right|}\) \(\newcommand{\bbar}{\overline{\bvec}}\) \(\newcommand{\bhat}{\widehat{\bvec}}\) \(\newcommand{\bperp}{\bvec^\perp}\) \(\newcommand{\xhat}{\widehat{\xvec}}\) \(\newcommand{\vhat}{\widehat{\vvec}}\) \(\newcommand{\uhat}{\widehat{\uvec}}\) \(\newcommand{\what}{\widehat{\wvec}}\) \(\newcommand{\Sighat}{\widehat{\Sigma}}\) \(\newcommand{\lt}{<}\) \(\newcommand{\gt}{>}\) \(\newcommand{\amp}{&}\) \(\definecolor{fillinmathshade}{gray}{0.9}\)18.1.1. Explanation
Static stability controls the formation of the ABL, and affects ABL wind and temperature profiles. Here is a quick review of information from the Atmospheric Stability chapter.
If a small blob of air (i.e., an air parcel) is warmer than its surroundings at the same height or pressure, the parcel is positively buoyant and rises. If cooler, it is negatively buoyant and sinks. A parcel with the same temperature as its surrounding environment experiences zero buoyant force.
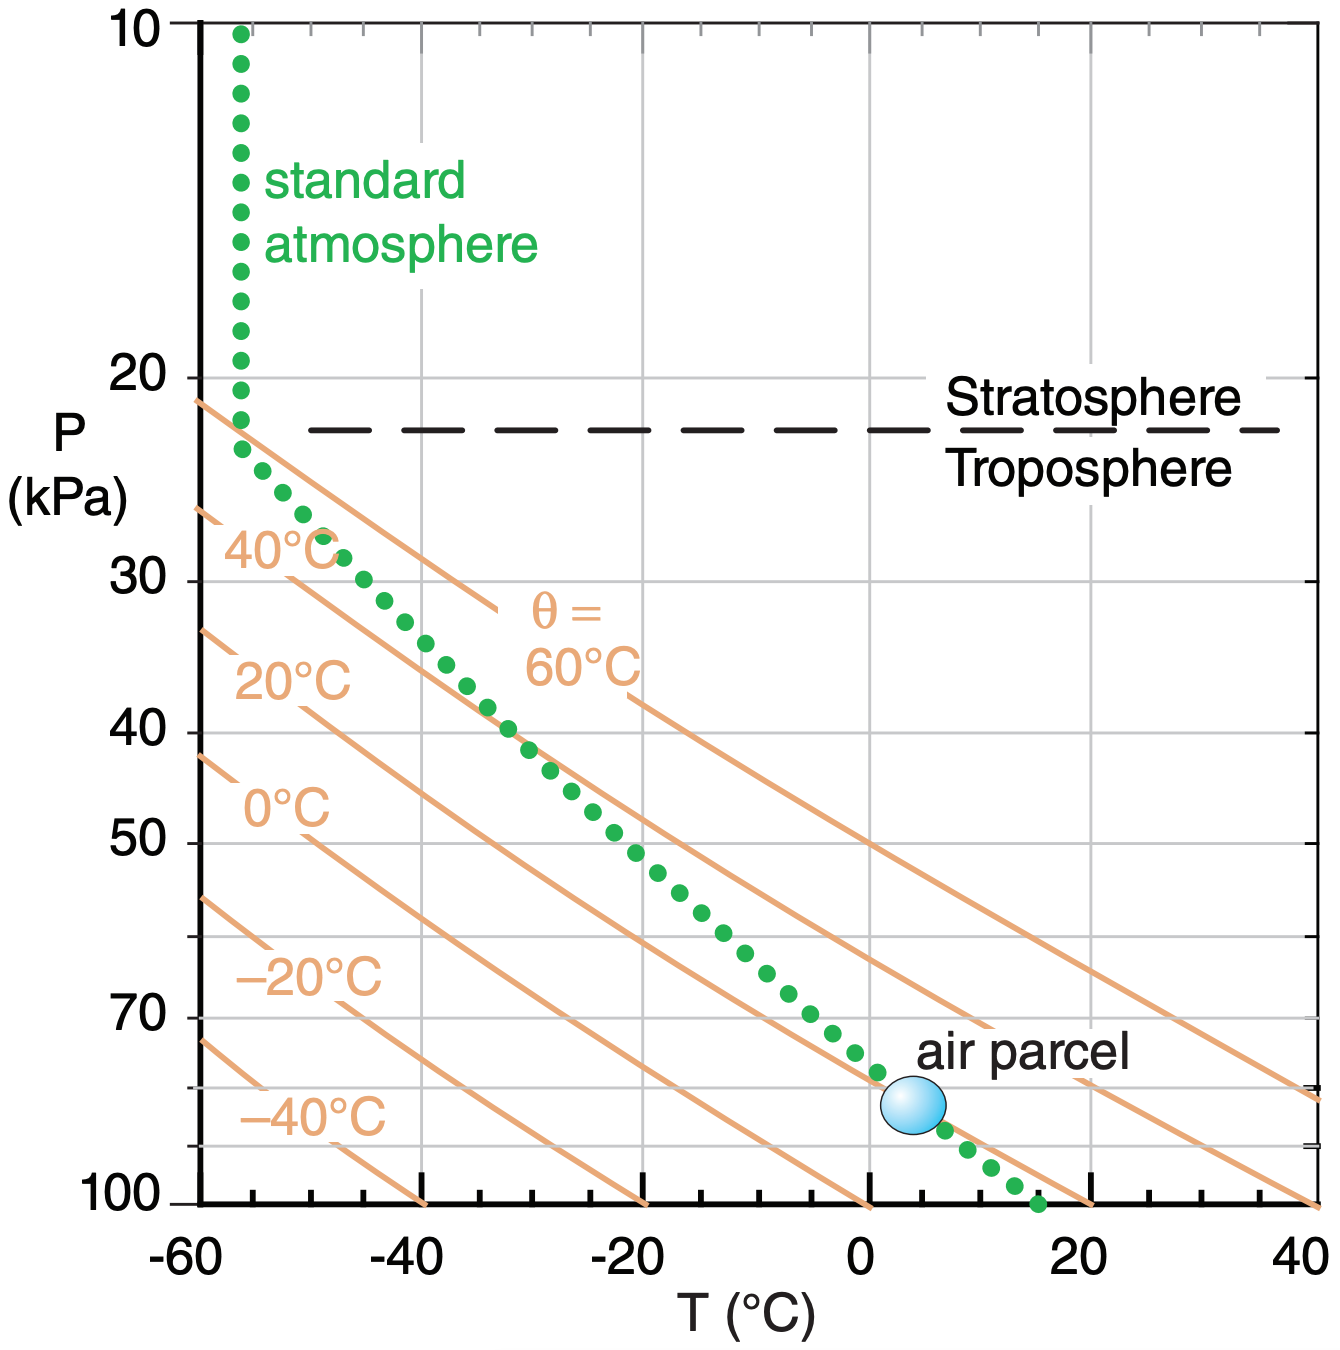
Figure 18.2 shows the standard atmosphere from Chapter 1, plotted on a thermodynamic diagram from the Stability chapter. Let the standard atmosphere represent the environment or the background air. Consider an air parcel captured from one part of that environment (plotted as the circle). At its initial height, the parcel has the same temperature as the surrounding environment, and experiences no buoyant forces.
To determine static stability, you must ask what would happen to the air parcel if it were forcibly displaced a small distance up or down. When moved from its initial capture altitude, the parcel temperature could differ from that of the surrounding environment, thereby causing buoyant forces.
If the buoyant forces on a displaced air parcel push it back to its starting altitude, then the environment is said to be statically stable. In the absence of any other forces, statically stable air flow is laminar. Namely, it is smooth and non-turbulent.
However, if the displaced parcel is pulled further away from its starting point by buoyancy, the portion of the atmosphere through which the air parcel continues accelerating is classified as statically unstable. Unstable regions are turbulent (gusty).
If the displaced air parcel has a temperature equal to that of its new surroundings, then the environment is statically neutral.
When an air parcel moves vertically, its temperature changes adiabatically, as described in previous chapters. Always consider such adiabatic temperature change before comparing parcel temperature to that of the surrounding environment. The environment is usually assumed to be stationary, which means it is relatively unchanging during the short time it takes for the parcel to rise or sink.
If an air parcel is captured at P = 83 kPa and T = 5°C (as sketched in Fig. 18.2), and is then forcibly lifted dry adiabatically, it cools following the θ = 20°C adiabat (one of the thin diagonal lines in that figure). If lifted to a height where the pressure is P = 60 kPa, its new temperature is about T = –20°C.
This air parcel, being colder than the environment (thick dotted line in Fig. 18.2) at that same height, feels a downward buoyant force toward its starting point. Conversely, if displaced downward from its initial height, the parcel would be warmer than its surroundings at its new height, and would feel an upward force toward its starting point.
Air parcels captured from any initial height in the environment of Fig. 18.2 always tend to return to their starting point. Therefore, the standard atmosphere is statically stable. This stability is critical for ABL formation.
Sample Application
Find the vertical gradient of potential temperature in the troposphere for a standard atmosphere.
Find the Answer
Given: ∆T/∆z = –6.5°C km–1 from Chapter 1 eq. (1.16)
Find: ∆θ/∆z = ? °C km–1
Use eq. (3.11) from the Heat chapter:
\(\ \begin{align} \theta(z)=T(z)+\Gamma_{d} \cdot z\tag{3.11}\end{align}\)
where the dry adiabatic lapse rate is Γd = 9.8°C km–1
Apply this at heights z1 and z2, and then subtract the z1 equation from the z2 equation:
θ2 – θ1 = T2 – T1 + Γd·(z2 – z1)
Divide both sides of the equation by (z2 – z1). Then define (z2 – z1) = ∆z , (T2 – T1) = ∆T , and (θ2 – θ1) = ∆θ to give the algebraic form of the answer:
∆θ/∆z = ∆T/∆z + Γd
This eq. applies to any vertical temperature profile.
If we plug in the temperature profile for the standard atmosphere:
∆θ/∆z = ( –6.5°C km–1) + (9.8°C km–1) = 3.3°C km–1
Check: Units OK. Agrees with Fig. 18.2, where θ increases from 15°C at the surface to 51.3°C at 11 km altitude, which gives (51.3–15°C)/(11km) = 3.3°C km–1.
Exposition: θ gradually increases with height in the troposphere, which as we will see tends to gently oppose vertical motions. Although the standard-atmosphere (an engineering specification similar to an average condition) troposphere is statically stable, the real troposphere at any time and place can have layers that are statically stable, neutral, or unstable.
18.1.2. Rules of Thumb for Stability in the ABL
Because of the daily cycle of radiative heating and cooling, there is a daily cycle of static stability in the ABL. ABL static stability can be anticipated as follows, without worrying about air parcels for now.
Unstable air adjacent to the ground is associated with light winds and a surface that is warmer than the air. This is common on sunny days in fairweather. It can also occur when cold air blows over a warmer surface, day or night. In unstable conditions, thermals of warm air rise from the surface to heights of 200 m to 4 km, and turbulence within this layer is vigorous.
At the other extreme are stable layers of air, associated with light winds and a surface that is cooler than the air. This typically occurs at night in fairweather with clear skies, or when warm air blows over a colder surface day or night. Turbulence is weak or sometimes nonexistent in stable layers adjacent to the ground. The stable layers of air are usually shallow (20 - 500 m) compared to the unstable daytime cases.
In between these two extremes are neutral conditions, where winds are moderate to strong and there is little heating or cooling from the surface. These occur during overcast conditions, often associated with bad weather. They also occur in a part of the ABL called the residual layer, defined later.
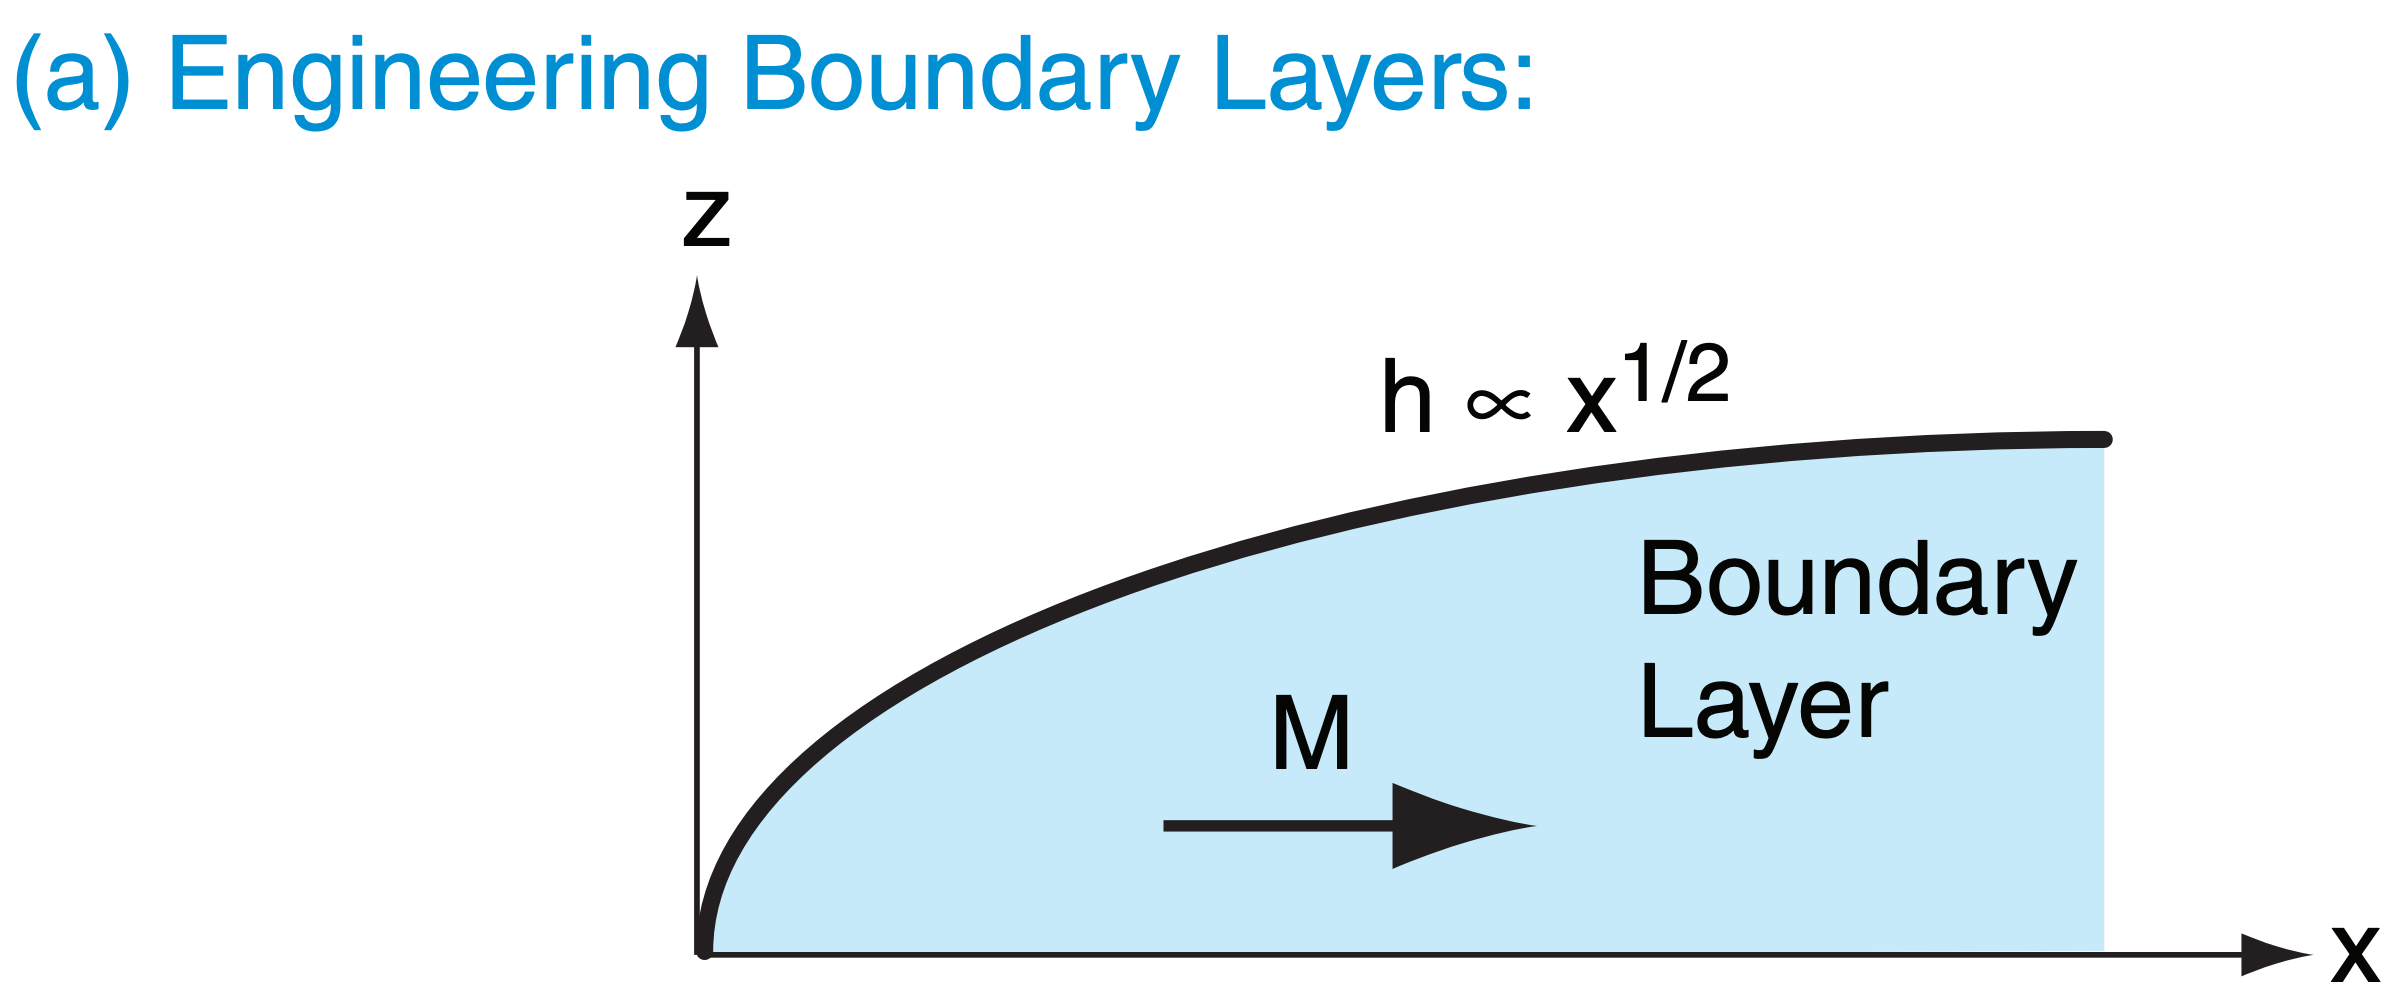
In wind tunnel experiments, the layer of air that turbulently “feels” frictional drag against the bottom wall grows in depth indefinitely (Fig. 18.a). This engineering boundary-layer thickness h grows proportional to the square root of downstream distance x, until hitting the top of the wind tunnel.
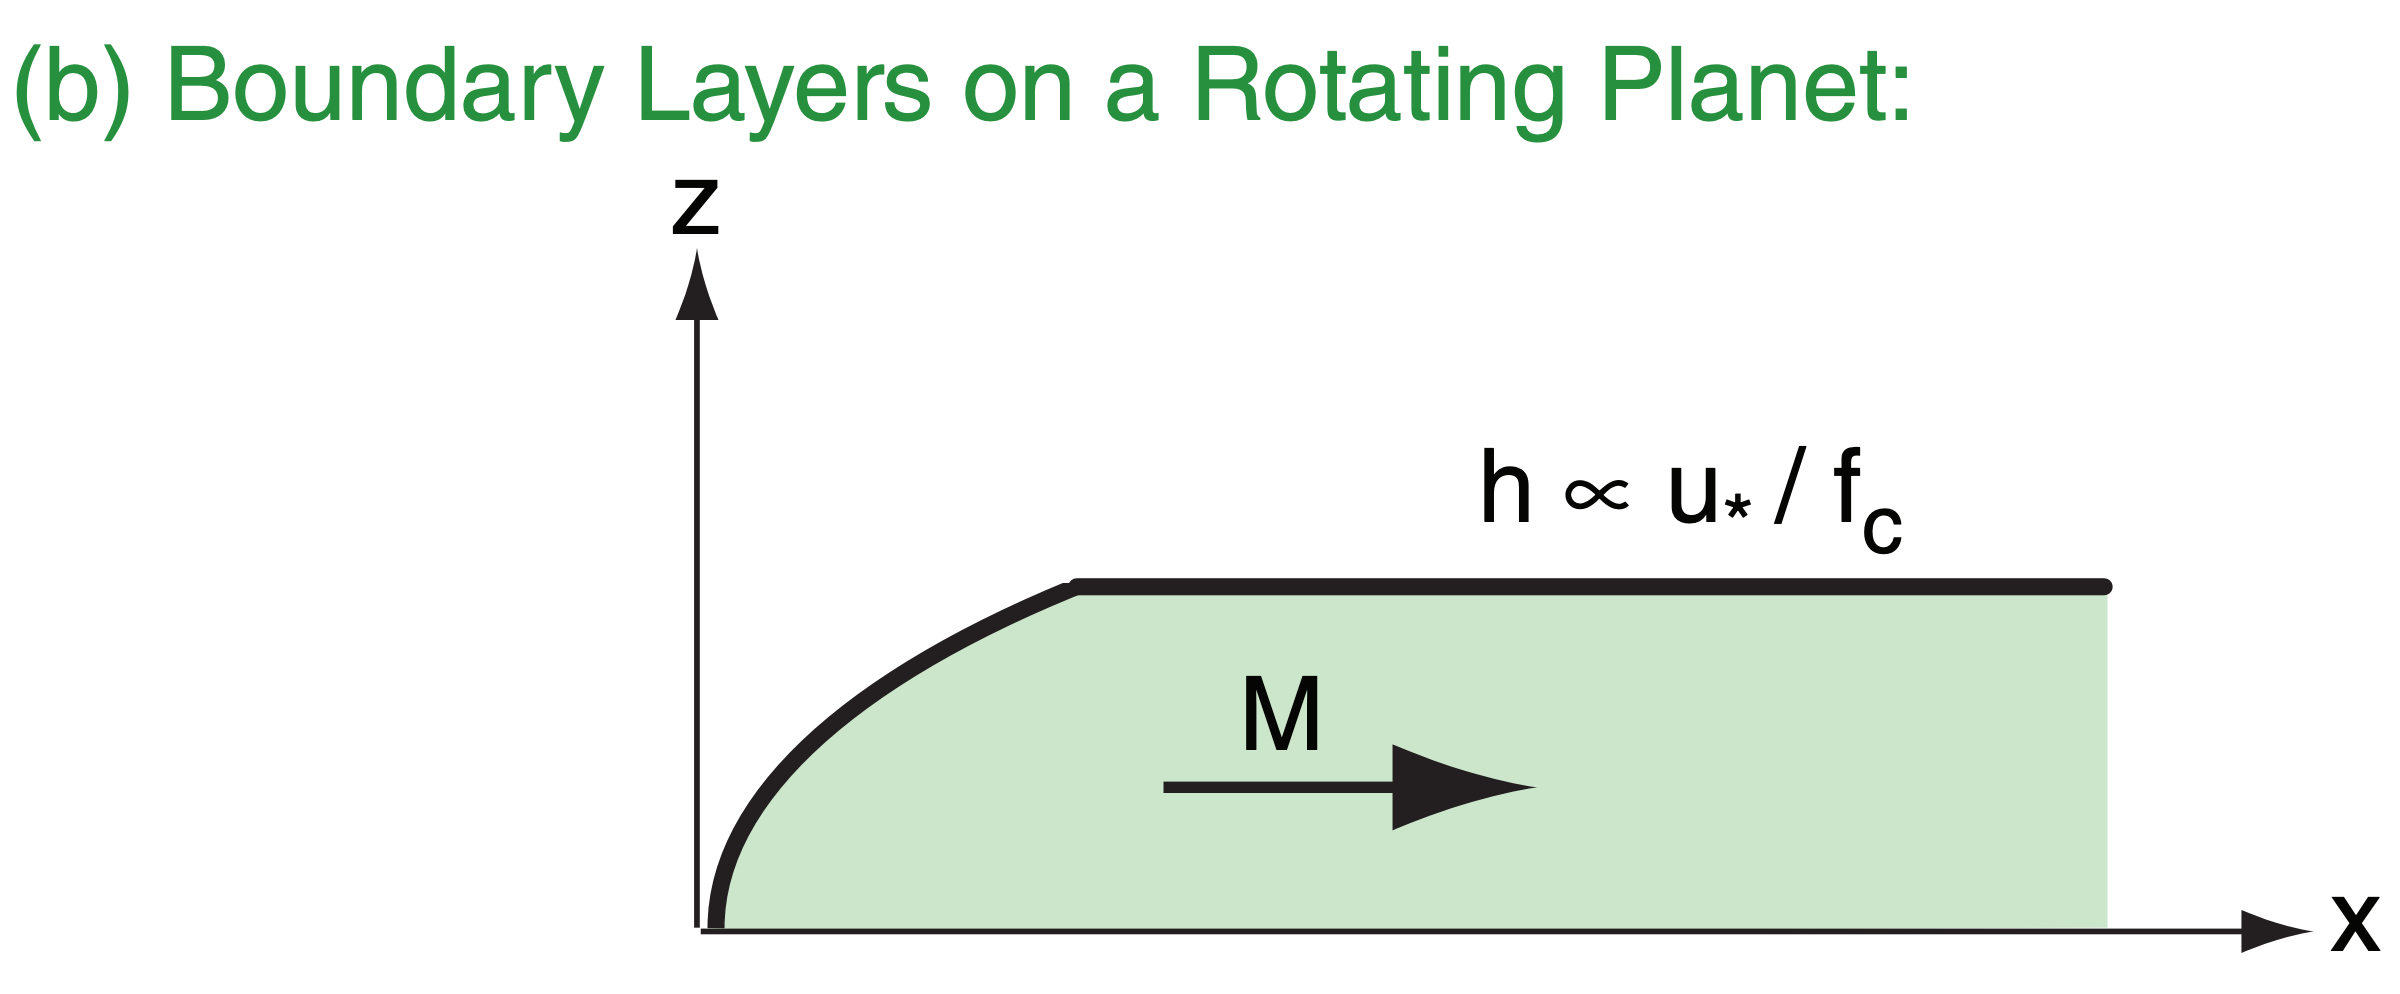
On an idealized rotating planet, the Earth’s rotation imposes a dynamical constraint on ABL depth (Fig. 18.b). This maximum depth is proportional to the ratio of wind drag (related to the friction velocity u* , which is a concept discussed later in this chapter) to Earth’s rotation (related to the Coriolis parameter fc, as discussed in the Atmos. Forces & Winds chapter). This dynamic constraint supersedes the turbulence constraint.
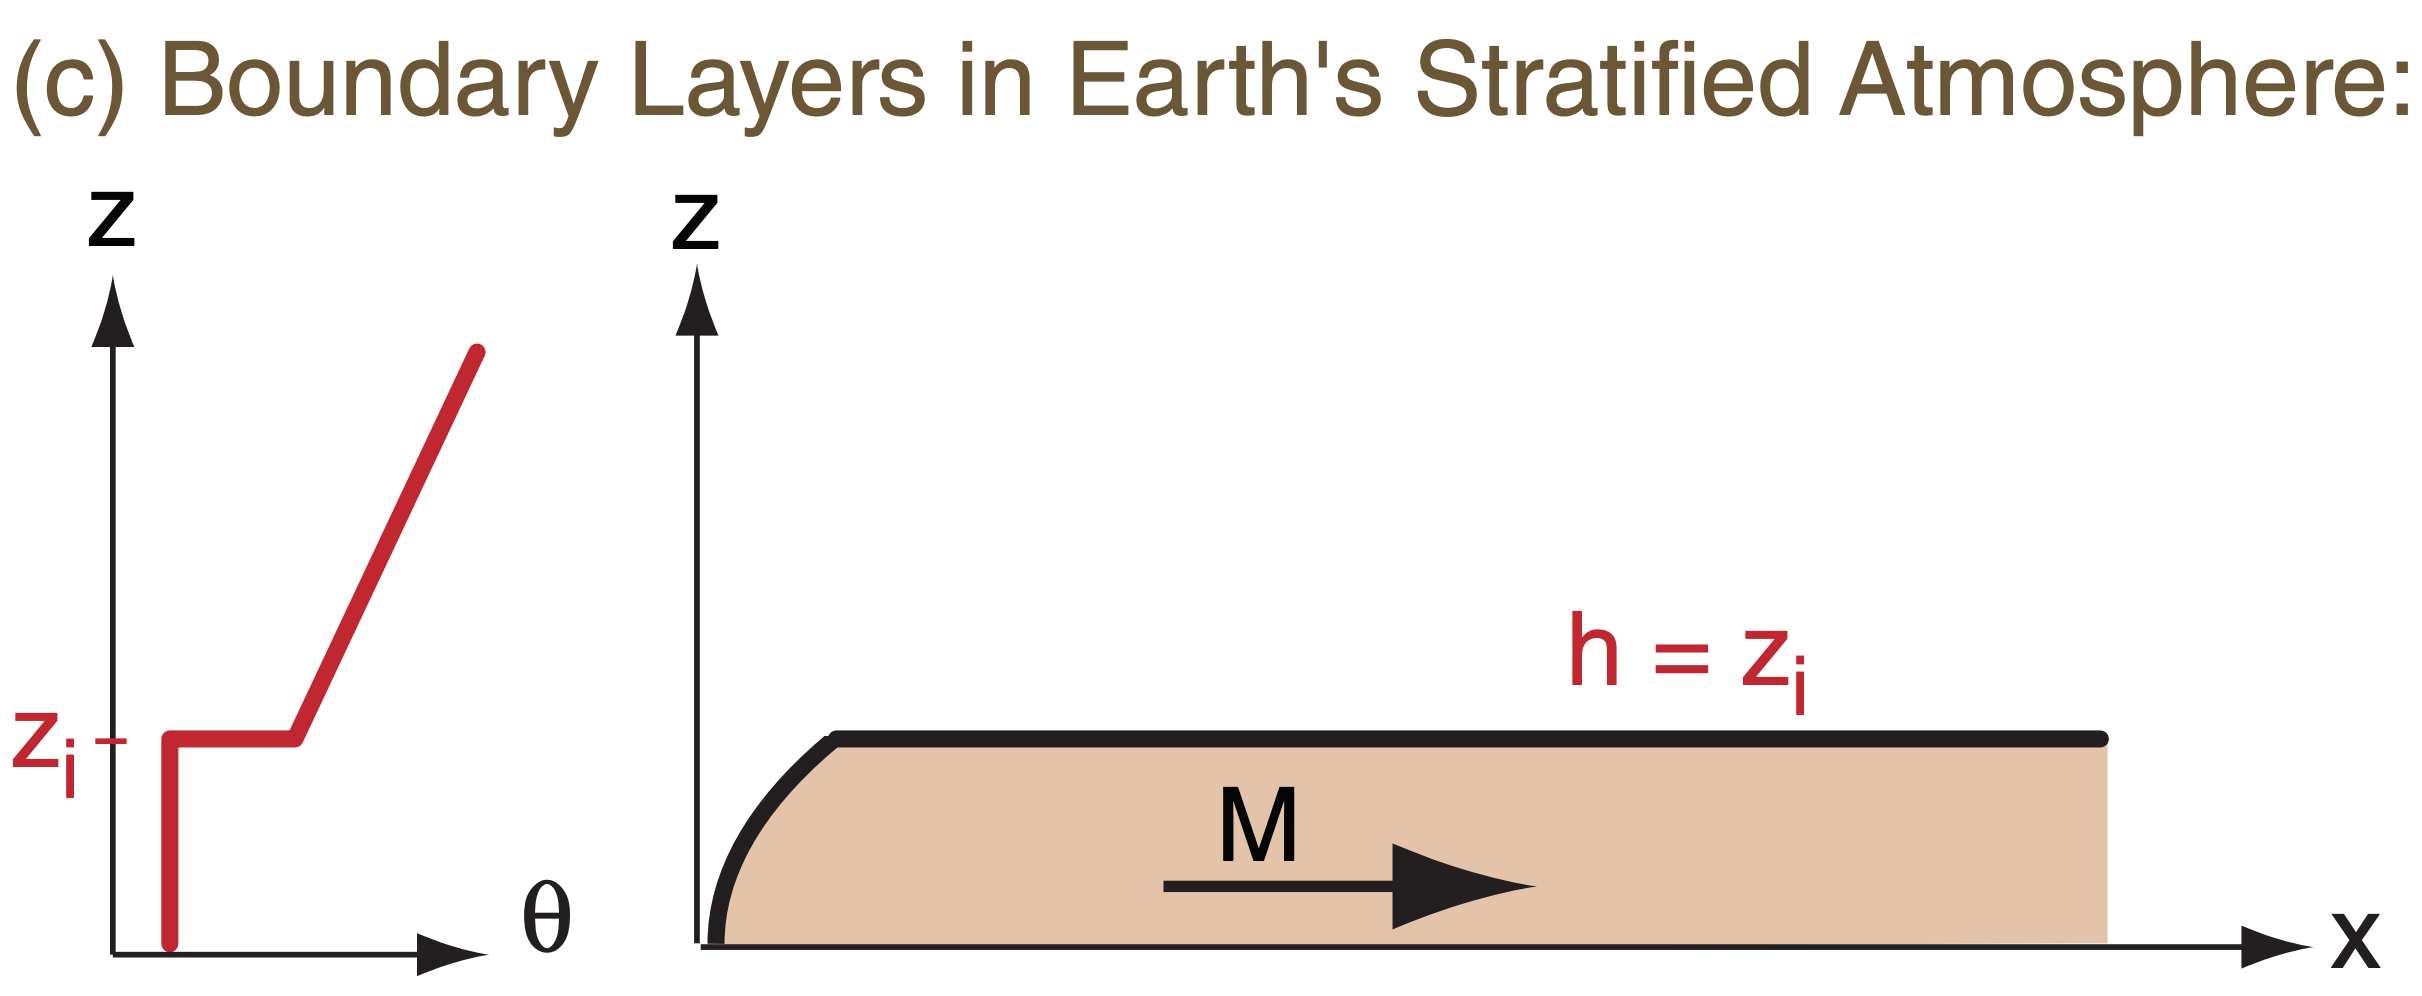
For the real ABL on Earth, the strong capping inversion at height zi makes the ABL unique (Fig. 18.c) compared to other fluid flows. It constrains the ABL thickness and the eddies within it to a maximum size of order 200 m to 4 km. This stratification (thermodynamic) constraint supersedes the others. It means that the temperature structure is always very important for the ABL.
Above the mixed layer, the air is usually unmodified by turbulence, and retains the same temperature profile as the standard atmosphere in this idealized scenario. This tropospheric air above the ABL is known as the free atmosphere (FA).
As a result of a turbulent mixed layer being adjacent to the unmixed free atmosphere, there is a sharp temperature increase at the mixed layer top. This transition zone is very stable, and is often a temperature inversion. Namely, it is a region where temperature increases with height. The altitude of the middle of this inversion is given the symbol zi , and is a measure of the depth of the turbulent ABL.
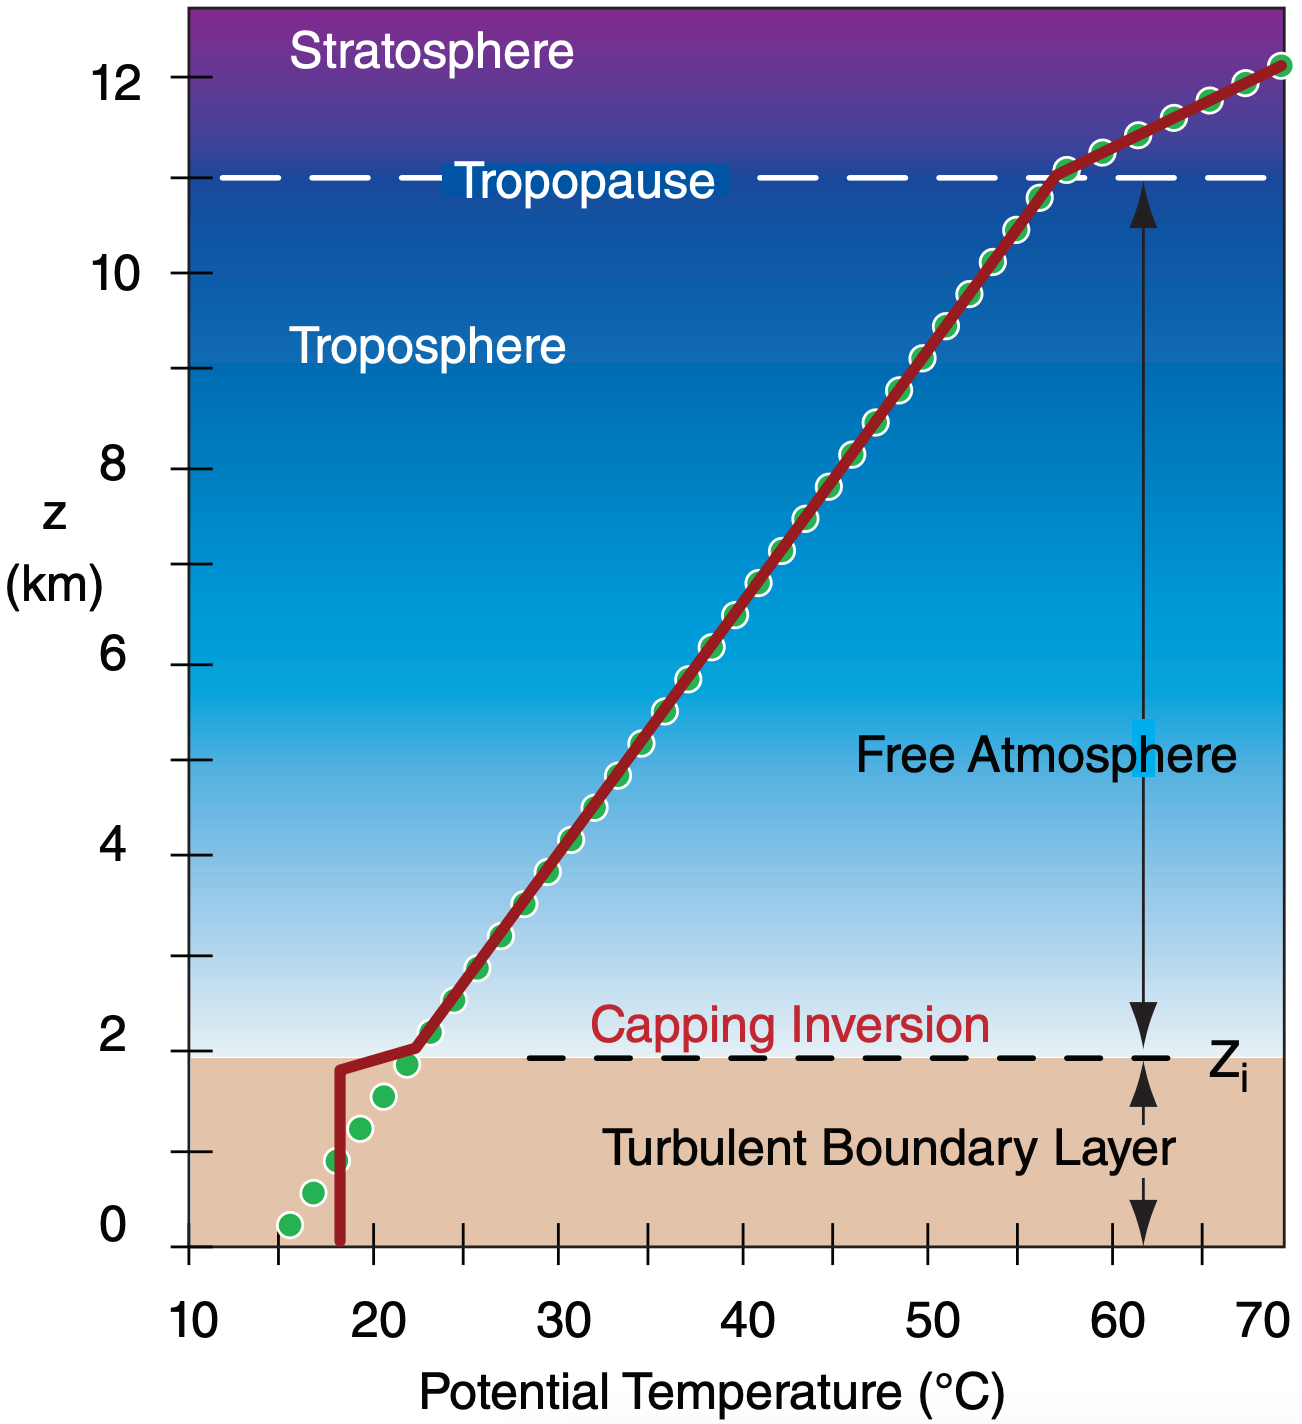
The temperature inversion acts like a lid or cap to motions in the ABL. Picture an air parcel from the mixed layer in Fig. 18.3. If turbulence were to try to push it out of the top of the mixed layer into the free atmosphere, it would be so much colder than the surrounding environment that a strong buoyant force would push it back down into the mixed layer. Hence, air parcels, turbulence, and any air pollution in the parcels, are trapped within the mixed layer.
During fair weather, there is always a strong stable layer or temperature inversion capping the ABL. As we have seen, turbulent mixing in the bottom of the statically-stable troposphere creates this cap, and in turn this cap traps turbulence below it.
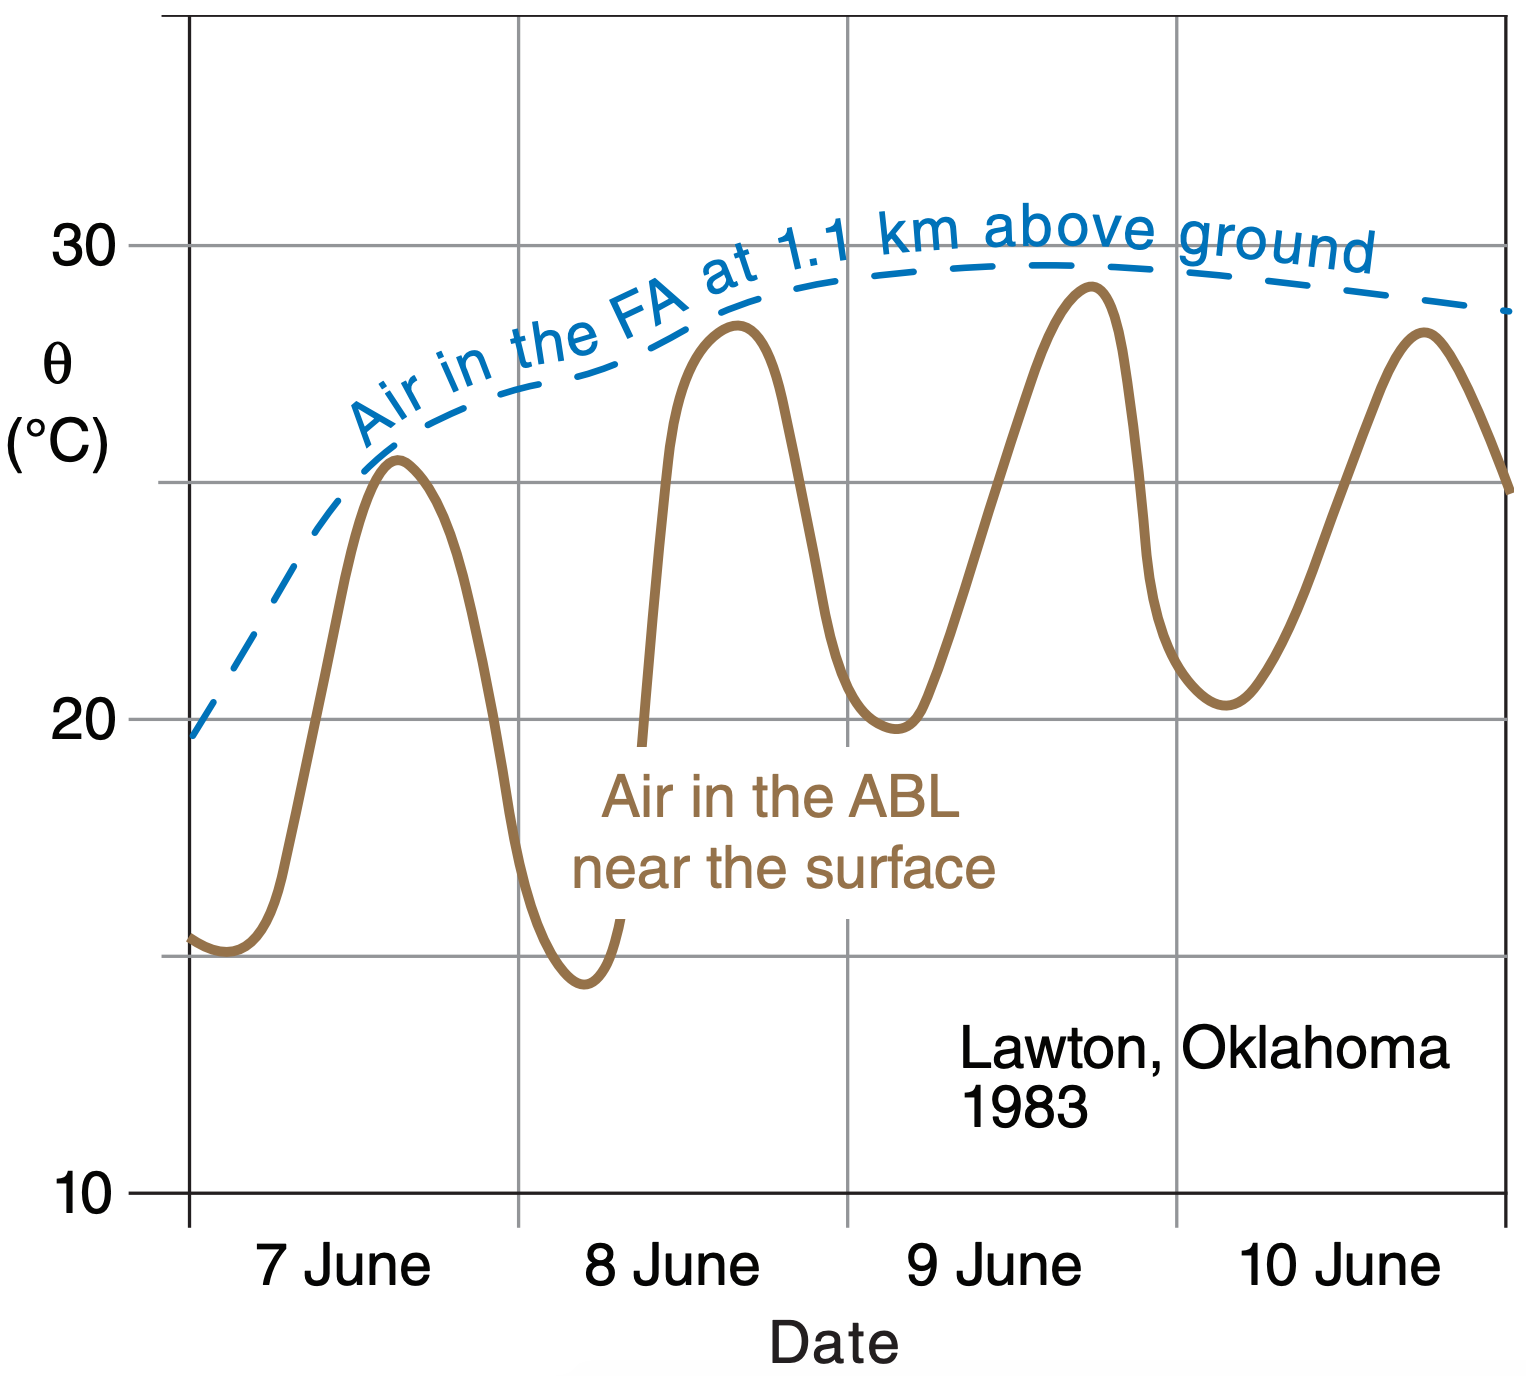
The capping inversion breaks the troposphere into two parts. Vigorous turbulence within the ABL causes the ABL to respond quickly to surface influences such as heating and frictional drag. However, the remainder of the troposphere does not experience this strong turbulent coupling with the surface, and hence does not experience frictional drag nor a daily heating cycle. Fig. 18.4 illustrates this.
In summary, the bottom 200 m to 4 km of the troposphere is called the atmospheric boundary layer. ABL depth is variable with location and time. Turbulent transport causes the ABL to feel the direct effects of the Earth’s surface. The ABL exhibits strong diurnal (daily) variations of temperature, moisture, winds, pollutants, turbulence, and depth in response to daytime solar heating and nighttime IR cooling of the ground. The name “boundary layer” comes from the fact that the Earth’s surface is a boundary on the atmosphere, and the ABL is the part of the atmosphere that “feels” this boundary during fair weather.
18.2.2. Synoptic Forcings
Weather patterns such as high (H) and low (L) pressure systems that are drawn on weather maps are known as synoptic weather. These large-diameter (≥ 2000 km) systems modulate the ABL. In the N. Hemisphere, ABL winds circulate clockwise and spiral out from high-pressure centers, but circulate counterclockwise and spiral in toward lows (Fig. 18.6). See the Dynamics chapter for details on winds.
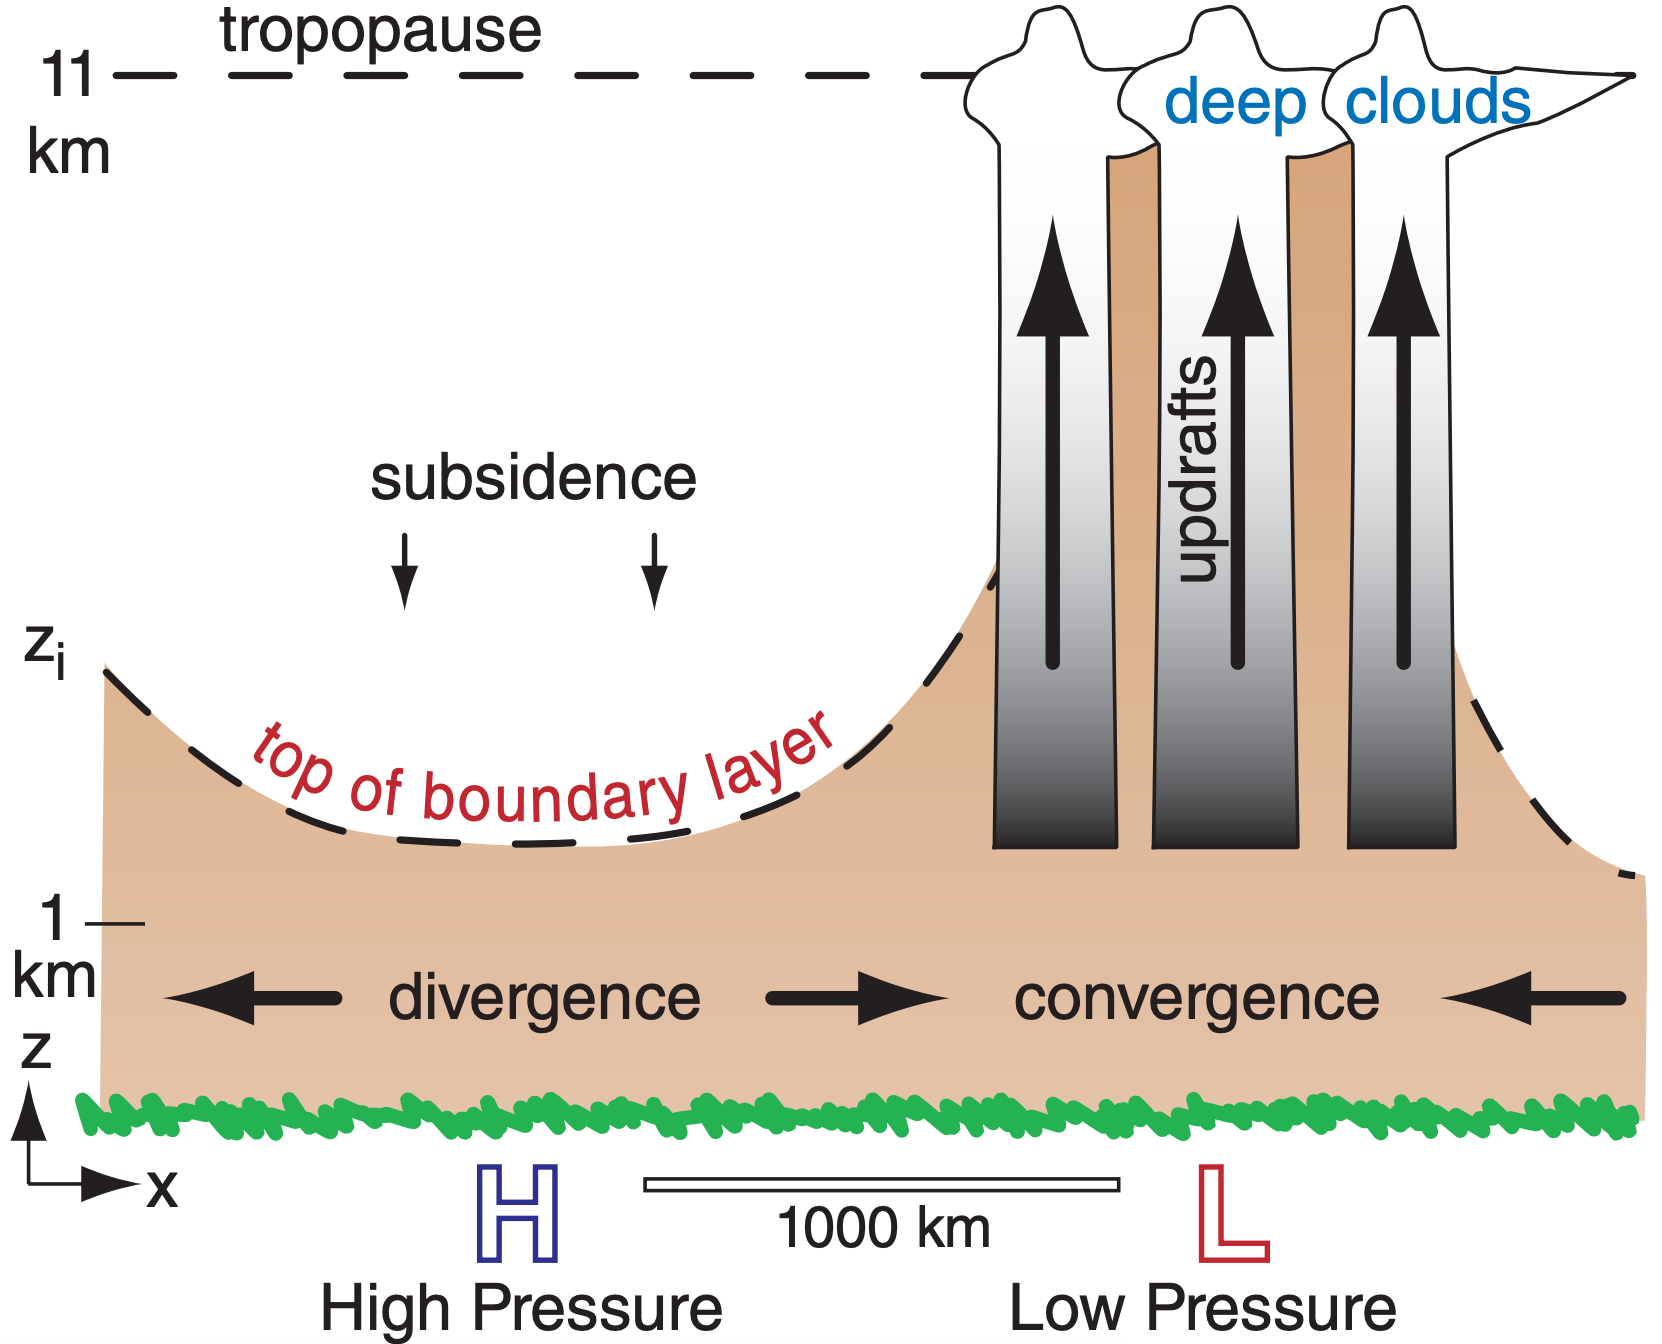
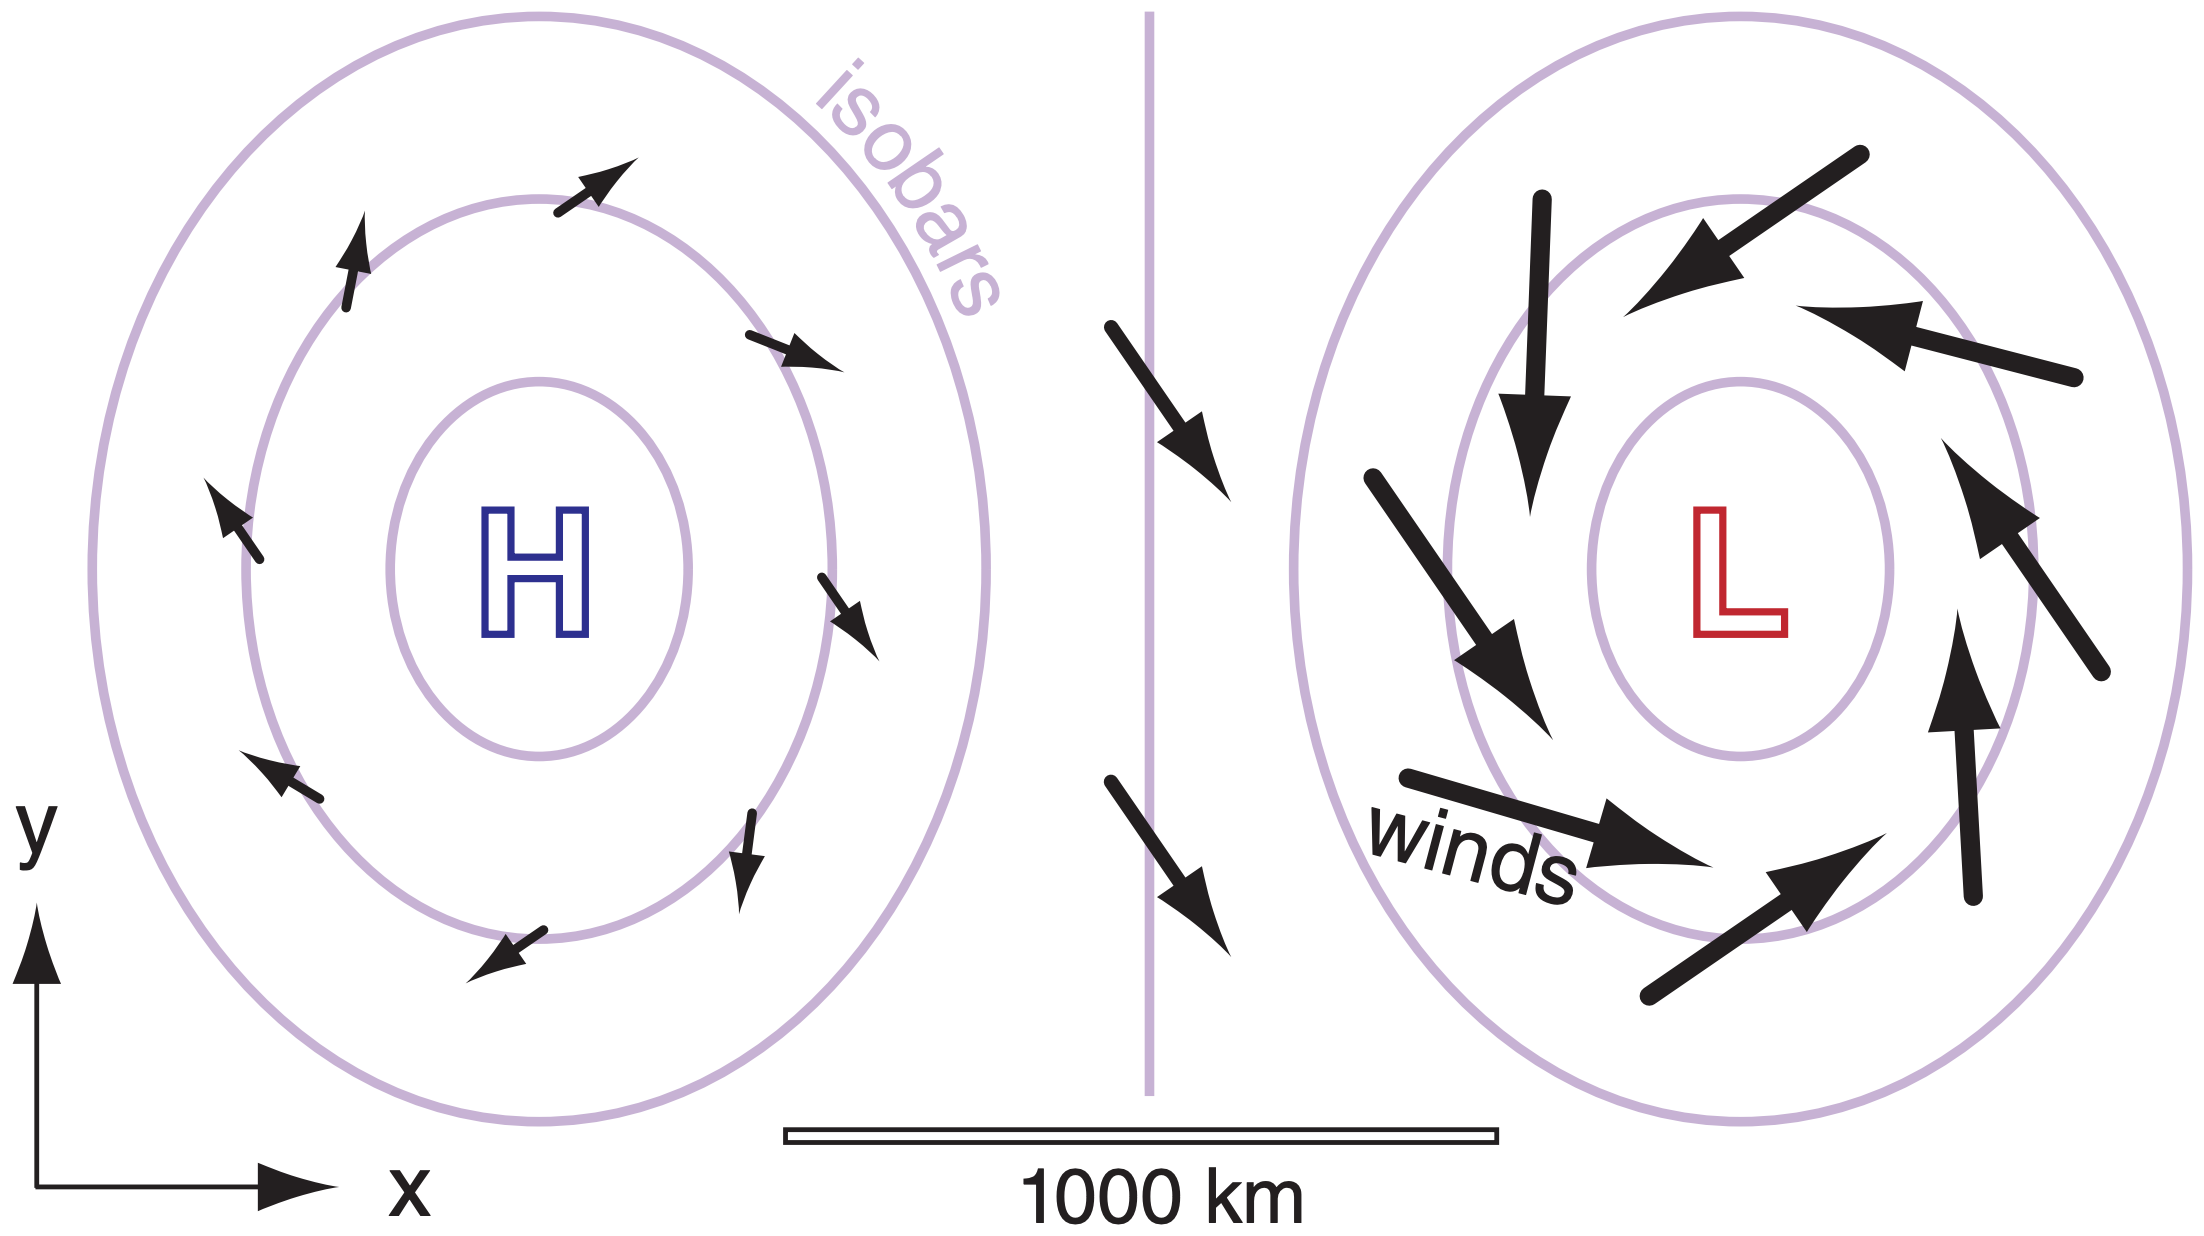
The outward spiral of winds around highs is called divergence, and removes ABL air horizontally from the center of highs. Conservation of air mass requires subsidence (downward moving air) over highs to replace the horizontally diverging air (Fig. 18.5). Although this subsidence pushes free atmosphere air downward, it cannot penetrate into the ABL because of the strong capping inversion. Instead, the capping inversion is pushed downward closer to the ground as the ABL becomes thinner. This situation traps air pollutants in a shallow ABL, causing air stagnation and air-pollution episodes.
Conversely, horizontally converging ABL air around lows is associated with upward motion (Fig. 18.5). Often the synoptic forcings and storms associated with lows are so powerful that they easily lift the capping inversion or eliminate it altogether. This allows ABL air to be deeply mixed over the whole depth of the troposphere by thunderstorms and other clouds. Air pollution is usually reduced during this situation as it is diluted with cleaner air from aloft or is washed out by rain.
Because winds in high-pressure regions are relatively light, ABL air lingers over the surface for sufficient time to take on characteristics of that surface. These characteristics include temperature, humidity, pollution, odor, and others. Such ABL air is called an airmass, as discussed in the chapter on Airmasses and Fronts. When two different ABL airmasses leave their genesis regions and are drawn toward each other by a low center, the zone separating those two airmasses is called a front.
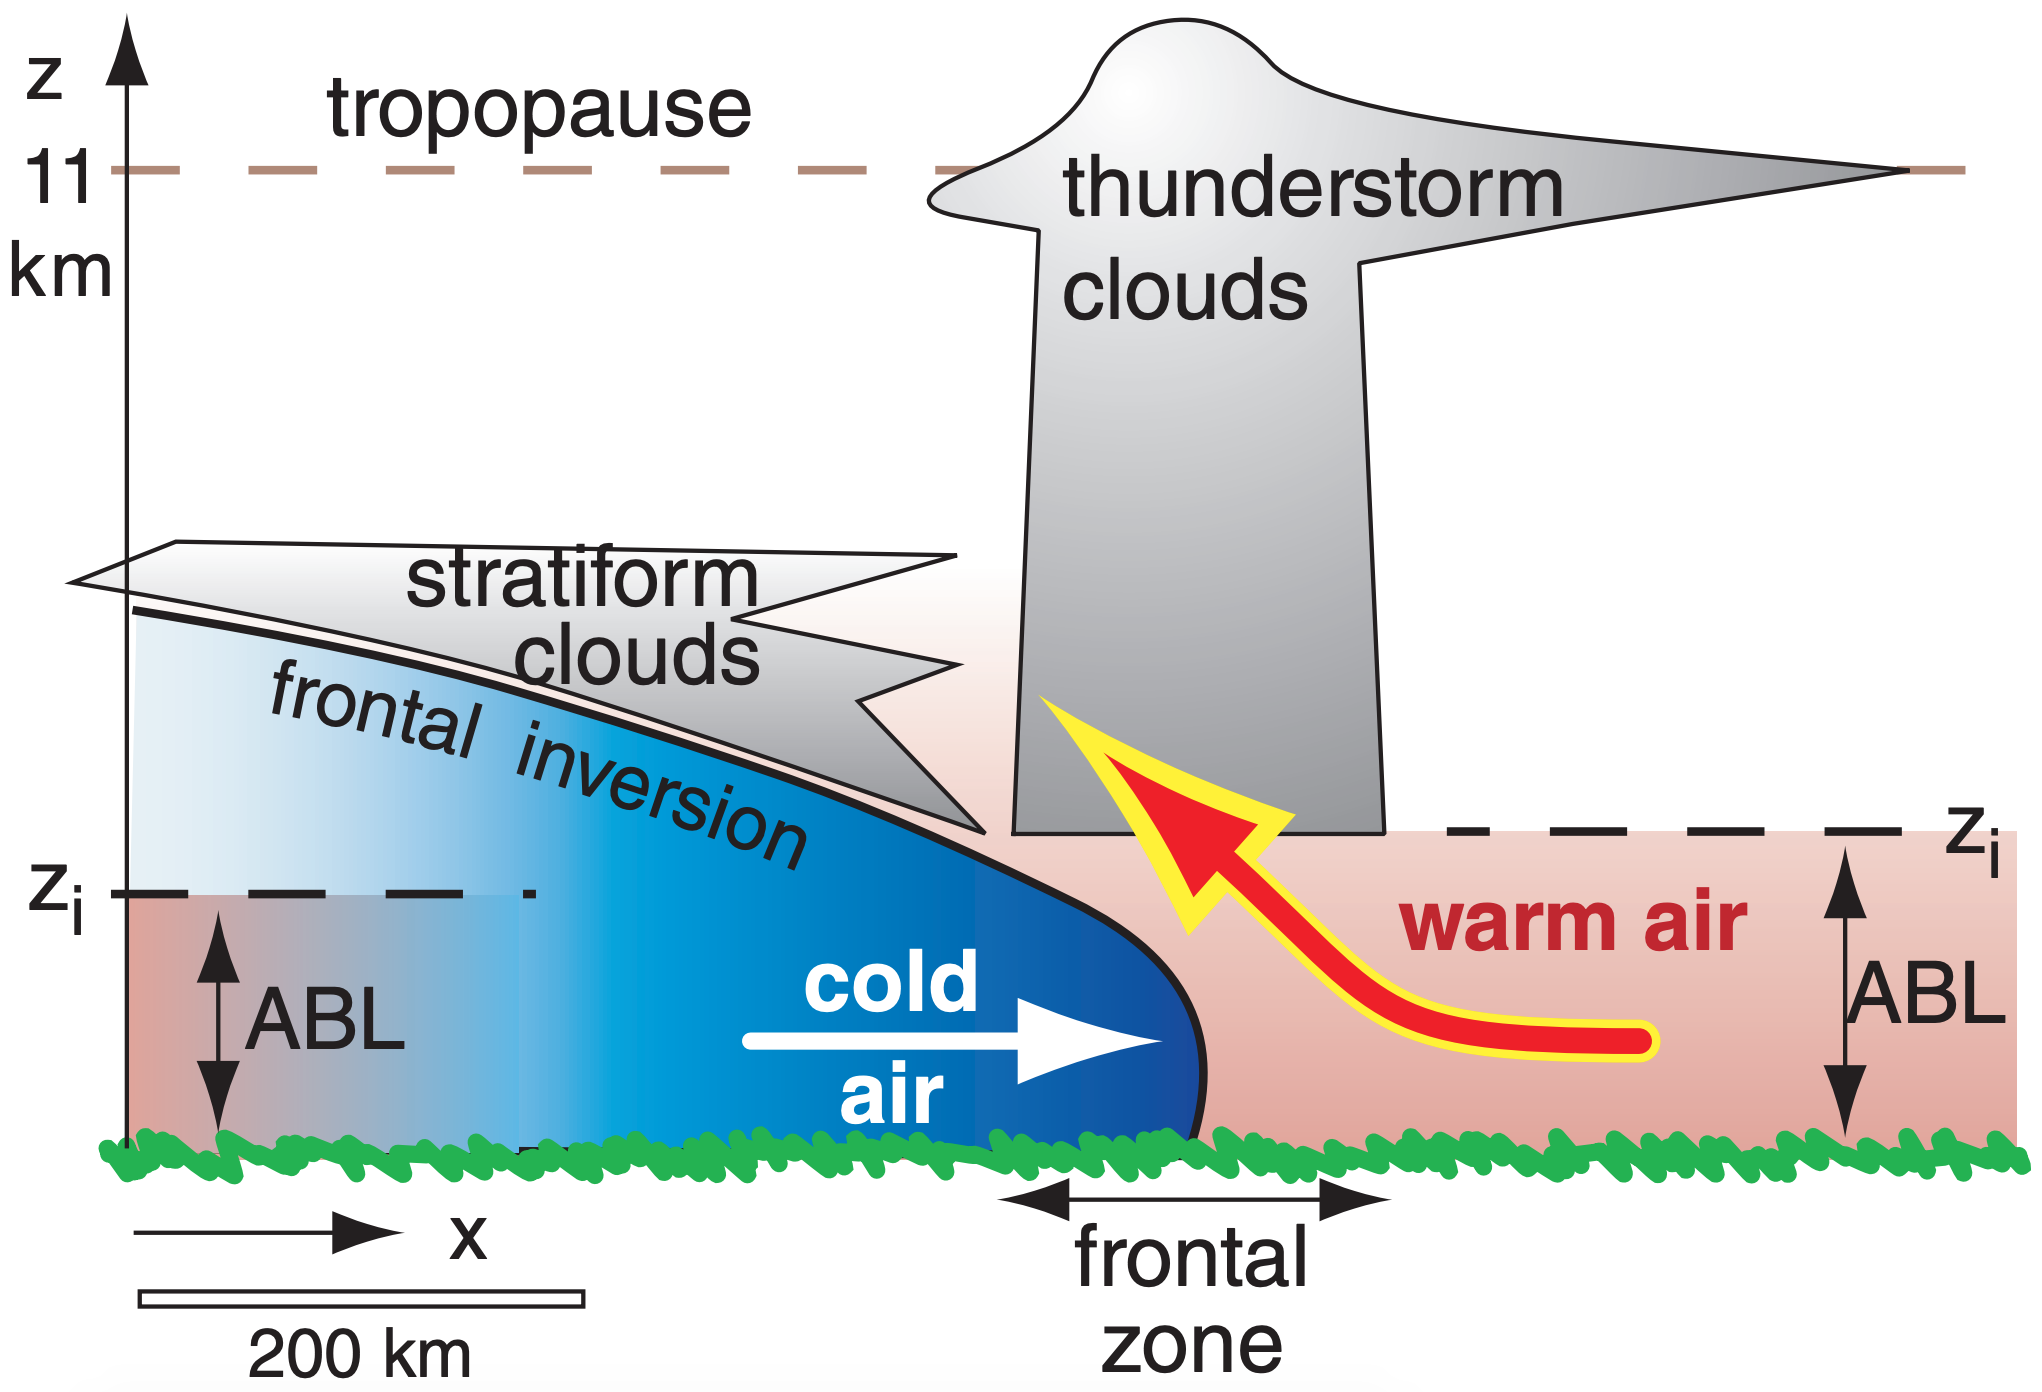
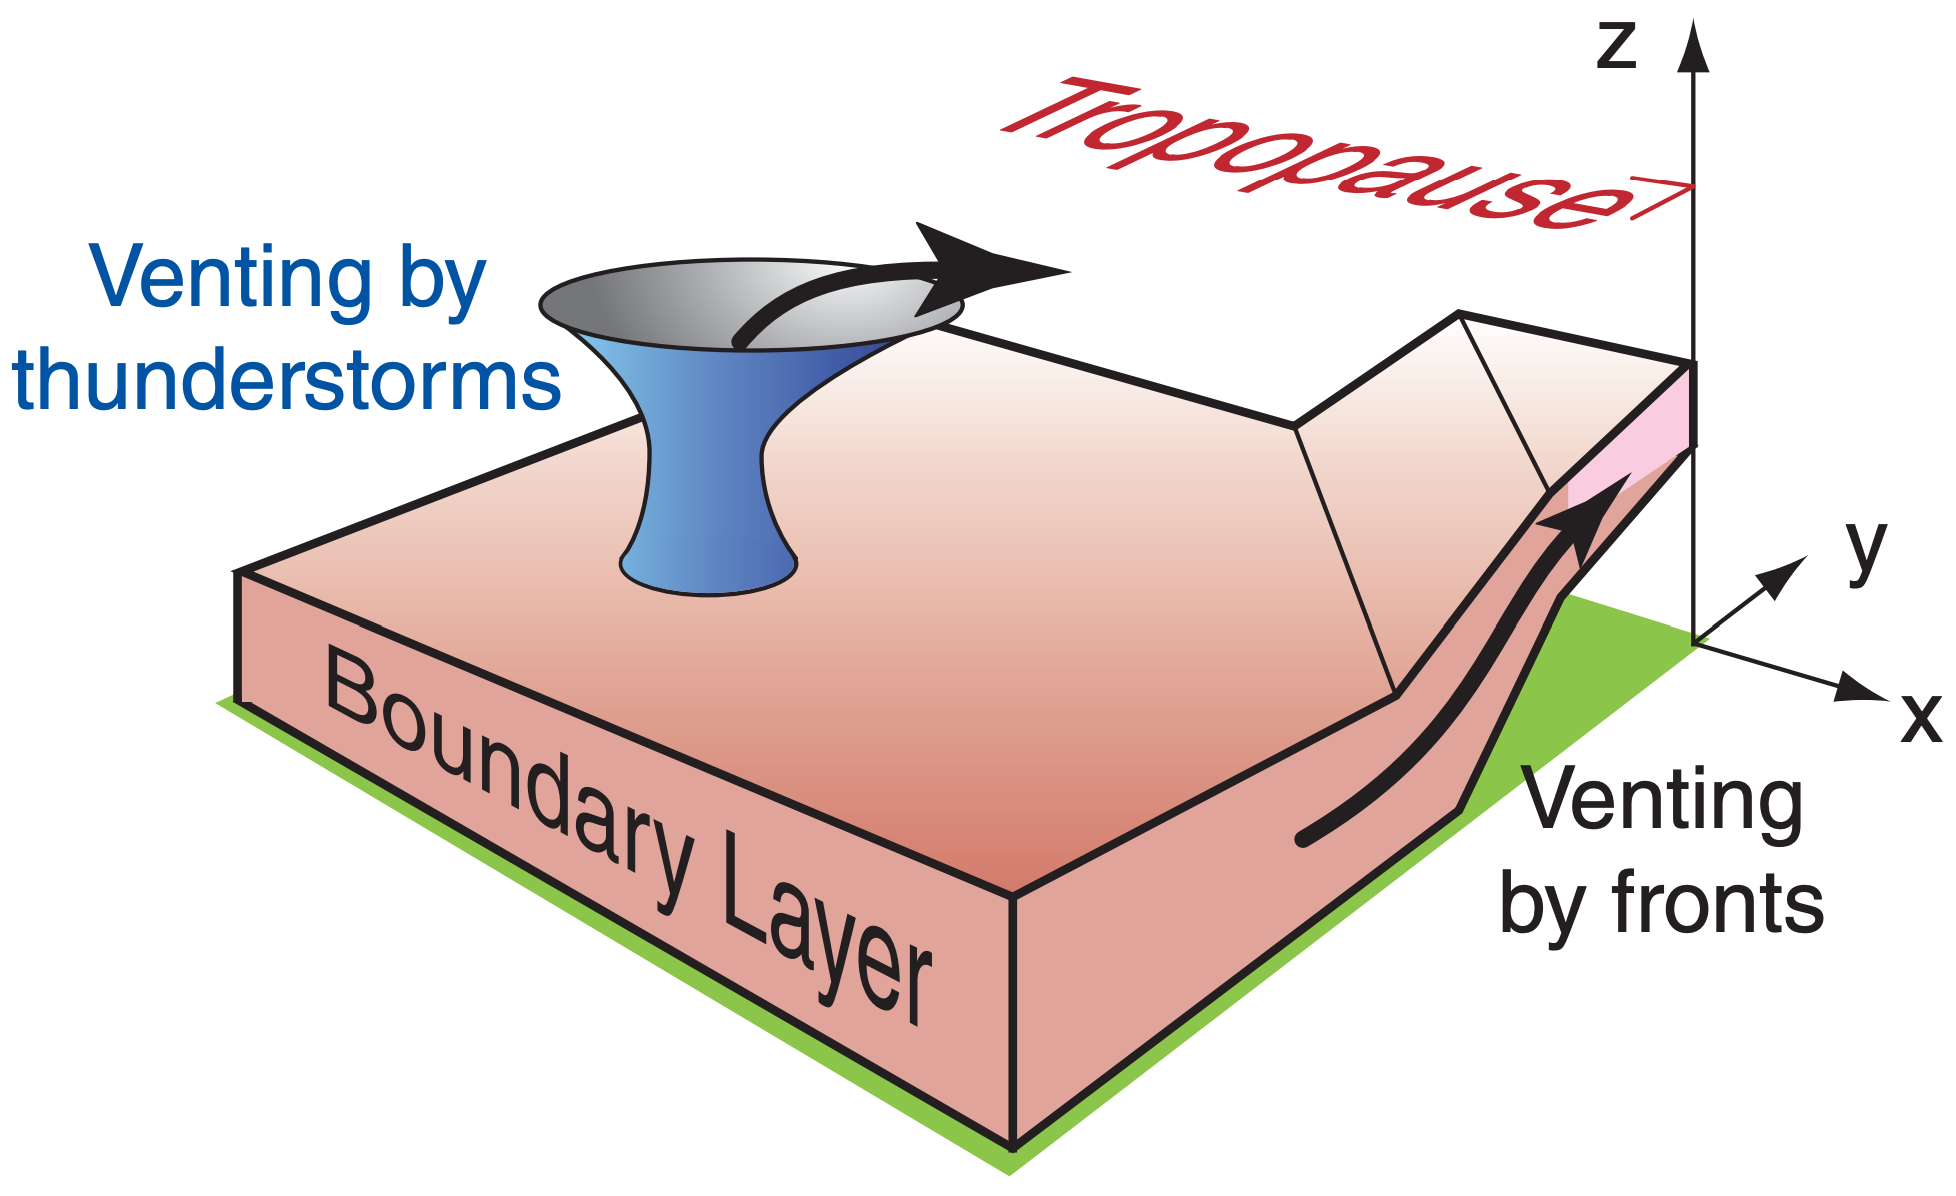
At a frontal zone, the colder, heavier airmass acts like a wedge under the warm airmass. As winds blow the cold and warm air masses toward each other, the cold wedge causes the warm ABL to peel away from the ground, causing it to ride up over the colder air (Figs. 18.7a & b). Also, thunderstorms can vent ABL air away from the ground (Figs. 18.7a & b). It is mainly in these stormy conditions (statically stable conditions at fronts, and statically unstable conditions at thunderstorms) that ABL air is forced away from the surface.
Although an ABL forms in the advancing airmass behind the front, the warm humid air that was pushed aloft is not called an ABL because it has lost contact with the surface. Instead, this rising warm air cools, allowing water vapor to condense and make the clouds that we often associate with fronts.
For synoptic-scale low-pressure systems, it is difficult to define a separate ABL, so boundary-layer meteorologists study the air below cloud base. The remainder of this chapter focuses on fair-weather ABLs associated with high-pressure systems.


