
12: A Warmer World- Temperature Effects On Proteins
- Page ID
- 34467
\( \newcommand{\vecs}[1]{\overset { \scriptstyle \rightharpoonup} {\mathbf{#1}} } \)
\( \newcommand{\vecd}[1]{\overset{-\!-\!\rightharpoonup}{\vphantom{a}\smash {#1}}} \)
\( \newcommand{\dsum}{\displaystyle\sum\limits} \)
\( \newcommand{\dint}{\displaystyle\int\limits} \)
\( \newcommand{\dlim}{\displaystyle\lim\limits} \)
\( \newcommand{\id}{\mathrm{id}}\) \( \newcommand{\Span}{\mathrm{span}}\)
( \newcommand{\kernel}{\mathrm{null}\,}\) \( \newcommand{\range}{\mathrm{range}\,}\)
\( \newcommand{\RealPart}{\mathrm{Re}}\) \( \newcommand{\ImaginaryPart}{\mathrm{Im}}\)
\( \newcommand{\Argument}{\mathrm{Arg}}\) \( \newcommand{\norm}[1]{\| #1 \|}\)
\( \newcommand{\inner}[2]{\langle #1, #2 \rangle}\)
\( \newcommand{\Span}{\mathrm{span}}\)
\( \newcommand{\id}{\mathrm{id}}\)
\( \newcommand{\Span}{\mathrm{span}}\)
\( \newcommand{\kernel}{\mathrm{null}\,}\)
\( \newcommand{\range}{\mathrm{range}\,}\)
\( \newcommand{\RealPart}{\mathrm{Re}}\)
\( \newcommand{\ImaginaryPart}{\mathrm{Im}}\)
\( \newcommand{\Argument}{\mathrm{Arg}}\)
\( \newcommand{\norm}[1]{\| #1 \|}\)
\( \newcommand{\inner}[2]{\langle #1, #2 \rangle}\)
\( \newcommand{\Span}{\mathrm{span}}\) \( \newcommand{\AA}{\unicode[.8,0]{x212B}}\)
\( \newcommand{\vectorA}[1]{\vec{#1}} % arrow\)
\( \newcommand{\vectorAt}[1]{\vec{\text{#1}}} % arrow\)
\( \newcommand{\vectorB}[1]{\overset { \scriptstyle \rightharpoonup} {\mathbf{#1}} } \)
\( \newcommand{\vectorC}[1]{\textbf{#1}} \)
\( \newcommand{\vectorD}[1]{\overrightarrow{#1}} \)
\( \newcommand{\vectorDt}[1]{\overrightarrow{\text{#1}}} \)
\( \newcommand{\vectE}[1]{\overset{-\!-\!\rightharpoonup}{\vphantom{a}\smash{\mathbf {#1}}}} \)
\( \newcommand{\vecs}[1]{\overset { \scriptstyle \rightharpoonup} {\mathbf{#1}} } \)
\(\newcommand{\longvect}{\overrightarrow}\)
\( \newcommand{\vecd}[1]{\overset{-\!-\!\rightharpoonup}{\vphantom{a}\smash {#1}}} \)
\(\newcommand{\avec}{\mathbf a}\) \(\newcommand{\bvec}{\mathbf b}\) \(\newcommand{\cvec}{\mathbf c}\) \(\newcommand{\dvec}{\mathbf d}\) \(\newcommand{\dtil}{\widetilde{\mathbf d}}\) \(\newcommand{\evec}{\mathbf e}\) \(\newcommand{\fvec}{\mathbf f}\) \(\newcommand{\nvec}{\mathbf n}\) \(\newcommand{\pvec}{\mathbf p}\) \(\newcommand{\qvec}{\mathbf q}\) \(\newcommand{\svec}{\mathbf s}\) \(\newcommand{\tvec}{\mathbf t}\) \(\newcommand{\uvec}{\mathbf u}\) \(\newcommand{\vvec}{\mathbf v}\) \(\newcommand{\wvec}{\mathbf w}\) \(\newcommand{\xvec}{\mathbf x}\) \(\newcommand{\yvec}{\mathbf y}\) \(\newcommand{\zvec}{\mathbf z}\) \(\newcommand{\rvec}{\mathbf r}\) \(\newcommand{\mvec}{\mathbf m}\) \(\newcommand{\zerovec}{\mathbf 0}\) \(\newcommand{\onevec}{\mathbf 1}\) \(\newcommand{\real}{\mathbb R}\) \(\newcommand{\twovec}[2]{\left[\begin{array}{r}#1 \\ #2 \end{array}\right]}\) \(\newcommand{\ctwovec}[2]{\left[\begin{array}{c}#1 \\ #2 \end{array}\right]}\) \(\newcommand{\threevec}[3]{\left[\begin{array}{r}#1 \\ #2 \\ #3 \end{array}\right]}\) \(\newcommand{\cthreevec}[3]{\left[\begin{array}{c}#1 \\ #2 \\ #3 \end{array}\right]}\) \(\newcommand{\fourvec}[4]{\left[\begin{array}{r}#1 \\ #2 \\ #3 \\ #4 \end{array}\right]}\) \(\newcommand{\cfourvec}[4]{\left[\begin{array}{c}#1 \\ #2 \\ #3 \\ #4 \end{array}\right]}\) \(\newcommand{\fivevec}[5]{\left[\begin{array}{r}#1 \\ #2 \\ #3 \\ #4 \\ #5 \\ \end{array}\right]}\) \(\newcommand{\cfivevec}[5]{\left[\begin{array}{c}#1 \\ #2 \\ #3 \\ #4 \\ #5 \\ \end{array}\right]}\) \(\newcommand{\mattwo}[4]{\left[\begin{array}{rr}#1 \amp #2 \\ #3 \amp #4 \\ \end{array}\right]}\) \(\newcommand{\laspan}[1]{\text{Span}\{#1\}}\) \(\newcommand{\bcal}{\cal B}\) \(\newcommand{\ccal}{\cal C}\) \(\newcommand{\scal}{\cal S}\) \(\newcommand{\wcal}{\cal W}\) \(\newcommand{\ecal}{\cal E}\) \(\newcommand{\coords}[2]{\left\{#1\right\}_{#2}}\) \(\newcommand{\gray}[1]{\color{gray}{#1}}\) \(\newcommand{\lgray}[1]{\color{lightgray}{#1}}\) \(\newcommand{\rank}{\operatorname{rank}}\) \(\newcommand{\row}{\text{Row}}\) \(\newcommand{\col}{\text{Col}}\) \(\renewcommand{\row}{\text{Row}}\) \(\newcommand{\nul}{\text{Nul}}\) \(\newcommand{\var}{\text{Var}}\) \(\newcommand{\corr}{\text{corr}}\) \(\newcommand{\len}[1]{\left|#1\right|}\) \(\newcommand{\bbar}{\overline{\bvec}}\) \(\newcommand{\bhat}{\widehat{\bvec}}\) \(\newcommand{\bperp}{\bvec^\perp}\) \(\newcommand{\xhat}{\widehat{\xvec}}\) \(\newcommand{\vhat}{\widehat{\vvec}}\) \(\newcommand{\uhat}{\widehat{\uvec}}\) \(\newcommand{\what}{\widehat{\wvec}}\) \(\newcommand{\Sighat}{\widehat{\Sigma}}\) \(\newcommand{\lt}{<}\) \(\newcommand{\gt}{>}\) \(\newcommand{\amp}{&}\) \(\definecolor{fillinmathshade}{gray}{0.9}\)Search Fundamentals of Biochemistry
(Learning goals written by Claude, Anthropic)
By the end of this chapter, students should be able to:
Competing Temperature Effects and Soil Carbon
- Describe how increasing temperature produces competing effects on enzymes — rising kcat and kinact producing a bell-shaped VM curve, rising KM reflecting weaker substrate binding, and declining catalytic power (kcat/kinact) — and explain why organisms near the optimal gray zone are poised near VM but have low catalytic power.
- Explain why soil stores ~1,500 Gt of carbon (more than atmosphere and vegetation combined), how temperature-driven increases in microbial respiration release this stored CO₂, and why no-till farming and high-latitude SOC are particularly vulnerable to warming-driven positive feedback loops.
- Interpret Mount Kilimanjaro altitude-gradient data showing that at a single elevation (2,010 m), simultaneous increases in KM and VM with temperature cancel each other below Scrit (no net rate increase at low substrate concentrations), while intracellular glucose mineralization accelerates at all substrate concentrations — and explain why cold-adapted organisms at 3,020 m show lower Q₁₀KM and Q₁₀VM values and higher Scrit, indicating that thermal adaptation is driven more by the breadth of temperature fluctuation than by mean temperature.
Structural Mechanisms: Ketosteroid Isomerase
- Describe the KSI catalytic mechanism — Asp40 proton abstraction, oxyanion hole stabilization by Tyr16 and Asp/Ser103 — and compare mesoKSI (P. putida) and thermoKSI (M. hassiacum) in terms of activity at respective optimal temperatures and thermal stability (ΔΔG° ≈ +6.8 kcal/mol favoring thermoKSI).
- Explain the molecular basis of the D103S stability difference — why buried protonated Asp103 deprotonates upon unfolding (pKa drops from >9 to ~3.7) stabilizing the unfolded state, while Ser103 does not deprotonate on solvent exposure — and connect this to the global survey showing S103 frequency increases with optimal growth temperature across 1,140 KSI sequences.
- Interpret the computational analysis of 2,194 enzyme families showing that thermophiles preferentially harbor Ile-Ile contact pairs, Lys-Glu salt bridges (over Arg-Asp), and Leu/Val → Ile substitutions, and explain the structural rationale for each in terms of conformational flexibility and hydrophobic packing.
Genome-Scale Metabolic Modeling and Thermal Limits
- Describe the enzyme-and-temperature-constrained GEM (etcGEM) of yeast, identify the three temperature-dependent parameters incorporated (kcat, EN denaturation, NGAM), and interpret the model's prediction that below 29°C only kcat limits growth, from 29–35°C both kcat and NGAM limit growth, and above 35°C enzyme denaturation dominates — with squalene epoxidase (ERG1) as the key flux-controlling enzyme at superoptimal temperatures.
- Explain why yeast switches from respiration to fermentation above 37°C in terms of protein concentration limits and ATP yield per protein mass, and connect this metabolic shift to the broader principle that thermal adaptation has systemic consequences beyond individual enzyme kinetics.
- Apply the six questions of Hochachka and Somero to predict organismal vulnerability to climate warming, explain why lethal human temperatures can occur at 29°C at 85% humidity (sweating failure), describe the Antarctic fish synaptic failure case (death at 9°C from acetylcholinesterase dysfunction), and explain why directed evolution demonstrates that organisms can adapt to higher temperatures within limits but cannot transform into thermophilic species.
Inspiration for the chapter comes from Biochemical Adaptation by Hochachka and Somero.
Introduction
In the previous chapter section, we discussed the generalized effects of temperature on chemical/biochemical reactions. The rate of chemical reactions, including enzyme-catalyzed ones, typically increases 2-3-fold (Q10 values) with a 100 C increase in temperature over an organism's typical temperature range. Q10 values decrease at higher temperature pairs that differ by 10 0C. A protein enzyme destabilizes at too high a temperature, and Q10 values can fall below 1, a sign of potential trouble for an organism subjected to that higher temperature.
As we saw in Chapter 32.11 and will see here, two competing processes affect protein enzymes as temperatures increase. These are increased rates for the catalyzed reaction and increased conformational dynamics, which ultimately lead to denaturation at sufficiently high temperatures. Hence, evolution would presumably select for increased protein stability for organisms adapted to higher temperatures.
For cold-adapted organisms, catalytic rates are expected to decrease. Hence, evolution might lead to higher kcat values for cold-adapted organisms. However, we saw in Chapter 32.11 that the rate-limiting step in enzyme-catalyzed reactions often involves localized conformational changes, which are disfavored at lower temperatures. Hence, evolution would also select enzymes that could maintain flexibility at low temperatures. In Chapter 4.9, we discussed low-temperature protein denaturation. Proteins can be destabilized at low temperatures. In this section, we will study how enzymes can adapt to higher temperatures. We won't discuss how proteins adapt to cold since this topic is less relevant to human-caused climate change.
We will follow the approach used throughout this book - that structure mediates function. We will use a lot of enzyme kinetics since kinetic parameters can tell us much about how the bound substrate goes to a product at high substrate concentrations (kcat or VM) or low substrate concentrations (kcat/KM) at different temperatures and for different orthologs of enzymes from species that have adapted to grow at low (psychrophile), medium (mesophile) or high temperatures (thermophiles). We'll next look at the structure of enzymes and the features that allow them to adapt to their optimal growth temperature. Finally, we will look at entire pathways to discern clues as to how they adapt to increased temperatures.
An Overview - Soil Enzymes
Soil microbes play a key role in the carbon cycle by storing and releasing carbon. Soil temperatures influence the balance between CO2 uptake and release into the atmosphere.
The soil is a sink for carbon and stores about 1500 gigatons [Gt] = 1.5 Pt = 1500 Pg), more than the atmosphere and vegetation combined. SOC derives ultimately from photosynthetic organisms. When they die, their carbon is used by heterotrophs for energy and biosynthesis. Carbon can also be returned to the atmosphere by aerobic oxidation by microorganisms, but this requires O2, which diminishes rapidly with soil depth. Oxygen levels depend on soil porosity, relative amounts of sand and clay, and hydration. Tilling of soil increases O2 exposure and, hence, the oxidative respiration of SOC, thereby increasing atmospheric CO2. No-till farming, therefore, can reduce CO2 emissions into the atmosphere. Inorganic carbon from CO2 (HCO3−, and CO3-2) binds with cations in the soil (mineralization) or is released into the atmosphere as CO2.
Carbon input into the soil is mostly determined by photosynthesis, which correlates with root mass and decay, while export is determined by soil microbial respiration (bacteria, fungi, protists). Microorganisms are key in balancing carbon inputs and outputs in soil and are prime determinants of SOC.
SOC is high in northern latitudes since colder temperatures promote lower respiration rates and accumulation of SOC over time. SOC is low in the lush tropics (even given the high photosynthetic rates) because microbial respiration rates are higher at higher temperatures. Deforestation of the lush Amazon Rain Forest will leave soil-poor SOC with little to balance the CO2 released by the decomposition of what's left, as abundant soil microorganisms break it down.
About 21 Gt of the 1500 Gt of SOC consists of microbial mass (12 Gt fungi, 7 Gt bacteria, and 2 Gt from animals). Fungi, hence, are key players in soil metabolism. They are involved in the slow decomposition of organic matter and promote the growth of slow-growing organisms, such as trees. In contrast, bacteria are fast metabolizers abundant in grasslands. Northern soils have higher soil microbial mass than tropical soils, but are less active, allowing for greater SOC stores.
We often think of enzymes working in an aqueous environment in a test tube or a cell (which is very crowded with other molecules). Figure \(\PageIndex{1}\) below represents the microenvironment of soil enzymes involved in the decomposition of SOC, like cellulose.

Figure \(\PageIndex{1}\): Location of enzymes in soils and their importance for carbon and nutrient cycling. Fanin, N. et al. (2022). Soil enzymes in response to climate warming: Mechanisms and feedbacks. Functional Ecology, 36, 1378– 1395. https://doi.org/10.1111/1365-2435.14027. Permission from John Wiley and Sons and Copyright Clearance Center.
Figure \(\PageIndex{2}\) below gives a review and an overview of the effects of increasing temperature on soil enzymes.

Figure \(\PageIndex{2}\): Effects of temperature at the enzyme scale. Fanin, N. et al., ibid. Permission from John Wiley and Sons and Copyright Clearance Center.
Panel (a) shows the many steps involved in enzyme catalysis that can be affected by temperature changes. Step 1 shows the binding of substrates. The KM (units M) for the enzyme gives a "measure" of the strength of the interaction (but remember that KM = KD - the dissociation constant - only under rapid equilibrium conditions). Step 2 reflects kcat, the "net" rate constant for the conversion of bound substrate to product.
Panel (b) shows how key constants change with increasing temperature. The figure shows that kcat increases with temperature, consistent with the Arrhenius equation, and that the temperature coefficient, Q10, decreases (as discussed in Chapter 12.11). (Remember that Q10 is the factor by which the reaction rate, k or R, changes for each 10-degree K or C temperature increase). The enzyme's thermal inactivation rate, kinact, also increases with temperature, resulting in a bell-shaped VM curve. Km, a measure of the apparent substrate KD for the enzyme, increases, reflecting weaker binding. The catalytic power, Epower = kcat/kinact, also decreases with increasing temperature as the slope of kinact is generally greater than that of kcat. The values on the temperature axis would differ for microbes that grow best at cold temperatures (psychrophiles), moderate temperatures (mesophiles), and high temperatures (thermophiles).
The graphs above show the effects of temperature at the enzyme level. The gray rectangle represents optimal growing conditions, showing that enzymes are poised near VM for substrate conversion (assuming abundant substrate) but have low catalytic power. Increasing temperatures also affect the microbial community at the level of the individual. These can affect SOC. For example:
- After an increase in SOC decomposition at higher temperatures, subsequent decreases in SOC can occur due to the depletion of available substrates (as enzymes are running at VM) and changes in carbon use within microbial communities.
- Additional decreases in SOC occur due to increased oxidation and shifts in microbial community composition.
- The levels and types of substrates for enzymes likely change.
- Increased temperatures can lead to greater microbial community mass, which requires more substrate, but in the long term, metabolic shifts might decrease extracellular enzyme activity and microbial biomass.
- Soil conditions also change with increasing temperatures, affecting biomass by altering substrate availability.
- Increased temperature leads to short-term increases in CO2 emissions due to higher microorganism metabolic rates, explained by the Arrhenius equation. Still, additional effects arise from accompanying changes in the microbial community.
Complex mathematical modeling (as we saw with Vcell, including metabolic and signal transduction pathways) would be needed to understand the effects of warming on SOC stores and their return to the atmosphere as CO2.
Enzyme properties with altitude - Mount Kilimanjaro
The loss of SOC due to climate change may be mitigated to some extent as the soil microbial community thermally adapts to lower respiration rates and microbial biomass. As shown in Figure 1, both extracellular and intracellular enzymes must be considered. Extracellular enzymes break down polymers like cellulose into monomers, which are transported into the cell for intracellular respiration and the formation of CO2 by intracellular enzymes. The extracellular (lytic) and intracellular (oxidative) enzymes might respond differently to higher temperatures. Polymers that are hard to degrade have high activation energies, making soils with higher concentrations of these polymers more sensitive to climate warming (based on the Arrhenius equation).
Changes in the microbial community might include shifts in the fungal/bacterial ratio, which can affect degradation pathways and the rates of enzyme-catalyzed reactions. At higher temperatures, these changes increase conformational flexibility, which can increase kcat and decrease the enzyme's apparent affinity for the substrate, as reflected in higher KM values. These compensatory effects might leave catalysis unaffected as temperatures increase.
Studies have been conducted on individual degradative enzymes in soil samples from Mount Kilimanjaro. Enzyme kinetic analyses were performed at two different temperatures separated by 10 0C (10 0C and 20 0C), allowing Q10 values to be evaluated. The soil samples were collected at different elevations on the mountain to compare the kinetic parameters of enzymes from microbes adapted to those elevations. All organisms in soil from different heights would experience 10 °C, while those at the highest altitudes (3000 m) would encounter 20 0C only in the summer. The microbes presumably have slightly different optimal growth temperatures and would likely use different adaptive mechanisms at low and high altitudes. Keep in mind that when interpreting the results below, the Q10 value determines the sensitivity of a parameter (v0, KM, VM, etc.) to a 10 0C. increase in the temperature.
Extracellular enzyme activities in soil from one altitude
The activity of three extracellular enzymes in soil samples was studied: β-1,4-glucosidase (degrades cellulose), N-acetylglucosaminidase (degrades chitin from fungi and peptidoglycans from bacteria), and acid phosphatase. The first two enzymes catalyze "recalcitrant" reactions with higher activation energies. Michaelis-Menten plots for the three enzymes in soil samples taken at one height, 2010 meters (m), are shown in Figure \(\PageIndex{3}\) below. In addition, a plot of glucose conversion to CO2, an intracellular process, which the authors termed "glucose mineralization" (probably because they trapped CO2 using OH- to form HCO3-), is also shown.

Figure \(\PageIndex{3}\): Rates of reactions mediated by hydrolytic enzymes (a–c) and rates of glucose oxidation to CO2 (d) as dependent on substrate concentration at 10 and 20 °C for the site located at 2010 m a.s.l. Symbols – experimental data, lines – approximation by Michaelis–Menten kinetics. The red lines indicate assays performed at 200 C, while the green lines are for assays run at 100 C. Blagodatskaya, Е. et al. Temperature sensitivity and enzymatic mechanisms of soil organic matter decomposition along an altitudinal gradient on Mount Kilimanjaro. Sci Rep 6, 22240 (2016). https://doi.org/10.1038/srep22240. Creative Commons Attribution 4.0 International License. http://creativecommons.org/licenses/by/4.0/
The mineralization rate was determined using trace amounts of 14C-labeled glucose, which, if fully oxidized, is converted to 14CO2. Given the reaction conditions, the added glucose did not promote microbial proliferation. The authors used a fluorophore (4-methylumbelliferone or MUF)-labeled small substrate analogs for cellulose (MUF-β-D-glucopyranoside), chitin (MUF-N-acetyl-β-D-glucosaminide dehydrate), and acid phosphatase (4-MUF-phosphate). Reactions were carried out in soil samples, and valid initial reaction velocities were determined. The Km values for glucose oxidation (mineralization) are not valid KM values since CO2 would be produced from the combined actions of the enzymes in glycolysis, pyruvate dehydrogenase, and the citric acid cycle. It could be better called an "operational KM".
For the three enzymes, the KM at 20 °C was 25–42% higher than the VM = kcatET at 20 °C, resulting in Q10KM > Q10VM. These compensatory changes canceled any increases in enzyme activity at low substrate concentrations but not at high ones when the enzyme was saturated. Hence, Q10 for the catabolic depolymerization reactions increased with substrate concentration. Note, however, that the rate of intracellular glucose oxidation (mineralization) increased at all substrate concentrations going from 10 to 20 °C, and the canceling effect was not detected, even at low substrate levels. The temperature response of monomer oxidation showed a strongly accelerated reaction rate instead of a canceling effect.
Extracellular Enzyme activities in soils from different altitudes
Next, kinetic analyses were performed on soil samples from 2010 m (warm-adapted microorganisms) and 3020 m (cold-adapted) on the mountain. Plots of Q10 (not v0 as in Michaelis-Menten plots) vs. substrate for these studies are presented in Figure \(\PageIndex{4}\) below to show the temperature adaptation capacities of the enzymes.

Figure \(\PageIndex{4}\): The Q10 values for enzymatic activities (a–c) and glucose oxidation to CO2 (d) as dependent on substrate concentration at two altitudes. The blue and red rectangles show the concentration range at which no temperature effects occur (i.e < Scrit) with shading colors corresponding to different altitudes. The Q10 values derived from experimental data are shown as symbols. The model simulations based on experimentally obtained parameters of Michaelis–Menten kinetics are shown as curves (a–c). A non-linear trend was very weakly expressed for glucose oxidation (d) at 3020 m elevation. Bars show standard deviations of the means (n = 3). Blagodatskaya, E. et al. ibid.
The graphs show that Q10 for polymer degradation increased with increasing substrate concentration. The authors defined a substrate concentration threshold (Scrit) below which KM and VM values canceled each other out, so no increase in rate was seen with increasing temperature. The width of the rectangles is based on the best-fit dashed blue and red lines, not the data points. The Scrit values were 35–42% larger for the 3020 m (blue rectangle) soil samples than at 2010 m (red rectangle), even though SOC was lower at that elevation. Q10 values were always lower at S > Scrit at higher altitudes. This demonstrates that the enzymes responded less to higher temperatures at higher altitudes (blue dots and dashed lower curves). This implies that enzymes at higher latitudes exhibit significant compensatory changes, useful for microorganisms that experience a greater temperature range and larger shifts at these higher altitudes.
Figure \(\PageIndex{5}\) below shows that the Q values generally decrease over a larger range of altitudes for both enzyme activity (panel A) and glucose oxidation (Panel B).

Figure \(\PageIndex{5}\): The Q10total values for hydrolytic enzyme activity at saturating substrate concentrations (A) and the increase in Vmax and Km induced by a temperature increase from 10 to 20 °C for 14C-glucose oxidation (B) depending on altitude. Symbols – experimentally derived values for Q10total (B), Q10Vmax and Q10Km (A). Lines are the trend lines obtained by the best fitting of power (A) and linear functions (B) at P values < 0.05, bars show standard deviations of the means (n = 3). Blagodatskaya, Е. et al. ibid.
Panel B shows how Q10 values for KM apparent (green) and VM (red) for intracellular glucose oxidation/mineralization both decreased with increasing altitude. Again, consider these KM and VM values to be operationally defined and apply them not to an individual enzyme but, in a less rigorous way, to all the enzymes involved in the intracellular oxidation of glucose to CO2. Investigators could determine these values only by fitting the CO2 vs [glucose] kinetic data to the Michaelis-Menten equation. All altitudes < 2435 m showed Q10 KM values > 1.9, indicating that the apparent collective KM values were sensitive to temperature increase. This implies the "collective" set of enzymes responsible for intracellular glucose oxidation was more conformationally flexible, and higher temperatures caused significant increases in apparent KM values. However, at high altitudes, the Q10 values for the apparent KM were about 1, suggesting no temperature effects on the generic structure and apparent KM values for the enzymes. The high-altitude enzymes were effectively temperature-stable with respect to KM values. VM values were more sensitive to increasing temperatures at all altitudes, but little change was observed between 2435 and 3020 m. This again shows that the enzymes for microorganisms from high altitudes were more strongly adapted to temperature changes, especially at lower substrate concentrations.
The next part can be a bit confusing. The KM for a given enzyme increases with increasing temperature, as shown in Figure 2. This suggests that the apparent affinity of the given enzyme for substrates decreases, which makes intuitive sense. Figure \(\PageIndex{6}\) shows that the Q10 for KM (i.e., the sensitivity of KM to a temperature increase of 100 C) decreaseswith increasing elevation for each enzyme studied.

Figure \(\PageIndex{6}\): The values of Q10Km (a) and Q10Vmax (b) for hydrolytic reactions and for reactions of glucose oxidation at low and high altitudes. Bars show standard deviations of the means (n = 3).
The figure shows that both Q10Km and Q10Vmax were lower at high altitudes. Hence, the enzymes in organisms from higher altitudes did not respond as strongly to temperature changes. This again suggests that larger compensatory changes are found in enzymes at high latitudes, allowing them to better adapt to the greater temperature range they would experience.
These data suggest that thermal adaptations in the intracellular enzyme are driven more by the wide range of temperatures organisms experience than by the mean temperature. Compensatory and canceling changes in KM and VM at low substrate concentration led to a higher Scrit in cold-adapted organisms.
Structural Mechanisms for Enzyme Temperature Adaptation
Structure determines function. A detailed understanding of how proteins, and more directly enzymes, adapt to temperature changes must come from detailed structural analyses that can be correlated to functions such as enzyme catalytic activity. Two approaches have been used to study the structural bases of enzyme temperature adaptation. One involves the structural analysis of a single enzyme in organisms adapted to different temperatures. The other involves large computational analyses of protein structure databases. We'll discuss both. First, let's explore orthologs (i.e., proteins from the same gene in different species) of a single enzyme, ketosteroid isomerase (KSI), from mesophilic (grown at moderate temperatures) and thermophilic (grown at warm temperatures) bacteria.
Figure \(\PageIndex{7}\) below shows structural and functional features that document KSIs temperature adaptation through changes in activity and stability. Let's step through each panel in order.

Figure \(\PageIndex{7}\): Enzyme temperature adaptation through changes in activity and stability. Pinney et al., Science, 371. (2021). DOI: 10.1126/science.aay2784. Reprinted with permission of the American Association for the Advancement of Science and Copyright Clearance Center.
Panel (A) shows that as an organism's optimal growth temperature increases, the optimal temperature for selected enzyme activity also increases. Each dot represents a different species, and the enzymes are broadly chosen across all enzyme commission classes (i.e., the dots do not represent just KSI). There is a strong linear correlation.
Starting with Panel (B), we look at KSIs. Panel B shows the mechanism of isomerization of the steroid substrate, 5(10)-estren-3,17-dione [5(10)EST] by KSI. KSI has one of the highest kcat values of enzymes. The reaction changes the position of the C=C double bonds and proceeds through an enolate/oxyanion intermediate (EI) formed after the abstraction of a proton by Asp 40. The transition state, which would have a developing negative charge on the O atom, is stabilized by proximal Tyr 16 and Asp 103 in a developing oxyanion hole.
Panel (C) shows the KSI sequences from P. putida (a mesoKSI) and M. hassiacum (thermoKSI). The sequences are 33% identical, but some key residues (gray) are identical. Similar ones are shown in blue. The thermophilic KSI (thermKSI) has Ser 103 instead of the often conserved Asp 103 in mesophilic organisms (mesoKSI). D103 and S103 are shown in red.
Now let's look at Panel (D), which shows activity (v0/E0) vs substrate [5(10)EST], for the meso- and thermophilic enzymes. At a nominal temperature (25 oC, top left panel), the thermoKSI shows little activity. At their optimal growth temperatures (300 C for the mesoKSI and 65 0C for thermoKSI, bottom left), the thermoKSI has both a higher VM = kcatE0, and KM at 650 C. The higher KM is consistent with the idea that Km values are usually higher at higher temperatures. The derived kcat and kcat/KM values are shown in the adjacent histogram. Remember that kcat measures the number of bound substrate molecules converted to product per second (at saturating substrate concentrations). The parameter kcat/KM is a measure of the effective biomolecular rate constant for product formation at low substrate concentrations ([S] <<KM).
From an evolutionary perspective, early ancestral enzymes probably arose in warmer environments. When the Earth cooled, enzymes had to "solve" the problem, as is evident from the Arrhenius equation (the rate of reaction decreases with decreasing temperature). Hence, evolution would lead to structural changes facilitating higher kcat values, lower KM values, or both at lower temperatures. We've seen in the examples above that KM decreases with decreasing temperatures, so evolutionary pressures would more likely lead to increased kcat values. This is consistent with localized changes in protein dynamics as modulators of kcat. The evolutionary pressure to maintain stability would be low since proteins become more stable at lower temperatures.
Now, how thermally stable are the meso- and thermKSI? Urea denaturation experiments were used to determine the ΔG0 H2OU for enzyme unfolding, as described in Chapter 4.12. Panel (E) shows urea denaturation curves for mesoKSI (black) and thermoKSI (red) monitored by changes in internal tryptophan fluorescence (top) and stabilities extrapolated to 0 M urea (ΔGH2OU) (bottom). The denaturation curve for thermoKSI is significantly shifted to the right. The calculated values for ΔG0 H2O unfolding are +18.5 kcal/mol (mesoKSI )and about +25.3 (thermoKSI), a +6.8 kcal/mol difference. These values would be -18.5 kcal/mol (mesoKSI) and about -25.3 (thermoKSI) for the reverse folding reaction (unfolded ↔ folded transition).
Figure \(\PageIndex{8}\) shows an interactive iCn3D models of the bacterial ketosteroid isomerase from the mesophilic bacteria Pseudomonas Putida (left) and from the thermophilic bacteria Mycobacterium hassiacum (right).
_from_Pseudomonas_Putida_(pKSI)_bound_to_3%252C4-dinitrophenol_(6C17)V3.png?revision=1) |
_from_Mycobacterium_hassiacum_(mhKSI)_bound_to_3%252C4-dinitrophenol_(6P44).png?revision=1) |
|
Figure \(\PageIndex{8a}\): Mesophilic Ketosteroid Isomerase D40N mutant (monomer) from Pseudomonas Putida (pKSI) bound to 3,4-dinitrophenol (6C17). (Copyright; author via source). Click the image for a popup or use this external link: https://structure.ncbi.nlm.nih.gov/i...kH877KZKPxWsGA |
Figure \(\PageIndex{8b}\): Thermophilic Ketosteroid Isomerase D38N mutant (monomer) from Mycobacterium hassiacum (mhKSI) bound to 3,4-dinitrophenol (6P44). (Copyright; author via source). Click the image for a popup or use this external link: https://structure.ncbi.nlm.nih.gov/i...YbGw5zr2dRpnK8 |
Both structures contain a bound 3,4-dinitrophenol, a stable oxyanion, and a transition-state analog. The corresponding active site side chains are shown in colored sticks. Just one monomer of the dimer is shown for each protein for clarity. The key active-site residues F86, V88, V101, and D103 in mesoKSI are replaced by W86, L88, I101, and S103 in thermoKSI (all very conservative except for D103S). A water molecule forms a bridging hydrogen bond to the phenolate oxyanion from S103.
Figure \(\PageIndex{9}\) below shows the key change in Asp 103 (see the mechanism in Fig. 7B) in mesoKSI to Ser 103 + H2O in thermoKSI

Figure \(\PageIndex{9}\): Change from Asp 103 in mesoKSI to Ser 103 + H2O in thermoKSI
Asp 103 is initially protonated with a pKa is >9, much higher than in an aqueous solution (3.7). The hydrogen bond from the mesoKSI D103 to the phenolate is stronger than the bridging one from Ser 103 in the thermoKSI. This arises from the increased polarity of the OH on a carboxylic acid (Asp) compared to an alcohol (Ser). In addition, the hydrogen bond distance from the bound water to the phenolate is longer than from Asp 103. Hence, the Asp 103 in the thermoKSI improves enzymatic stability. In contrast, thermoKSI is less active at lower temperatures but more stable at higher temperatures. The role of Ser 103 in stabilizing the folded state is shown in Figure \(\PageIndex{10}\) below

Figure \(\PageIndex{10}\): Roles of Asp 103 and Ser 103 in the folding to unfolding transition of KSI
When mesoKSI unfolds, Asp 103, which is protonated and solvent-inaccessible in the native state, becomes solvent-exposed upon denaturation. Its pka drops, which leads to its deprotonation. This extra deprotonation step stabilizes the unfolded state (pulling the reaction to the right), making thermoKSI less thermally stable. In contrast, Ser 103, on solvent exposure, does not deprotonate, so the unfolded state is not additionally stabilized. Hence, Ser 103 leads to greater stability of the folded thermoKSI. The D103/S103 change is found in many KSI from many bacteria.
Here are some additional findings:
- The structures of mesoKSI and thermoKSI are highly similar, even though they have only 33% sequence identity. Figure \(\PageIndex{11}\) shows the conformational changes in the monomeric ketosteroid isomerase (KSI) going from the mesophilic enzyme (6C17, cyan) to the thermophilic one (6P44, magenta).
Figure \(\PageIndex{11}\): Conformational changes in the monomeric KSI going from the mesophilic enzyme (6C17, cyan) to the thermophilic one (6P44, magenta) enzyme
- The F86W change in the thermoKSI stabilizes the conformation of S103, thereby enhancing its stabilization of the oxyanion in the oxyanion hole and enabling high-temperature activity.
- Other KSI orthologs and mutants exhibit higher enzyme activity when they harbor D103.
- Changing key residues at 86, 88, and 101 in mesoKSI to those found in the thermoKSI additionally increased the stability of the mesoKSI
- Analysis of 1140 KSIs showed that the fraction containing D103 decreases with increasing growth temperature, and the fraction containing S103 increases.
It appears that KSI's thermal adaptation occurs primarily through a single amino acid change (D103S). The change reduces kcat for the mesoKSI 10x at low temperatures but greatly increases stability at high temperatures.
This switch and compensatory changes in activity and stability suggest that protonated Glu and Asp side chains involved in activity might be replaced with other amino acids that confer greater stability but reduce activity. A conserved and protonated active site Glu is found in glycosidases from high-temperature orthologs. Likewise, a protonated Asp side chain is found in thioredoxin. As a control, a change from a protonated Glu in triosephosphate isomerase, distal to the active site, to a Gln has no effect on catalysis and was not observed in thermophiles. It should be noted that not all stabilizing mutations decrease activity, as many examples show. 67 protonated Asp and Glu side chains were identified in the PDB, 14 of which were replaced in high-temperature orthologs.
Conservation of chaining pairs of amino acids between mesophilic and thermophilic organisms.
Are there other broadly found changes in amino acids (in addition to Asp/Glu) at each position in a mesophilic protein and its thermophilic ortholog? Computational analysis in 2194 enzyme families in 5582 bacterial species (for a total of 17 million amino acid pairs) was performed to explore this question. Half of all families had an amino acid at a given position, and this correlated with growth temperature, yielding almost 160,000 key positions. The results of this study are broadly outlined in Figure \(\PageIndex{12}\) below.

Figure \(\PageIndex{12}\): Examination of temperature-associated residues and their interactions. Pinney et al., ibid. Reprinted with permission of the American Association for the Advancement of Science and Copyright Clearance Center.
Let's explain each part of this complex figure.
Panel (A) - Preferences in the types of amino acids associated with high or low-temperature growth: Panel (A) shows the difference in frequency of association of given amino acids with high to low temperatures. Some amino acids were associated with low-temperature growth. These include alanine (A), glutamine (Q), and aspartate (D), as in KSI. Others were associated with high-temperature growth (E, I, Y, and K). F
Panel (B) - Identities and frequencies of site-specific residue changes across temperature growth conditions: Now let's see how a specific acid changes in going from mesophilic (low T) to thermophilic (high T), which shows key temperature-dependent amino acid changes. Panel (B) shows the frequency of observed site-specific changes in temperature-associated residues. The “+” indicates that the frequency of a change (such as Leu to Ile) is significant in comparison to the opposite change (Ile to Leu). Indeed, the darkest square is for a Leu (at low temperatures) to Ile (at high temperatures). Other darker squares indicate that these changes occur as temperature increases from low- to high-temperature-adapted bacteria: V → I, R → L, and D → E. The specific one found for KSI, D → S, does not stand out, most likely because of the diverse enzyme types included in the analysis.
Panel (C) - Identities and frequencies of physically interacting temperature-associated residue pairs (in a single protein): If one amino acid changes in going from a low to a high-temperature ortholog, it is likely that the original and changed amino acids physically contact different nearby amino acids in their respective protein. Panel (C) shows the difference in frequency of association with high vs. low-temperature growth bacterial enzymes for "all possible physically interacting pairs of residues (made up of residues R1 and R2) that change concomitantly with the growth temperature". The darker blue squares show interacting residue pairs found more often in low-growth temperature enzymes, while the darker maroon squares show contacting pairs in high-growth temperature proteins. The asterisk shows that pairs are statistically significant.
One of the darkest maroon squares (high-temperature enzymes) shows an Ile-Ile interaction pair. The vertical column above Ile (high growth) in Panel B shows that changes to Ile in high-temperature enzymes occur frequently from 6 different amino acids found in low-temperature enzymes. Ile might be favored over Val to maximize buried hydrophobic surface area. Also, compared to Leu, it has greater conformational flexibility and can better fill empty spaces in protein interiors.
A Lys to Glu (K to E) interaction is strongly associated with high-temperature enzymes. In contrast, an Arg-to-Asp (R to D) interaction is strongly associated with low-temperature enzymes. This implies that increasing the number of salt bridges (ion-ion interactions) does not make a protein more thermally adaptable. Lys salt bridges would have greater conformational flexibility than those using Arg. The same applies to Glu compared to Asp. Lys also has the largest hydrophobic surface area, which could enhance hydrophobic packing. Since Arg has hydrogen bond donors that require more adjacent hydrogen bond acceptors, the use of Arg might depend more on adjacent amino acids than on a binary pair.
In summary, these results are more nuanced than previous explanations for high-temperature stability:
- increasing branched chain residues like Ile, Leu, and Val in the packed hydrophobic core. Indeed, as seen in Panel B, the most frequent amino acid change observed is from Leu/Val in low-temperature growth orthologs to Ile in high-temperature growth orthologs. These are all branched-chain amino acids. They occur 2-3x more frequently than the reverse: Ile in low-temperature growth to Leu/Val in high-temperature growth. Panel C shows that Ile preferentially interacts with another Ile in a high-temperature-adapted enzyme. Hence, stability is not improved merely by substituting any hydrophobic side chain.
- increasing the number of salt bridges (ion-ion interactions) and hydrogen-bonding interactions between charged side chains. There are more charged side chains and salt bridges in thermophilic proteins. However, the above data show a clear preference for Lys in thermophilic proteins, as changes from Arg to Lys are common in that group, as shown in Panel B. Likewise, Asp to Glu changes from low to high temperature-adapted proteins are 3 times more likely than the reverse. In addition, Panel C shows that interactions between Lys and Glu are most strongly associated with high-temperature-adapted proteins, while Arg and Asp interactions are most often found in low-temperature-adapted proteins.
As mentioned, increasing temperature can cause local effects in a protein instead of large global changes that lead to denaturation at high temperatures. Changes occurring in the active site can affect kcat, KM, and kcat/KM. Allosteric effects also occur. The protein imidazole glycerol phosphate synthase (HisFH) is a heterodimer with two active sites, so it is considered a bienzyme. The H subunit is a glutaminase, which cleaves glutamine into glutamic acid and ammonia, which can diffuse through a channel to the active site of the F subunit, the cyclase. The enzyme's active form occurs only when both substrates are bound, resulting in long-range allosteric activation. In particular, the oxyanion hole in the H subunit forms in the activated state, stabilizing the tetrahedral transition intermediate in the hydrolysis of glutamine.
Figure \(\PageIndex{13}\) shows an interactive iCn3D models of the heterodimeric imidazole glycerol phosphate synthase complex (7AC8)
.png?revision=1)
Figure \(\PageIndex{13}\): (Copyright; author via source). Heterodimeric imidazole glycerol phosphate synthase complex (7AC8). Click the image for a popup or use this external link: https://structure.ncbi.nlm.nih.gov/i...S5MbiiA9bDvDQ8.
The HisH (glutaminase) subunit is shown in orange with a molecular surface and the bound substrate (spacefill) glutamine. The HisF subunit is shown in cyan, bound to a substrate.
An allosteric effector molecule can bind in the active site of His F and induce long-range conformational changes in this HisH active site, increasing its activity 5000x. The structures involved are shown in Figure \(\PageIndex{14}\) below.

Figure \(\PageIndex{14}\): Imidazole glycerol phosphate synthase (IGPS) from the thermophile Thermotoga maritima (T. maritime). Maschietto, F., Morzan, U.N., Tofoleanu, F. et al. Turning up the heat mimics allosteric signaling in imidazole-glycerol phosphate synthase. Nat Commun 14, 2239 (2023). https://doi.org/10.1038/s41467-023-37956-1. Creative Commons Attribution 4.0 International License. http://creativecommons.org/licenses/by/4.0/.
The HisF and HisH subunits are colored in green-to-blue and red-to-yellow gradients, respectively, and separated by a dotted line that marks the interface between HisF and HisH. The labels (fα2, fα3, fβ2, loop1, hα1, Ω-loop) indicate secondary structure elements directly involved in allosteric regulation.
Molecular dynamics and NMR studies have shown that increases in temperature lead to conformational changes resembling those observed upon binding of the allosteric effector at room temperature. As the temperature of the apoenzyme (no substrates or effects bound) increases from 30 °C to 50 °C, the dynamics and structure increasingly resemble the state induced by the effector. Increasing temperatures from climate change are likely to cause subtle conformational and dynamic changes in all proteins, with some of these changes having negative consequences.
Thermal determinants of yeast metabolism
With this basic background, we can attempt to understand the thermal determinants for entire metabolic pathways. This has been attempted in the yeast Saccharomyces cerevisiae, a eukaryotic organism that grows optimally around 30 °C, exhibits extremely limited growth at 40 °C, and shows no growth and death at 42 °C.
Mathematical modeling of all metabolic pathways in a cell is a daunting task. Accurate concentrations, rate constants, and dissociation constants are needed for all reactions. Genome-scale metabolic models (GEM) use a multitude of constants that are experimentally or computationally determined. There are usually significant uncertainties in the model's parameters. Bayesian statistics has been used to decrease these uncertainties. In Bayesian statistics, parameters and models are updated with known values and information. It is similar to machine learning models, which use data to train and refine the model.
A Bayesian model for S. cerevisiae was used as it is the most abundantly used organism in industry and has many GEMs. The GEM used was the enzyme-constrained GEM (ecGEM). It was then further developed into the enzyme-- and temperature-constrained GEM (etcGEM), which also incorporates the temperature dependence of the native enzyme (EN) concentration and kcat. For each enzyme, the melting point (TM), the change in heat capacity (ΔCp) for the transition state, and the optimal temperature (Topt) were included. We discussed both (TM) and the change in heat capacity (ΔCp) for proteins in Chapter 4.9. In addition, another term for non-growth-associated maintenance (NGAM) of the cells, which is also temperature-dependent, was included. Examples of non-growth-associated maintenance include maintaining membrane potential, turgor pressure, normal protein refolding, and DNA repair.
The Bayesian models reproduced the datasets well. Using the models, key enzymes that control the flux through metabolic pathways were determined at each temperature. The most rate-limiting enzyme at a superoptimal temperature in yeast was squalene epoxidase (ERG1), which is involved in sterol metabolism. Replacing the S. cerevisiae enzyme with one from a thermotolerant yeast strain resulted in better growth than in wild-type cells.
Figure \(\PageIndex{15}\) below shows the complexity and extent of the metabolic proteins and pathways of the enzyme-constrained GEM (ecGEM).

Figure \(\PageIndex{15}\: Metabolic proteins and pathways included in the enzyme-constrained GEM. Benjamín J Sánchez et al., Molecular Systems Biology (2017)13:935. https://doi.org/10.15252/msb.20167411. Creative Commons CC BY
Now, let's explore some of the results of the study. Figure \(\PageIndex{16}\) below shows how the temperature dependencies of proteins were incorporated into the enzyme-constrained GEMs.

Figure \(\PageIndex{16}\): Using Bayesian statistical learning to integrate temperature dependence in enzyme-constrained GEMs. Li, G et al., Nat Commun 12, 190 (2021). https://doi.org/10.1038/s41467-020-20338-2. Creative Commons Attribution 4.0 International License. http://creativecommons.org/licenses/by/4.0/.
Panel a shows the complexity of the metabolic network used to produce the ecYeast7.6, shown in greater detail in Fig. 13 above, and how EN and kcat depend on temperature.
Panel b shows how a two-state denaturation model was used. [E]N is the enzyme concentration in the native state; Topt is the optimal temperature at which the specific activity is maximized; Tm and T90 are temperatures at which there is a 50% and 90% probability that an enzyme is in the denatured state, respectively. In Chapter 4.4, we indicated that for a reversible two-state transition, TM is the temperature at which half of the enzyme is native and half denatured, giving a Keq for the N ↔ D equilibrium of 1.
Panel c shows how kcat depends on temperature. The insert shows how the heat capacity changes from E + S to the E-transition state. We have previously observed that ΔCP > 0 for protein unfolding, and this positive ΔCP value is a signature of the hydrophobic effect that occurs when nonpolar groups become more solvent-exposed. We previously showed that enzymes bind the transition state more tightly than they bind the substrate. This -ΔCP is more in line with the latter.
Panel d shows the temperature dependence of the enzyme's specific activity, r, as a function of temperature, which is determined by EN (panel B) and kcat (panel C).
Now we can explore the outputs of the ecGEM run with the separate added effects of temperature on NGAM, kcat, and EN (denaturation). Finally, the combined etcGEM was run. The combined etcGEM produced the observed outcomes in yeast growth. Given that the contributions of each of the three factors, NGAM, kcat, and protein denaturation, to whole-cell growth could be modeled. The outcomes from these models as a function of temperature are shown in Figure \(\PageIndex{17}\). They support the notion that temperature effects on yeast enzymes explain yeast growth rate.

Figure \(\PageIndex{17}\): Fig. 3: Yeast growth rate is explained by temperature effects on its enzymes. Li, G et al., ibid
This figure shows how the temperature dependence of different processes combines to affect the growth rate. EC is the prediction from the enzyme contained GEM, —predictions with the enzyme-constrained model; ec+NGAM includes temperature effects on nongrowth-associated maintenance; ec+kcat(T) incorporates the temperature effects on enzyme kcat values; ec+denaturation(T) incorporates the temperature effects on enzyme denaturation. Finally, in the etc model, the enzyme and temperature-constrained model incorporates temperature effects on all three (NGAM, kcat and enzyme denaturation) into the ec model. The solid lines indicate median values, and the shaded areas indicate the region between the 5th and 95th percentiles (n = 100).
Here are some summarized results:
- <29 °C, only temperature-dependent kcat affected the cell growth rate (green line under the orange etc line <29 °C;
- at 29 °C <T < 35 °C, both kcat and NGAM (gray line) determined the growth rate;
- at T > 35 °C, enzyme denaturation at major effects and by 40 °C was dominant,
Figure \(\PageIndex{18d-e}\) shows, using images, how the temperature dependencies of the factors EN, kcat, and r (specific activity) affect yeast growth. A phenomenal amount of data is displayed in these images.

Figure \(\PageIndex{18d-e}\): Fig. 3: Yeast growth rate is explained by temperature effects on its enzymes. Li, G et al., ibid
Panel d shows the probability that a given enzyme is in the native state. Think of the y-axis as increasing 1 pixel at a time from bottom to top, with each newly added pixel representing a different enzyme for 764 enzymes along the y-axis. The x-axis shows, with each pixel (at a given y-axis value), if the enzyme is native at that temperature
The interface between bright (native) and black (denatured) on the right side of the image shows that some enzymes (top) become unfolded at 40 oC, while some don't unfold until close to 60 oC
Panel e shows normalized kcat values of 764 enzymes at different temperatures. The brightest white pixels show the highest kcat values. The image clearly shows the brightest vertical band at around 30 oC, the optimal growth temperature of yeast.
Panel f shows the normalized specific activities (r) of 764 enzymes at different temperatures. Again, the highest specific activity is centered around 30 oC.
Note in Fig. 15d that most enzymes also denature at temperatures < -10 oC, but cells were not viable under those conditions.
The etcGEM replicated a finding that, above 37 °C, yeast cells switch from respiration to partial fermentation, accompanied by a larger flux through glycolysis. This occurred because specific enzyme activities decreased with increasing temperature, constraining metabolism. In addition, the total protein concentration reaches a limit and cannot increase further, which could have increased enzyme activity. Along with increased glycolysis, mitochondrial ATP production decreases. Respiration produces more ATP per mole of glucose, but glycolysis/fermentation produces more ATP/protein mass, so when protein concentration reaches a maximum, glycolysis is more efficient.
Lastly, the etcGEM was used to identify enzymes whose fluxes changed most at superoptimal temperatures. (We introduced the flux control coefficient in Chapter 14.3). The results of this modeling are shown in Figure \(\PageIndex{19}\) below.

Figure \(\PageIndex{19}\): Flux control coefficients at the superoptimal model for yeast.
One enzyme that stands out in Panel a, ERG1, is squalene epoxidase, an enzyme involved in sterol oxidation. If the wild-type enzyme was replaced with a temperature-insensitive ERG1, the specific growth rate increased significantly (over 55%).
What does this have to do with climate change? Life's Thermal Tolerance and Limits
We've just explored the molecular and metabolic adaptations that allow organisms to thrive at higher temperatures. The question is how quickly the present life can adapt to global warming driven by rising greenhouse gas levels. Life on the planet will adapt, but the diversity of life forms in the biosphere will change. Five mass extinctions have occurred over the last 450 million years up until the present, as shown in Figure \(\PageIndex{20}\) below.
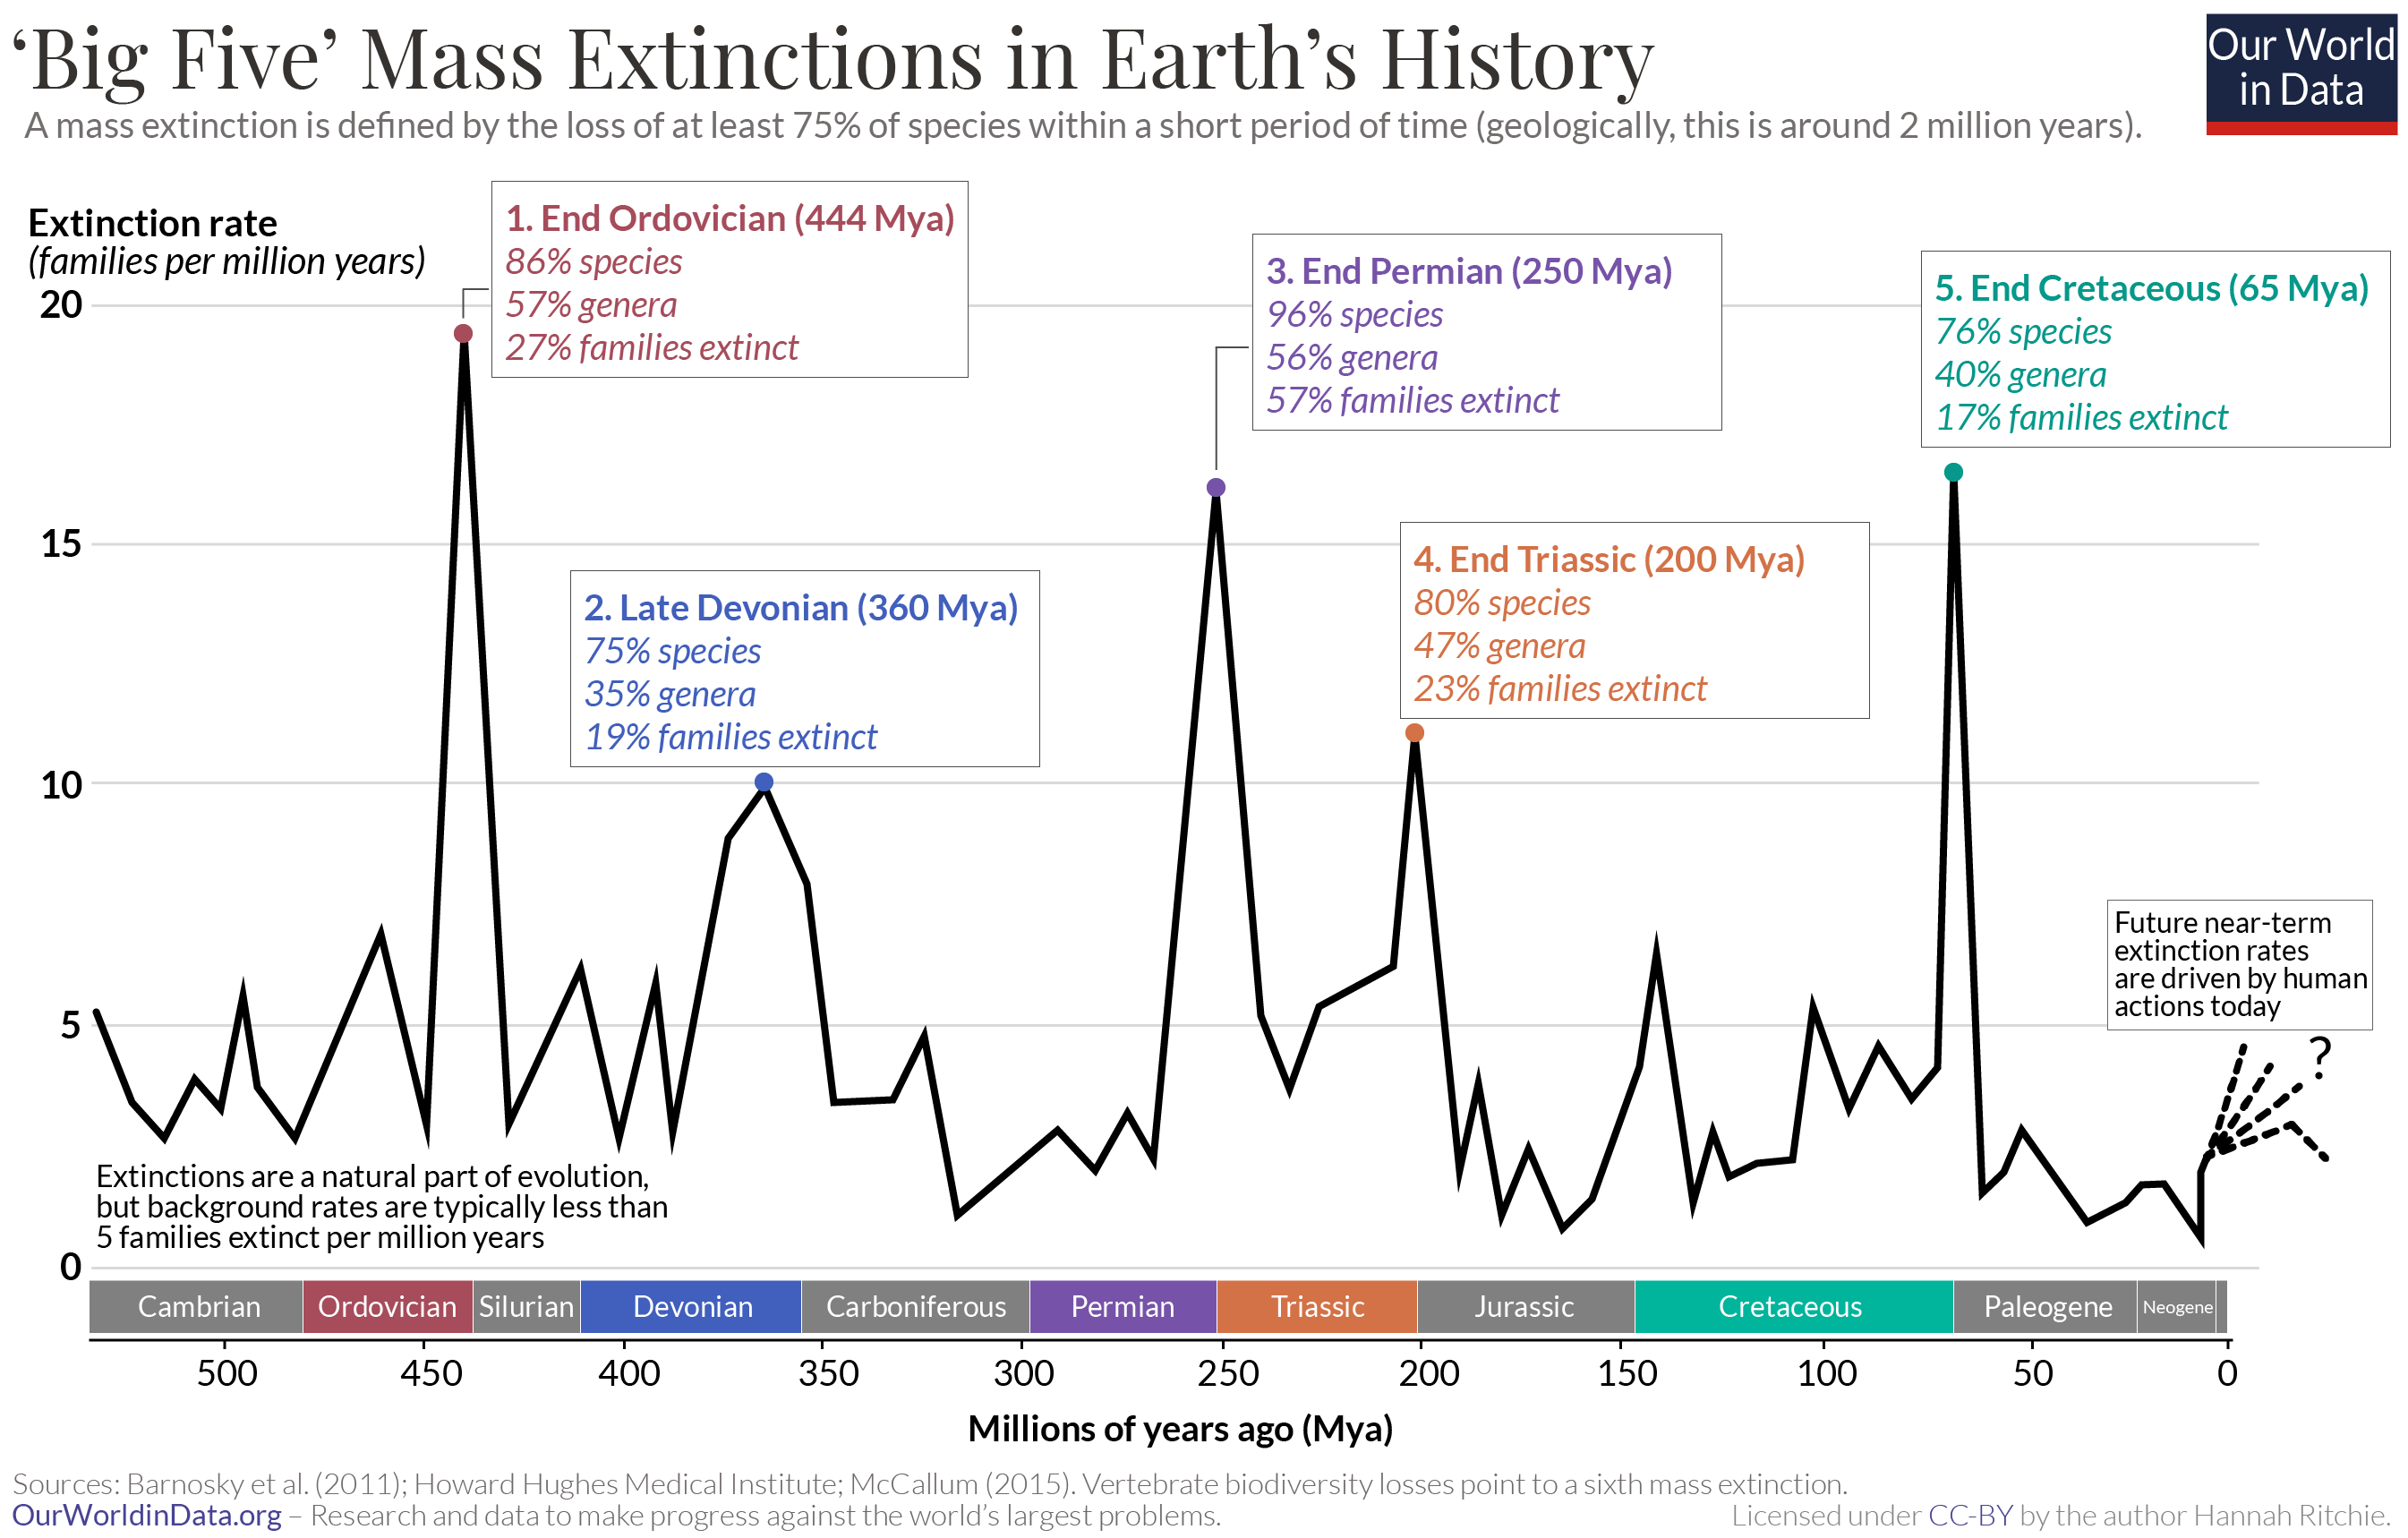
Figure \(\PageIndex{20}\): Five mass extinctions over the last 450 million years. Hannah Ritchie. Our World in Data. https://ourworldindata.org/mass-extinctions. Creative Commons BY license.
Many factors, often interrelated, can contribute to mass extinction. These include volcanism, asteroid impact, climate change, ocean anoxia, and the release of methane from ocean hydrates and permafrost. All are associated with increased temperatures, as shown in Figure \(\PageIndex{21}\). It documents the correlation between temperature changes and the extinction rate for marine animals over the last 450 years. The gray bars highlight the extinction cycle.

Figure \(\PageIndex{21}\): Temperature change and extinction rate over the past 450 million years. Song, H., Kemp, D.B., Tian, L. et al. Nat Commun 12, 4694 (2021). https://doi.org/10.1038/s41467-021-25019-2. Creative Commons Attribution 4.0 International License. http://creativecommons.org/licenses/by/4.0/.
Pane a shows the largest magnitude of temperature change (ΔT, absolute value) in each time interval (bin)
Panel b shows the maximum rate of change in temperature (R, absolute value) in each time bin, expressed at the million-year (Myr) scale.
Panel c shows the generic extinction rates of marine animals calculated using gap-filler methods using data from the Paleobiology Database. The Big Five extinctions occurred in the end-Ordovician (OS), Frasnian-Famennian transition (FF), Permian-Triassic transition (PT), Triassic-Jurassic transition (TJ), and Cretaceous-Paleogene transition (KPg). Vertical bars show mean ± 1 x standard deviation (see Methods). O Ordovician, S Silurian, D Devonian, C Carboniferous, P Permian, T Triassic, J Jurassic, K Cretaceous, Pg Paleogene, N Neogene. Dark cyan, blue, and red dots represent ΔT, R, and extinction rate, respectively.
The authors suggest that a temperature change of >5.2 °C and a rate of >10 °C/Myr would lead to a new extinction rate comparable to the "Big Five". A rise of 5.2 °C is in the upper range of the IPCC projection (but likely only with human inaction to prevent it). The current rate of temperature increase (about 2 °C per 200 years) is unprecedented over the last 3 million years. So it appears that we are headed to a 6th mass extinction caused by a combination of environmental degradation, pollution, and climate change created by humans.
Rothamn has suggested that we could tip into an "official" mass extinction depending on the magnitude and rate of change in the carbon cycle. If long-scale changes occur too quickly and organisms can't adapt, extinction follows. If the changes occur on a short time scale (as is happening now), the size of the change is a key factor. His analysis suggests that a key factor is the anthropogenically driven increase in ocean CO2. A threshold of 310 Pg (Gt), which we could reach by 2100, could officially trigger the sixth mass extinction. However, many would argue that we are already in the 6th extinction cycle. For example, of about 30,000 terrestrial vertebrate species, about 1.7% (515 species) are on the verge of extinction (having <1000 individuals). 77 mammal and bird species have lost most of their populations.
When it comes to how organisms will adapt to our present climate change, Hochachka and Somero ask six relevant questions:
- What is the thermal optima, and how much change leads to suboptimal or lethal conditions?
- What mechanisms set upper limits?
- How close do organisms live to the limits of their thermal tolerance?
- To what extent can organisms acclimate to temperature increases?
- When are genetic changes necessary for survival?
- Does the acquisition of heat tolerance reduce cold tolerance?
We can ask if organisms can survive and thrive, and at what cost. Humans most assuredly can survive a warming world. Still, if temperatures become too high, they will not thrive, and parts of the world will become uninhabitable, with high economic, social, political, and cultural costs. Some organisms will become extinct. Mass migrations of all species will occur as they seek more habitable environments.
In an evolutionary sense, species occupy environments in which they can survive and adapt. Our climate has been fairly constant since the end of the last ice age, about 12,000 years ago. Climatic changes that make an environment suboptimal depend on an organism's sensitivity and how close it lives to its thermal limits. We have already documented the thermal limits of individual enzymes and whole metabolic systems.
As you learned in introductory chemistry, multiple linked reactions can only go as fast as their slowest step. An analogous insight is that a chain is only as strong as its weakest link. It may be that the membranes, not proteins, are the weakest link in temperature adaptation, as higher temperatures alter phases and subphases, such as lipid rafts, which can in turn disrupt the activity of membrane proteins. Membrane functions (permeability, endo- and exocytosis, and maintenance of transmembrane potentials) are also very important.
Temperature effects on neural communication in synapses might be key. An interesting example is a particular Antarctic fish that, after prolonged exposure to 4 °C, dies when temperatures are raised to around 9 °C. Synaptic transmission through the acetylcholine receptor is altered as the amount of acetylcholine in the synapse increases and the rate at which it is degraded by acetylcholinesterase decreases.
The lethal temperature for an organism can depend on many factors, including the rate of temperature increase, the length of exposure, previous long-term acclimatization, and, for humans, humidity. Humans can't dissipate body heat by sweating if the external temperature is >37 0C (the average body temperature). If the humidity is high enough, sweating is ineffective in dissipating heat. Since metabolism produces heat, the body temperature can increase past 37 0C even if the external temperature is lower. A lethal limit for humans can occur as low as 29 0C (84 0C) at a relative humidity of 85%. Even now, about 30% of the human population is exposed to lethal thresholds at least 20 days/yr, and this will only grow as temperatures and humidity increase.
Comparisons of similar species (congeneric) that live in intertidal regions (above the waterline at low tide and underwater at high tide) vs. subtidal regions (close to shore but always submerged) reveal significant differences. Organisms living in intertidal regions will experience a higher range of temperatures. 19 species of congeneric porcelain crabs inhabit different latitudes and vertical depths in intertidal and subtidal regions. Intertidal crabs in regions with highly variable temperatures are exposed to temperatures much closer to their lethal temperature limit, indicating that the Tlethal - Tmax habitat gets smaller. Heart function and neural activity at higher temperatures appear to be weak links in survival. Heat shock protein function is also different in congeners of marine snails. Lethal temperatures appear to be those at which protein synthesis dramatically decreases. Repair of damaged proteins is reduced, limiting vertical migration to lower temperatures and increasing organisms' susceptibility to predation. These effects can occur over a small increase in temperature (a few degrees Celsius). It becomes more important to heed the IPCC's warnings to limit global average temperature increases to 1.5 °C or, more likely, to the 2.5 °C range.
Laboratory experiments in directed evolution show that an organism's thermal tolerance can be increased, but there are limits. E. Coli can live at a variety of temperatures, and experiments to evolve them at 37 0C (human gut temperature), at 42 0C (close to their lethal limit), and in an environment with fluctuating temperatures (between 32 0C - 42 0C) have been conducted. Over 1000 generations, the rate of evolution was highest in the 42 °C group. The group that evolved at fluctuating temperatures was better adapted to both higher and lower temperatures. Under no circumstances did E. coli evolve into a thermophilic species, which would require novel gene function rather than just a small set of mutations that yield more optimal values of kcat and KM for enzyme catalysis.
Summary
(Summary written by Claude, Anthropic)
This chapter examines how temperature affects enzyme structure, function, and organismal metabolism across scales from individual active sites to genome-scale metabolic networks to ecological extinction thresholds — connecting molecular biochemistry to the most urgent consequences of climate change.
Competing temperature effects on enzyme function. As temperature rises, two opposing processes determine enzyme fate. First, kcat and VM increase with temperature following the Arrhenius equation. Second, the rate of thermal inactivation (kinact) also increases — generally more steeply than kcat — producing a bell-shaped VM curve with an optimal temperature. KM simultaneously increases with temperature, reflecting weaker substrate binding at higher conformational entropy. The ratio kcat/kinact, termed catalytic power, therefore declines as temperatures rise above the optimum. Evolution has responded to this tension in opposite directions: thermophiles evolve greater structural stability (sacrificing some activity at moderate temperatures), while psychrophiles evolve higher kcat and greater flexibility to maintain catalytic rates in the cold. Both represent trade-offs between stability and activity.
Soil enzymes and SOC dynamics. Soil stores approximately 1,500 Gt of organic carbon — more than the atmosphere and all vegetation combined — making microbial enzyme activity a critical lever in the global carbon budget. SOC is high at northern latitudes because low temperatures suppress microbial respiration; warming accelerates decomposition and threatens to release large amounts of stored CO₂ in a positive feedback loop. Studies of three extracellular enzymes (β-1,4-glucosidase, N-acetylglucosaminidase, acid phosphatase) in Mount Kilimanjaro soil samples reveal a critical phenomenon: at a single elevation, increasing temperature from 10°C to 20°C raises both KM and VM by approximately equal proportions, causing their effects on reaction rate to cancel at low substrate concentrations. This defines a critical substrate threshold (Scrit) below which temperature has no net effect on polymer degradation rate. Above Scrit, warming accelerates decomposition. Intracellular glucose oxidation (mineralization) shows no such cancellation — rates increase at all substrate concentrations — suggesting qualitatively different adaptive responses for extracellular versus intracellular enzyme systems. Comparing enzymes from organisms at 2,010 m versus 3,020 m elevation shows that cold-adapted organisms have lower Q₁₀KM and Q₁₀VM values and substantially higher Scrit — demonstrating that organisms experiencing wider temperature ranges have evolved stronger compensatory thermal buffering. Thermal adaptation appears driven more by the breadth of temperature fluctuation than by mean temperature alone.
Structural mechanisms of thermal adaptation in KSI. Ketosteroid isomerase (KSI), one of the fastest enzymes known, provides a detailed molecular case study. Comparing orthologs from Pseudomonas putida (mesoKSI) and Mycobacterium hassiacum (thermoKSI) — which share only 33% sequence identity — reveals how modest structural changes produce large differences in stability and activity. The key substitution is D103S: Asp 103 in mesoKSI participates directly in oxyanion hole stabilization; Ser 103 in thermoKSI bridges to the oxyanion intermediate via a water molecule with a weaker hydrogen bond, reducing kcat ~10-fold at low temperatures. However, Asp 103 deprotonates upon solvent exposure during unfolding (its pKa drops from >9 in the buried native state to ~3.7 when solvent-exposed), thermodynamically stabilizing the unfolded state and making mesoKSI less thermally stable. Ser 103 does not deprotonate upon unfolding, leaving the native thermoKSI relatively more stable (ΔΔG° ≈ +6.8 kcal/mol). Conservative substitutions at positions 86, 88, and 101 (F86W, V88L, V101I) further stabilize thermoKSI. Analysis of 1,140 KSI sequences confirms a global trend: the D103 fraction decreases as optimal growth temperature increases, with S103 correspondingly rising. This pattern extends to other enzyme families where protonated active-site Glu and Asp residues are replaced in thermophiles.
Computational analysis of thermophilic adaptations. A large-scale computational analysis of 2,194 enzyme families from 5,582 bacterial species identifies broadly applicable principles of thermal adaptation. Thermophiles preferentially contain Ile, Glu, Tyr, and Lys, while mesophiles favor Ala, Gln, and Asp. The most frequent temperature-associated change is Leu/Val → Ile (occurring 2–3× more than the reverse), because Ile better fills interior cavities and has greater conformational flexibility than Leu while maintaining branched-chain hydrophobic packing. Ile-Ile contact pairs are the most strongly thermophile-associated interacting pair. For charged residues, Arg → Lys and Asp → Glu changes are characteristic of thermophiles: Lys and Glu have greater conformational flexibility and Lys additionally has larger hydrophobic surface area than Arg and Asp respectively. Lys-Glu salt bridges are most strongly associated with thermophilic proteins, while Arg-Asp pairs dominate in mesophilic ones. The results challenge simple earlier models attributing thermostability solely to increased salt bridges or hydrophobic packing, showing instead that the identity — not just the presence — of interacting pairs matters critically.
Allosterism and genome-scale metabolic modeling. Temperature affects not just individual active sites but also allosteric communication between them. In imidazole glycerol phosphate synthase (IGPS) from Thermotoga maritima, molecular dynamics simulations show that increasing temperature from 30°C to 50°C produces conformational changes in the apoenzyme that closely resemble those induced by the allosteric effector at room temperature — effectively mimicking allosteric activation. This demonstrates that climate warming can subtly reconfigure protein dynamics with functional consequences throughout the metabolome.
Genome-scale modeling of S. cerevisiae using the enzyme-and-temperature-constrained GEM (etcGEM) — incorporating temperature dependences of enzyme native concentration (EN), kcat, and non-growth-associated maintenance (NGAM) — reproduces the observed yeast growth curve including sharply reduced growth above 37°C and no growth at 42°C. Modeling reveals that below 29°C, kcat alone limits growth; from 29–35°C, both kcat and NGAM are rate-limiting; above 35°C, enzyme denaturation dominates and is essentially the sole constraint by 40°C. The model also reproduces the metabolic switch from respiration to fermentation at supraoptimal temperatures: as specific enzyme activities fall and total protein concentration saturates, glycolysis becomes more ATP-efficient per unit protein mass than oxidative phosphorylation. Flux control analysis identifies squalene epoxidase (ERG1) as the key bottleneck at supraoptimal temperatures; replacing it with a thermotolerant ortholog increases growth rate by over 55%.
Ecological thermal limits and mass extinction. Temperature increases of >5.2°C and rates of change of >10°C per million years correlate with each of the five major mass extinctions over the past 450 million years. Current human-driven warming (~2°C/200 years) is orders of magnitude faster than any geological rate of change in the 3-million-year record, and Rothman's analysis suggests that anthropogenic CO₂ additions approaching 310 Gt (possibly reached by 2100) could officially trigger a sixth mass extinction — though many argue this cycle has already begun. Mechanistically, the weakest thermal links in organisms are not necessarily enzymes but membranes (phase disruption, lipid raft dissolution), synaptic transmission (as in Antarctic fish dying at 9°C from acetylcholine receptor dysfunction), and protein synthesis (which declines dramatically near lethal temperatures). Lethal thermal limits in humans depend critically on humidity: at 85% relative humidity, 29°C can be lethal because sweating cannot dissipate metabolically generated heat. Approximately 30% of the global human population already experiences exposure to lethal thermal thresholds at least 20 days per year. Directed evolution experiments with E. coli confirm that organisms can adapt to higher temperatures through gradual mutation accumulation, but cannot transform into thermophilic species — the magnitude of genetic change required is too great for the pace of current climate warming.