
16.5: Thermodynamics
- Page ID
- 9635

\( \newcommand{\vecs}[1]{\overset { \scriptstyle \rightharpoonup} {\mathbf{#1}} } \)
\( \newcommand{\vecd}[1]{\overset{-\!-\!\rightharpoonup}{\vphantom{a}\smash {#1}}} \)
\( \newcommand{\dsum}{\displaystyle\sum\limits} \)
\( \newcommand{\dint}{\displaystyle\int\limits} \)
\( \newcommand{\dlim}{\displaystyle\lim\limits} \)
\( \newcommand{\id}{\mathrm{id}}\) \( \newcommand{\Span}{\mathrm{span}}\)
( \newcommand{\kernel}{\mathrm{null}\,}\) \( \newcommand{\range}{\mathrm{range}\,}\)
\( \newcommand{\RealPart}{\mathrm{Re}}\) \( \newcommand{\ImaginaryPart}{\mathrm{Im}}\)
\( \newcommand{\Argument}{\mathrm{Arg}}\) \( \newcommand{\norm}[1]{\| #1 \|}\)
\( \newcommand{\inner}[2]{\langle #1, #2 \rangle}\)
\( \newcommand{\Span}{\mathrm{span}}\)
\( \newcommand{\id}{\mathrm{id}}\)
\( \newcommand{\Span}{\mathrm{span}}\)
\( \newcommand{\kernel}{\mathrm{null}\,}\)
\( \newcommand{\range}{\mathrm{range}\,}\)
\( \newcommand{\RealPart}{\mathrm{Re}}\)
\( \newcommand{\ImaginaryPart}{\mathrm{Im}}\)
\( \newcommand{\Argument}{\mathrm{Arg}}\)
\( \newcommand{\norm}[1]{\| #1 \|}\)
\( \newcommand{\inner}[2]{\langle #1, #2 \rangle}\)
\( \newcommand{\Span}{\mathrm{span}}\) \( \newcommand{\AA}{\unicode[.8,0]{x212B}}\)
\( \newcommand{\vectorA}[1]{\vec{#1}} % arrow\)
\( \newcommand{\vectorAt}[1]{\vec{\text{#1}}} % arrow\)
\( \newcommand{\vectorB}[1]{\overset { \scriptstyle \rightharpoonup} {\mathbf{#1}} } \)
\( \newcommand{\vectorC}[1]{\textbf{#1}} \)
\( \newcommand{\vectorD}[1]{\overrightarrow{#1}} \)
\( \newcommand{\vectorDt}[1]{\overrightarrow{\text{#1}}} \)
\( \newcommand{\vectE}[1]{\overset{-\!-\!\rightharpoonup}{\vphantom{a}\smash{\mathbf {#1}}}} \)
\( \newcommand{\vecs}[1]{\overset { \scriptstyle \rightharpoonup} {\mathbf{#1}} } \)
\(\newcommand{\longvect}{\overrightarrow}\)
\( \newcommand{\vecd}[1]{\overset{-\!-\!\rightharpoonup}{\vphantom{a}\smash {#1}}} \)
\(\newcommand{\avec}{\mathbf a}\) \(\newcommand{\bvec}{\mathbf b}\) \(\newcommand{\cvec}{\mathbf c}\) \(\newcommand{\dvec}{\mathbf d}\) \(\newcommand{\dtil}{\widetilde{\mathbf d}}\) \(\newcommand{\evec}{\mathbf e}\) \(\newcommand{\fvec}{\mathbf f}\) \(\newcommand{\nvec}{\mathbf n}\) \(\newcommand{\pvec}{\mathbf p}\) \(\newcommand{\qvec}{\mathbf q}\) \(\newcommand{\svec}{\mathbf s}\) \(\newcommand{\tvec}{\mathbf t}\) \(\newcommand{\uvec}{\mathbf u}\) \(\newcommand{\vvec}{\mathbf v}\) \(\newcommand{\wvec}{\mathbf w}\) \(\newcommand{\xvec}{\mathbf x}\) \(\newcommand{\yvec}{\mathbf y}\) \(\newcommand{\zvec}{\mathbf z}\) \(\newcommand{\rvec}{\mathbf r}\) \(\newcommand{\mvec}{\mathbf m}\) \(\newcommand{\zerovec}{\mathbf 0}\) \(\newcommand{\onevec}{\mathbf 1}\) \(\newcommand{\real}{\mathbb R}\) \(\newcommand{\twovec}[2]{\left[\begin{array}{r}#1 \\ #2 \end{array}\right]}\) \(\newcommand{\ctwovec}[2]{\left[\begin{array}{c}#1 \\ #2 \end{array}\right]}\) \(\newcommand{\threevec}[3]{\left[\begin{array}{r}#1 \\ #2 \\ #3 \end{array}\right]}\) \(\newcommand{\cthreevec}[3]{\left[\begin{array}{c}#1 \\ #2 \\ #3 \end{array}\right]}\) \(\newcommand{\fourvec}[4]{\left[\begin{array}{r}#1 \\ #2 \\ #3 \\ #4 \end{array}\right]}\) \(\newcommand{\cfourvec}[4]{\left[\begin{array}{c}#1 \\ #2 \\ #3 \\ #4 \end{array}\right]}\) \(\newcommand{\fivevec}[5]{\left[\begin{array}{r}#1 \\ #2 \\ #3 \\ #4 \\ #5 \\ \end{array}\right]}\) \(\newcommand{\cfivevec}[5]{\left[\begin{array}{c}#1 \\ #2 \\ #3 \\ #4 \\ #5 \\ \end{array}\right]}\) \(\newcommand{\mattwo}[4]{\left[\begin{array}{rr}#1 \amp #2 \\ #3 \amp #4 \\ \end{array}\right]}\) \(\newcommand{\laspan}[1]{\text{Span}\{#1\}}\) \(\newcommand{\bcal}{\cal B}\) \(\newcommand{\ccal}{\cal C}\) \(\newcommand{\scal}{\cal S}\) \(\newcommand{\wcal}{\cal W}\) \(\newcommand{\ecal}{\cal E}\) \(\newcommand{\coords}[2]{\left\{#1\right\}_{#2}}\) \(\newcommand{\gray}[1]{\color{gray}{#1}}\) \(\newcommand{\lgray}[1]{\color{lightgray}{#1}}\) \(\newcommand{\rank}{\operatorname{rank}}\) \(\newcommand{\row}{\text{Row}}\) \(\newcommand{\col}{\text{Col}}\) \(\renewcommand{\row}{\text{Row}}\) \(\newcommand{\nul}{\text{Nul}}\) \(\newcommand{\var}{\text{Var}}\) \(\newcommand{\corr}{\text{corr}}\) \(\newcommand{\len}[1]{\left|#1\right|}\) \(\newcommand{\bbar}{\overline{\bvec}}\) \(\newcommand{\bhat}{\widehat{\bvec}}\) \(\newcommand{\bperp}{\bvec^\perp}\) \(\newcommand{\xhat}{\widehat{\xvec}}\) \(\newcommand{\vhat}{\widehat{\vvec}}\) \(\newcommand{\uhat}{\widehat{\uvec}}\) \(\newcommand{\what}{\widehat{\wvec}}\) \(\newcommand{\Sighat}{\widehat{\Sigma}}\) \(\newcommand{\lt}{<}\) \(\newcommand{\gt}{>}\) \(\newcommand{\amp}{&}\) \(\definecolor{fillinmathshade}{gray}{0.9}\)Tropical cyclones work somewhat like engines. There is an intake system (the atmospheric boundary layer) that draws in the fuel (warm, humid air). The engine (thunderstorms) converts heat into mechanical energy (winds and waves). And there is an exhaust system (precipitation fallout for water and anvil blowout for air) for the spent fuel.
16.5.1. Fuel Creation and Intake
In midlatitudes, thunderstorms can last for hours. However, tropical cyclones (which are made of thunderstorms) can last for weeks. Why the difference in longevity?
The main reason is that mid-latitude thunderstorms use warm humid air from only the nearby boundary layer, and after this nearby fuel is consumed the thunderstorms die. Even supercells and squall-line storms rely on an existing fuel supply of warm humid air, which they can utilize as they move across the countryside.
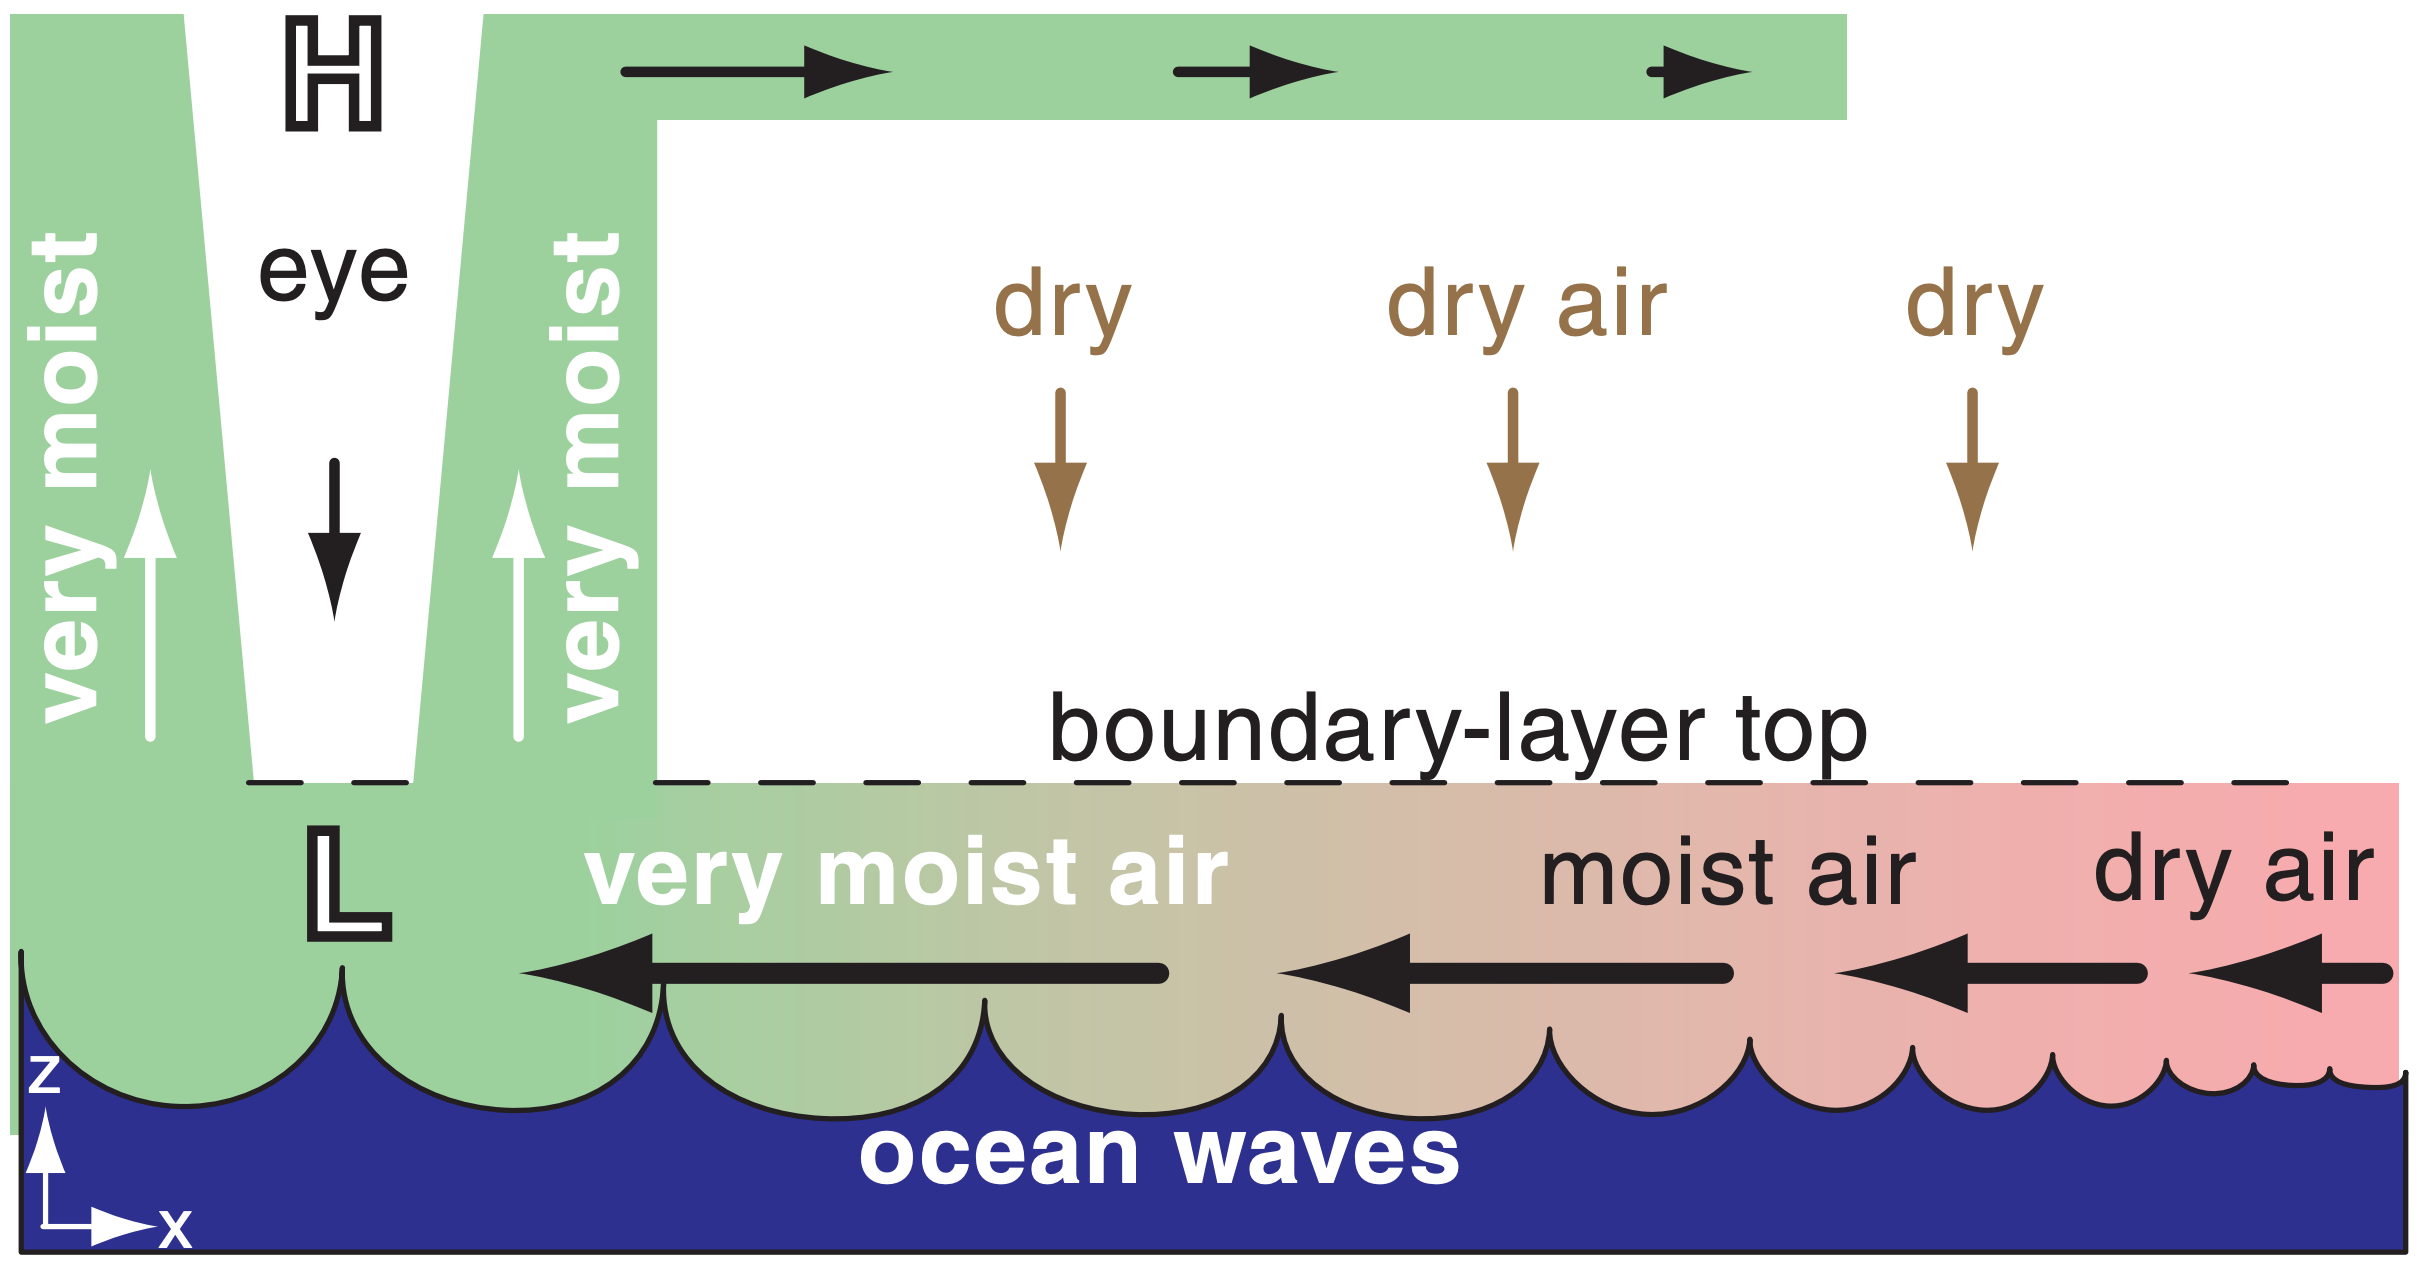
However, tropical cyclones create their own fuel of warm humid boundary-layer air. They do this via the fast near-surface winds that create large ocean waves (Fig. 16.26). These violent waves break and foam, causing rapid evaporation of sea-spray water into the air, and efficient transfer of heat from the ocean surface to the air. By the time this air reaches the base of the eyewall, it has an air temperature nearly equal to the sea-surface temperature and a relative humidity of nearly 100%.
Namely, tropical cyclones extract heat from the ocean. The ocean is a giant heat reservoir that has been absorbing sunlight all Summer and early Fall. This is the reason why warm, deep sea-surface temperatures are needed for tropical cyclones.
One way to estimate the energy of tropical cyclones is by the amount of latent heat released during condensation. Rainfall rate is a measure of the net condensation.
An average Atlantic Hurricane produces about 1.5 cm of rain day–1, which when accumulated over the area (of radius 665 km) covered by hurricane rain is equivalent to 2.1x10¹⁰ m3 day–1.
This converts to 6x10¹⁴ W (= 5.2x10¹⁹ J day–1). Namely, it is about 200 times the daily electricity generation capacity of the whole world.
16.5.2. Exhaust
The large volume of inflowing boundary-layer air is good and bad for the tropical cyclone. It is good because this air carries the sensible and latent heat fuel for the storm. It is bad because it also brings massive amounts of other air molecules (nitrogen, oxygen) into the core of the storm.
The problem is that if these air molecules were to accumulate in the center of the storm, their weight would cause the sea-level air pressure to rise. This would weaken the surface low pressure, which would reduce the radial pressure gradient near sea level, causing the inflow winds and waves to diminish. With reducing inflow, the eyewall thunderstorms would run out of fuel and die, causing the tropical cyclone to disintegrate in half a day or so.
However, we know that tropical cyclones can exist for weeks. Thus, there must be some other mechanism that removes air from the tropical cyclone core as fast as it enters. That other mechanism is the strong outflow winds in the thunderstorm anvils at the top of the eyewall. This outflow exists because of high pressure at the top of the troposphere in the eye and eyewall regions (Figs. 16.26 & 16.27), which drives winds outward down the pressure gradient.
But what causes this high pressure aloft? We already discussed a non-hydrostatic process — the air deposited aloft from eyewall thunderstorm updrafts. But another process is hydrostatic — related to the excessive warmth of the center or core portion of the tropical cyclone.
16.5.3. Warm Core
Air rises moist adiabatically in the eyewall thunderstorms, releasing a lot of latent heat along the way. But then after losing water due to precipitation from the eyewall, some of the air warms as it descends dry adiabatically in the eye. Thus, the core (both the eye and the eye wall) of the tropical cyclone has much warmer temperature than the ambient air outside the storm.
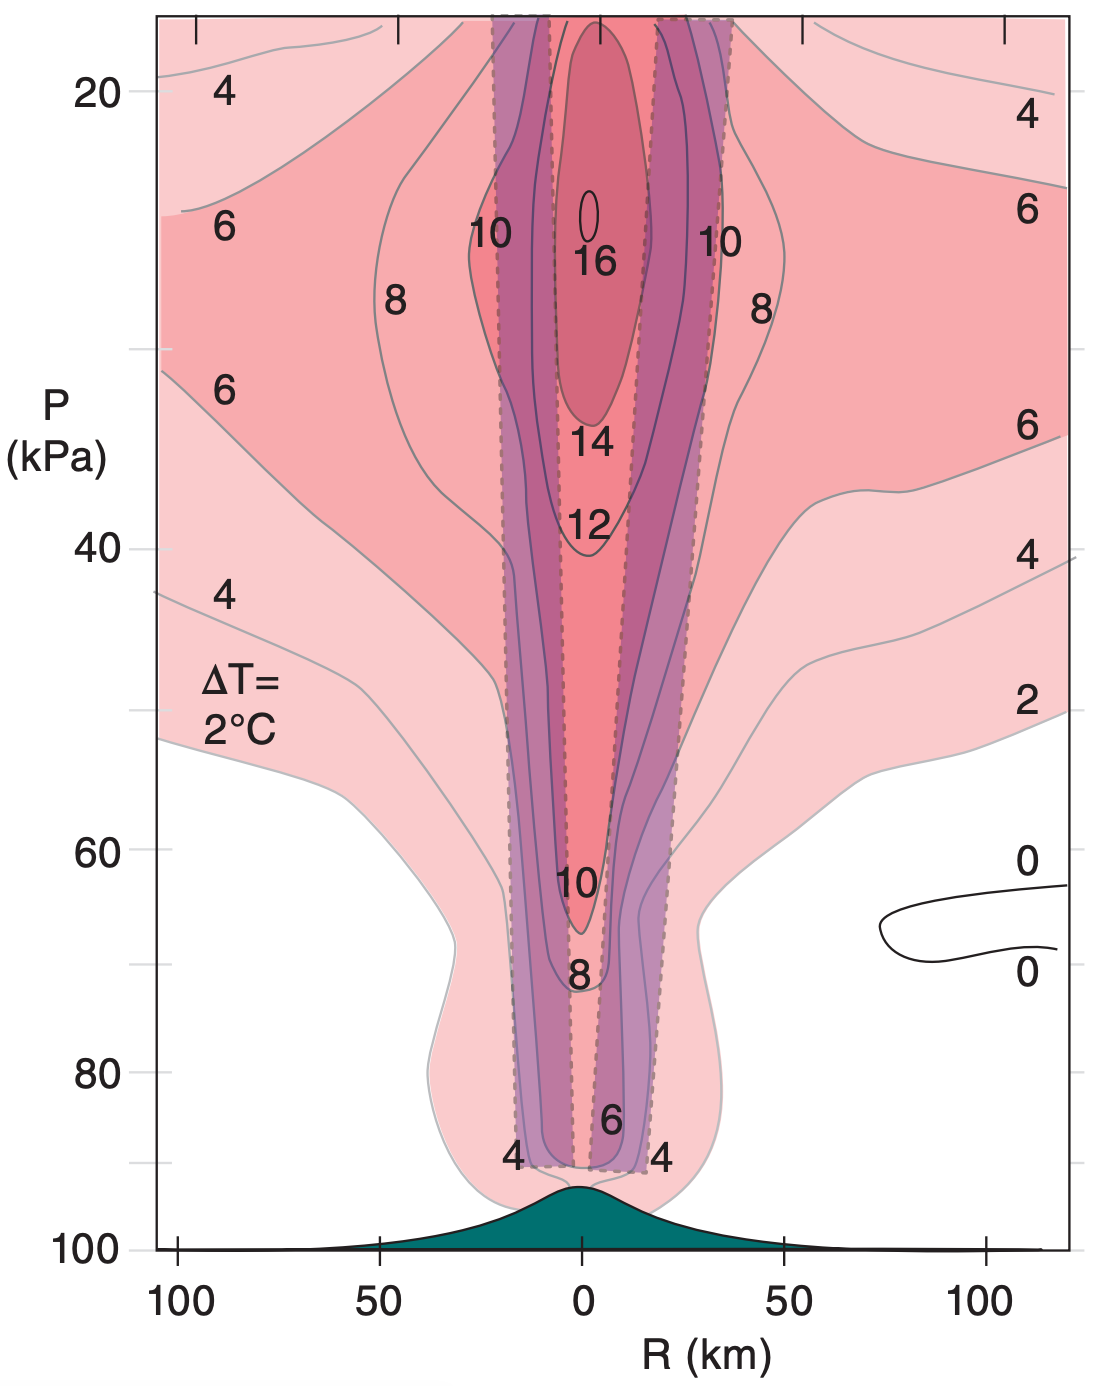
Typical temperature excesses of the warm core are 0 to 4°C near sea level, and 10 to 16°C warmer at 12 to 16 km altitude (Fig. 16.28). An INFO box illustrates such a warm-core system.
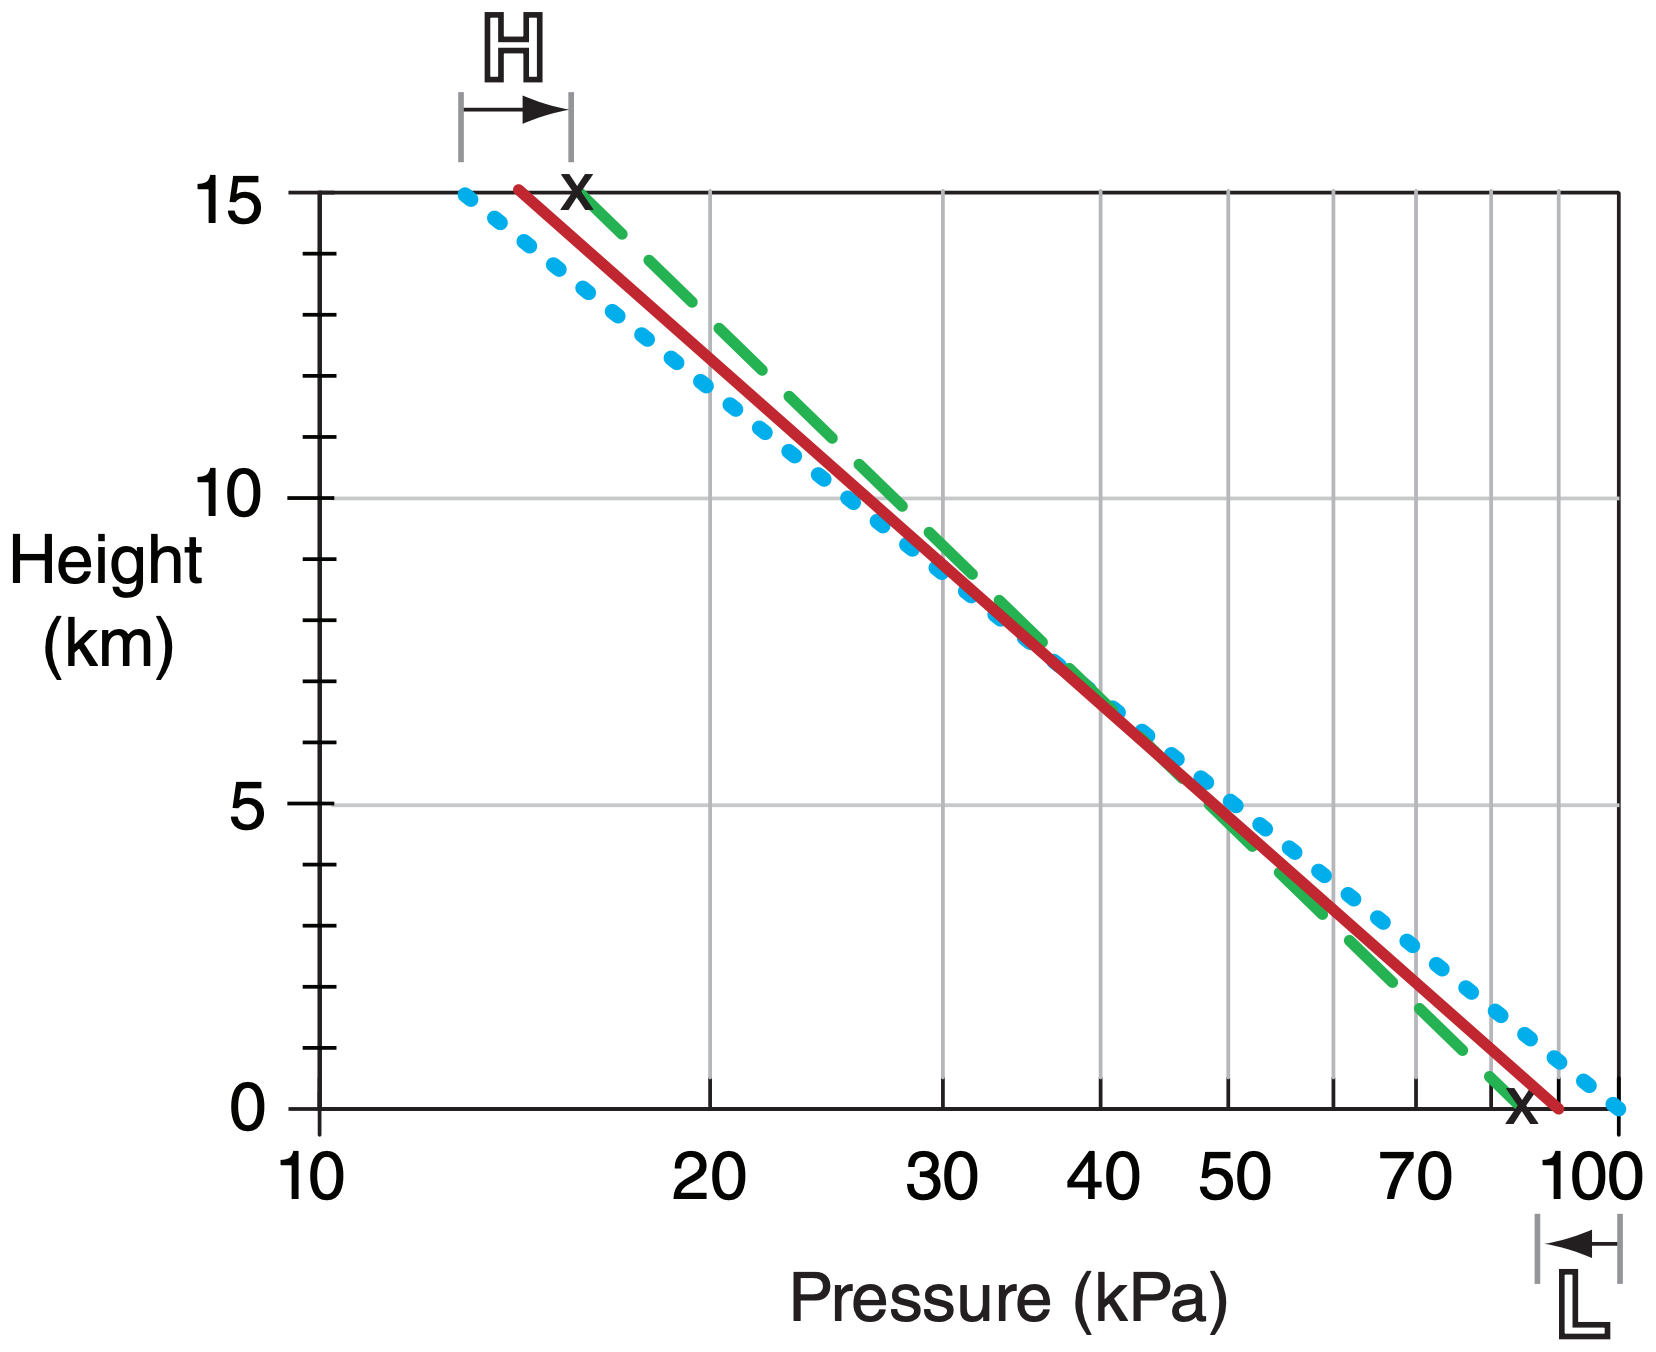
This radial temperature gradient (warm core vs. cool exterior) causes a radial pressure-gradient reversal with increasing altitude (Fig. 16.29), as is explained by the thermal-wind expression. To determine this pressure gradient, define the sea-level pressure in the eye as PB eye , and that of the distant surroundings at sea level as PB ∞. Near the top of the tropical cyclone, define the core pressure as PT eye and that of its distant surroundings as PT ∞ at the same altitude. Subscripts B and T denote bottom and top of the troposphere.
Suppose a tropical cyclone is approximately zmax ≈ 15 km deep, has a temperature in the eye averaged over the whole tropical cyclone depth of \(\overline{T_{e y e}}\) = 273 K, and has ambient surface pressure distant from the storm of PB ∞ = 101.3 kPa. The pressure difference at the top of the tropical cyclone (∆PT = PT ∞ – PT eye) is approximately related to the pressure difference at the bottom (∆PB = PB ∞ – PB eye) by:
\(\ \begin{align} \Delta P_{T} \approx a \cdot \Delta P_{B}-b \cdot \Delta T\tag{16.5}\end{align}\)
where a ≈ 0.15 (dimensionless), b ≈ 0.7 kPa K–1, and ∆T = Teye – T∞ is the temperature difference averaged over the troposphere. Note that ∆PT is negative.
Next, consider the tangential winds. These winds spiral cyclonically around the eye at low altitudes, but spiral anticyclonically near the top of the troposphere well away from the eye. Hence, the tangential velocity must decrease with altitude and eventually change sign. The ideal gas law can be used with the gradient wind eq. (16.3) to show how tangential wind component Mtan varies with altitude z :
\(\ \begin{align} \left(\dfrac{2 \cdot M_{\tan }}{R}+f_{c}\right) \cdot \dfrac{\Delta M_{\tan }}{\Delta z}=\dfrac{|g|}{\bar{T}} \cdot \dfrac{\Delta T}{\Delta R}\tag{16.6}\end{align}\)
where T is absolute temperature, and the overbar denotes an average over depth. Eqs. (16.5 & 16.6 are overly simplistic because they ignore nonhydrostatic and non-equilibrium effects.
Sample Application
The surface pressure in the eye of a tropical cyclone is 90 kPa, while the surrounding pressure is 100 kPa. If the core is 10 K warmer than the surroundings, find the pressure difference at the top of the tropical cyclone between the eye and surroundings.
Find the Answer
Given: ∆PB =100 – 90 = 10 kPa, ∆T = 10 K
Find: ∆PT = ? kPa
Use eq. (16.5): ∆PT = (0.15)·(10kPa) – (0.7kPa K–1)·(10K) = – 5.5 kPa
Check: Units OK. Physics OK.
Exposition: This answer is negative, meaning that the eye has higher pressure than the surroundings, aloft. This pressure reversal drives the outflow aloft.
For a cyclone to survive and intensify, air must be constantly withdrawn from the top. This removal of air mass from the cyclone center (core) counteracts the inflow of boundary-layer air at the bottom, which always happens due to surface drag. The net result of storm-top outflow is storm-bottom low pressure in the core, which drives the near-surface winds.
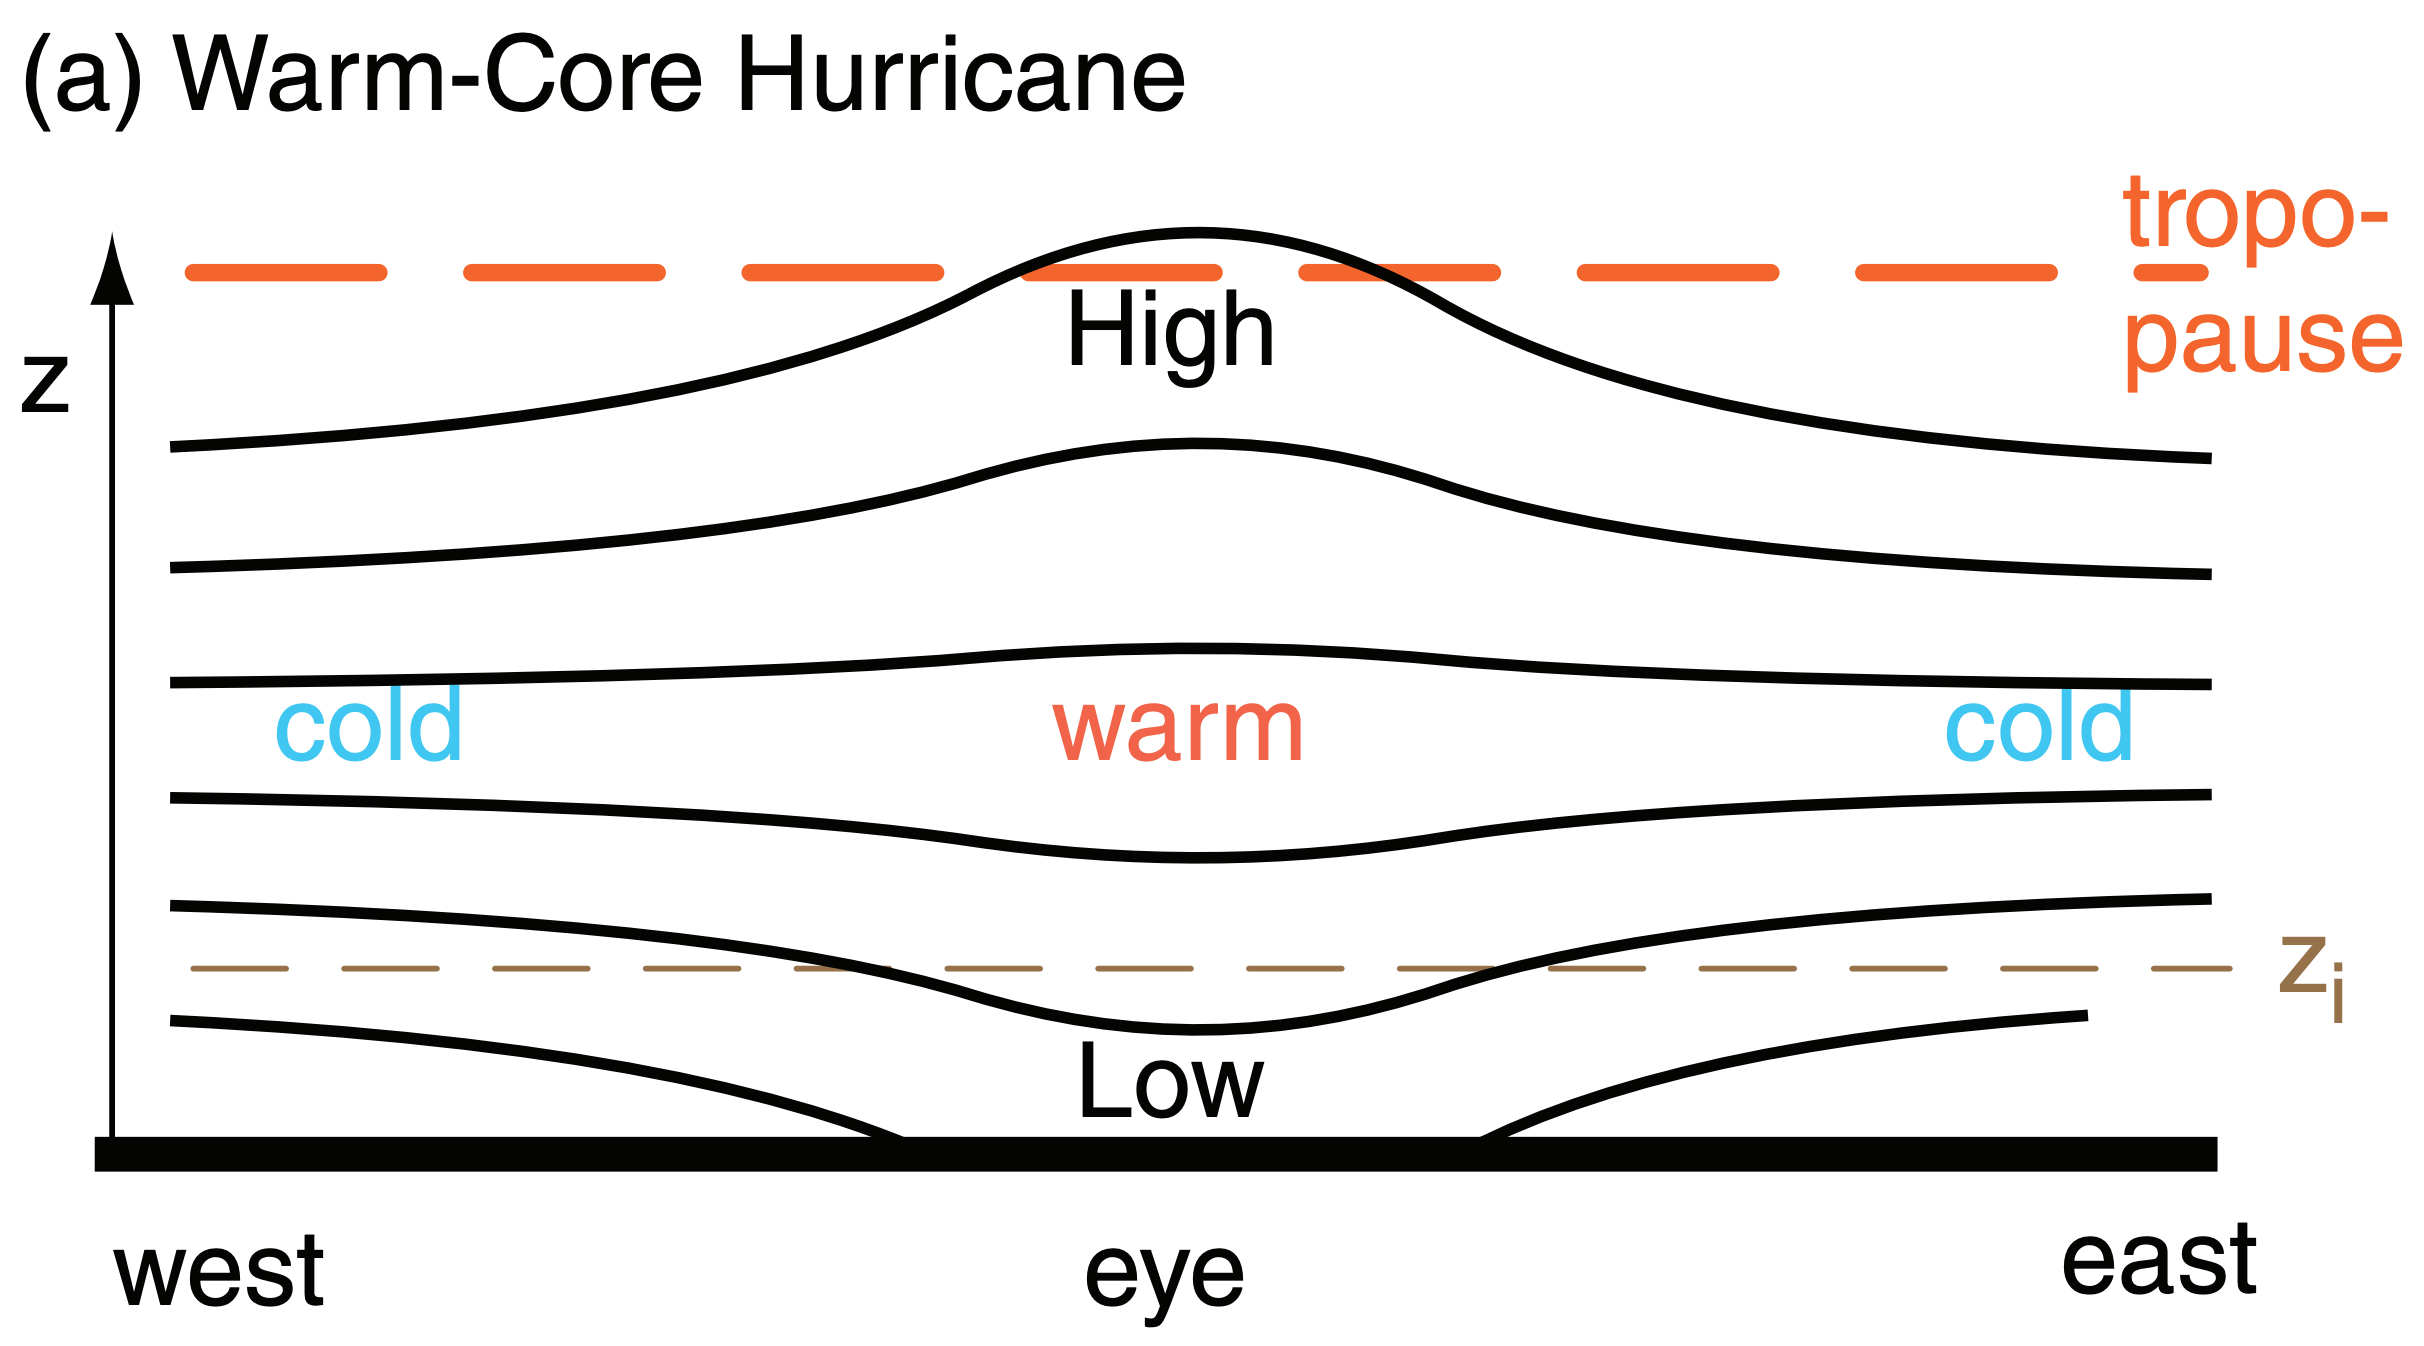
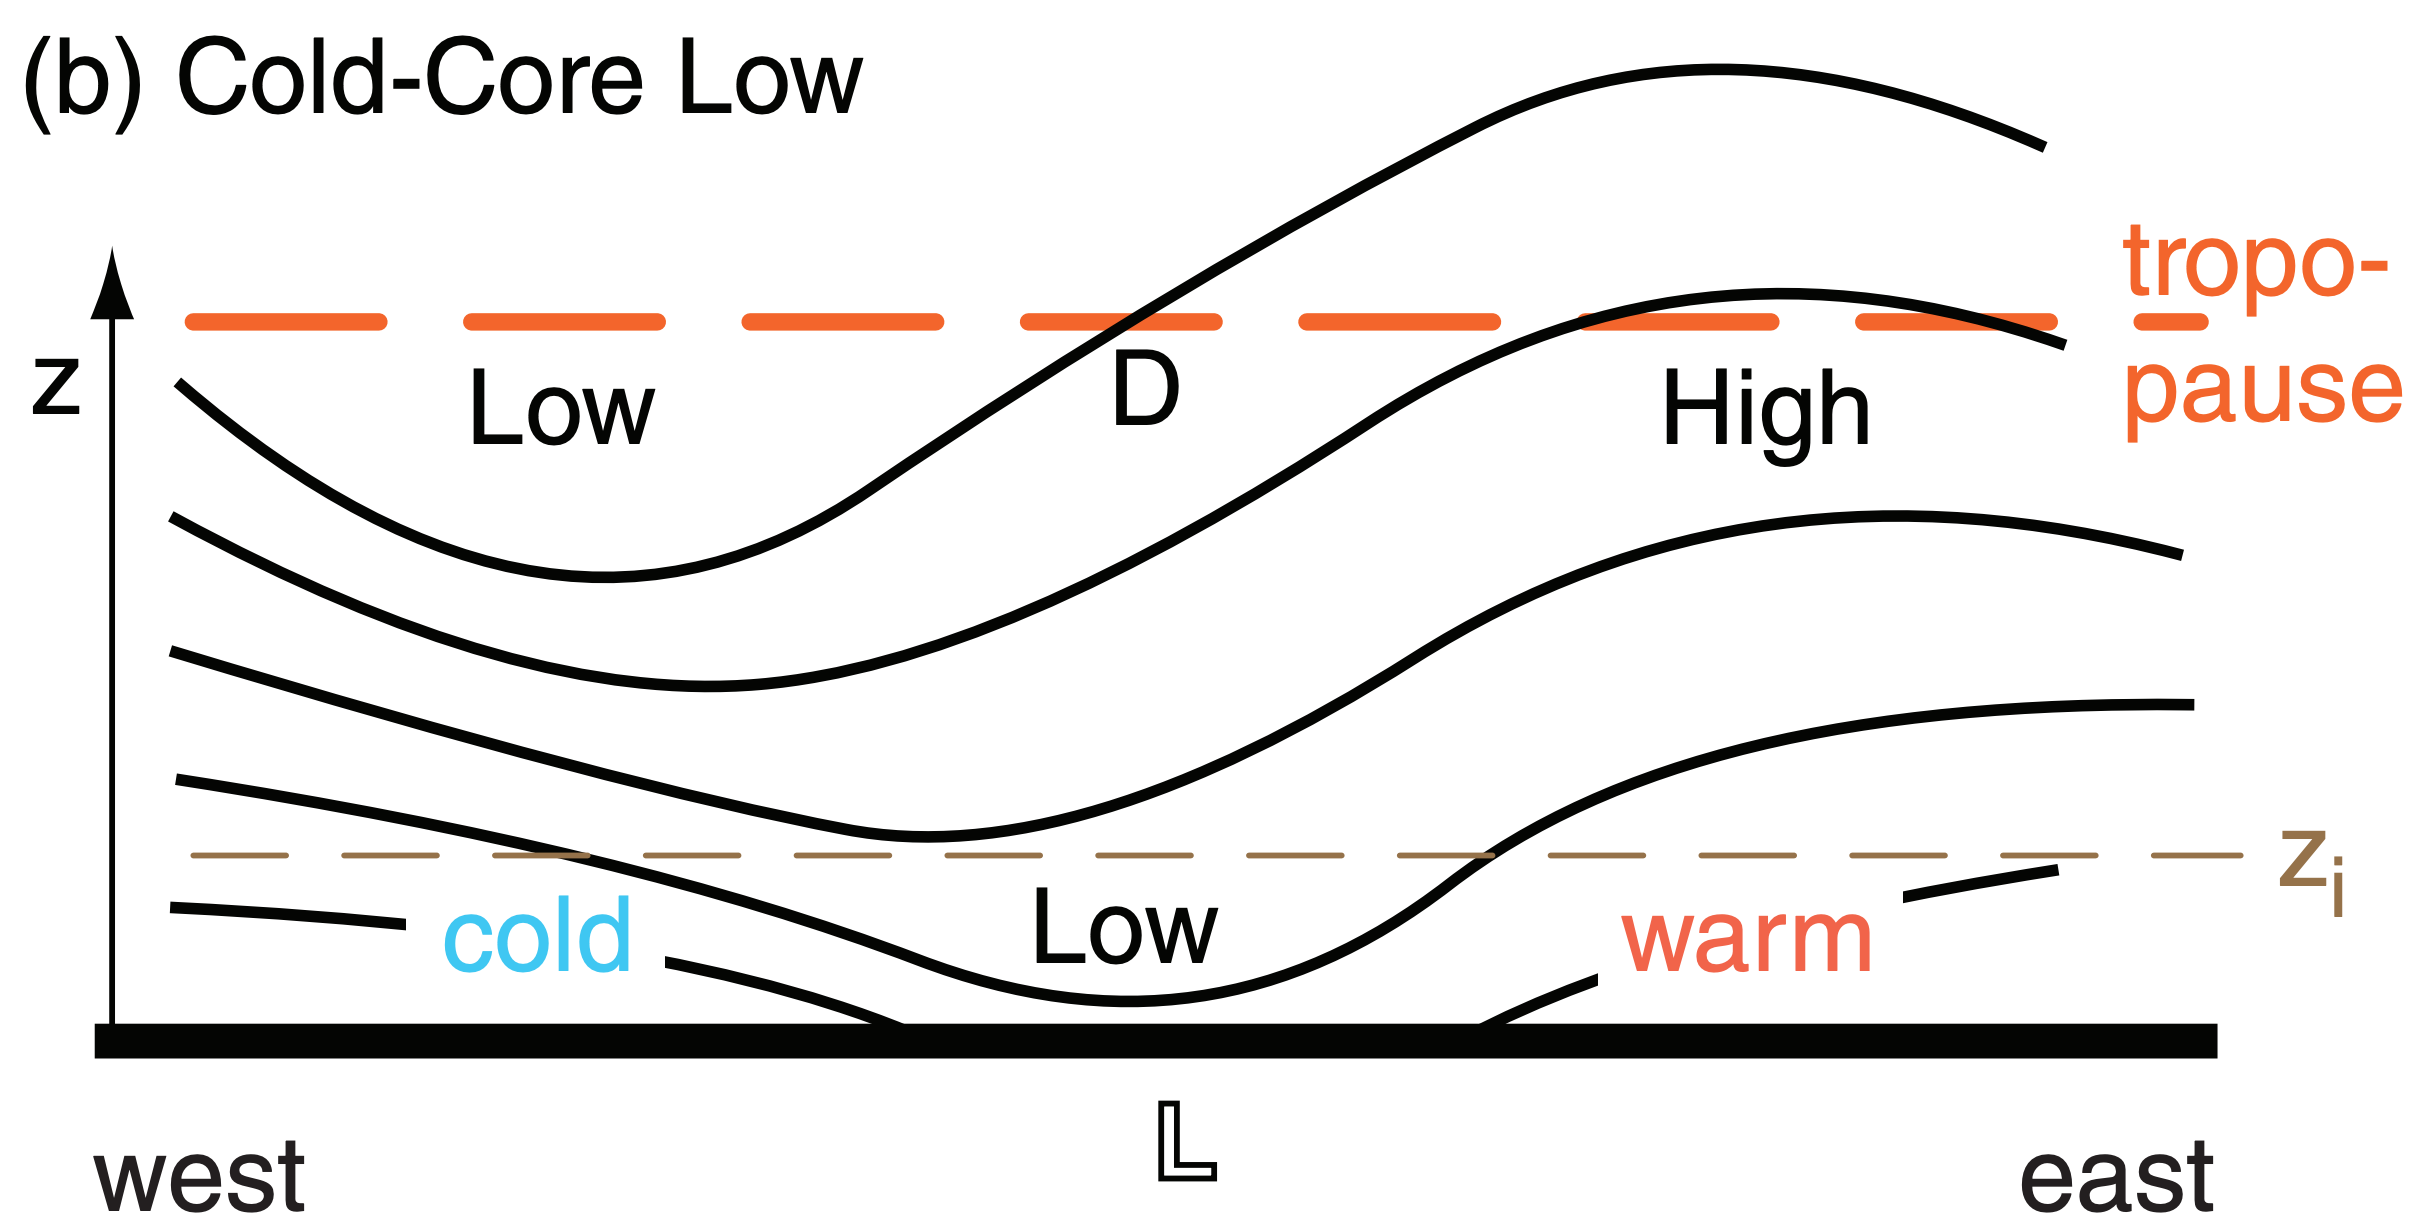
Warm-core cyclones (e.g., tropical cyclones) and cold-core cyclones (e.g., extratropical lows) differ in the way they cause horizontal divergence to remove air from the top of the cyclones [see Fig. 16.c, parts (a) and (b)].
Tropical cyclones are vertically stacked, with the storm-top eye of the tropical cyclone almost directly above the storm-bottom eye [Fig. 16.c(a)]. Intense latent heating in the tropical cyclone warms the whole depth of the troposphere near the core, causing high pressure aloft because warm layers of air have greater thickness than cold. This high pressure aloft causes air to diverge horizontally at the top of the tropical cyclone, which is why visible and IR satellite loops show cirrus and other high clouds flowing away from the tropical cyclone center.
Extratropical lows are not vertically stacked, but have low pressure that tilts westward with increasing height [Fig 16.c(b)]. As the surface circulation around the cyclone advects in cold, polar, boundary-layer air on the west side of the cyclone, the small thicknesses in that sector cause pressure to decrease more rapidly with height. The net result is an upper-level trough west of, and a ridge east of, the surface low. A jet stream meandering through this trough-ridge system would cause horizontal divergence (D), as was shown in the Extratropical Cyclone chapter.
Sample Application
Suppose at a radius of 40 km the tangential velocity decreases from 50 m s–1 at the surface to 10 m s–1 at 10 km altitude. Find the radial temperature gradient at a latitude where the Coriolis parameter is 0.00005 s–1. Assume |g|/T = 0.0333 m·s–2·K–1.
Find the Answer
Given: R = 40 km, Mtan = 50 m s–1 at z = 0, Mtan = 10 m s–1 at z = 10 km, fc = 0.00005 s–1 , |g|/T = 0.0333 m·s–2·K–1
Find: ∆T/∆R = ? K km–1
Use eq. (16.6):
\(\begin{aligned} \dfrac{|g|}{\bar{T}} \cdot \dfrac{\Delta T}{\Delta R} &=\left(\dfrac{2 \cdot(30 \mathrm{m} / \mathrm{s})}{40,000 \mathrm{m}}+0.00005 \mathrm{s}^{-1}\right) \cdot \dfrac{(10-50 \mathrm{m} / \mathrm{s})}{(10,000 \mathrm{m})} =-6.2 \times 10^{-6} \mathrm{s}^{-2} \end{aligned}\)
Thus,
\(\dfrac{\Delta T}{\Delta R}=\dfrac{-6.2 \times 10^{-6} s^{-2}}{0.0333 m \cdot s^{-2} \cdot K^{-1}}=\underline{\mathbf{-0.19 K k m}^{-1}}\)
Check: Units OK. Physics OK.
Exposition: From the center of the eye, the temperature decreases about 7.4 K at a radius of 40 km, for this example. Indeed, the core is warm.
Derivation of eq. (16.5):
Use the hypsometric equation to relate the pressure at the top of the tropical cyclone eye to the pressure at the bottom of the eye. Do the same for the surroundings. Use those equations to find the pressure difference at the top:
\(\Delta P_{T}=P_{B \infty} \cdot \exp \left[-|g| \cdot z_{\max } /\left(\mathfrak{R} \cdot \bar{T}_{\infty}\right)\right]-P_{B. e y e} \cdot \exp \left[-|g| \cdot z_{\max } /\left(\mathfrak{R} \cdot \bar{T}_{e y e}\right)\right]\)
Then, using PB.eye = PB ∞ – ∆PB , collecting the exponential terms that are multiplied by PB ∞ , and finally using a first-order series approximation for those exponentials, one gets eq. (16.5), where
\(a=\exp \left[-|g| \cdot z_{\max } /\left(\mathfrak{R} \cdot \bar{T}_{e y e}\right)\right] \approx 0.15\)
\(b=-\left(|g| \cdot z_{\max } \cdot P_{B \infty}\right) /\left(\mathfrak{R} \cdot \bar{T}_{e y e} \cdot \bar{T}_{\infty}\right) \approx 0.7 \mathrm{kPa} \mathrm{K}^{-1}\)
|g| = 9.8 m·s–2 is gravitational acceleration magnitude, and
ℜ = 287.04 m2·s–2·K–1 is the gas constant for dry air.
Derivation of eq. (16.6):
There are 3 steps: (1) scale analysis; (2) differentiation of eq. (16.3) with respect to height z; and (3) simplification of the pressure term.
(1) Scale Analysis
Differentiate the ideal gas law P = ρ·ℜ·T with respect to z, and use the chain rule of calculus:
\(\dfrac{\partial P}{\partial z}=\rho \Re \dfrac{\partial T}{\partial z}+\mathfrak{R} T \dfrac{\partial \rho}{\partial z}\)
Then divide this eq. by P use the ideal gas law on the right side:
\(\dfrac{1}{P} \dfrac{\partial P}{\partial z}=\dfrac{1}{T} \dfrac{\partial T}{\partial z}+\dfrac{1}{\rho} \dfrac{\partial \rho}{\partial z}\)
Between z = 0 to 20 km, typical variations of the variables are: P = 101 to 5.5 kPa, T = 288 to 216 K, and ρ = 1.23 to 0.088 kg m–3 . Thus, the temperature term in the eq. above varies only 1/4 as much as the other two terms. Based on this scale analysis, we can neglect the temperature term, which leaves:
\(\ \begin{align} \dfrac{1}{P} \dfrac{\partial P}{\partial z} \approx \dfrac{1}{\rho} \dfrac{\partial \rho}{\partial z}\tag{a}\end{align}\)
(2) Differentiate eq. (16.3) with respect to z:
\(\dfrac{\partial}{\partial z}\left[\dfrac{1}{\rho} \dfrac{\partial P}{\partial R}\right]=f_{c} \cdot \dfrac{\partial M_{\tan }}{\partial z}+\dfrac{2 M_{\tan }}{R} \cdot \dfrac{\partial M_{\tan }}{\partial z}\)
Upon switching the left and right sides:
\(\ \begin{align} \left[\dfrac{2 M_{\tan }}{R}+f_{c}\right] \cdot \dfrac{\partial M_{\tan }}{\partial z}=\dfrac{\partial}{\partial z}\left[\dfrac{1}{\rho} \dfrac{\partial P}{\partial R}\right]\tag{b}\end{align}\)
(3) Simplify the pressure term:
First, use the chain rule:
\(\dfrac{\partial}{\partial z}\left[\dfrac{1}{\rho} \dfrac{\partial P}{\partial R}\right]=\dfrac{1}{\rho} \cdot \dfrac{\partial}{\partial z}\left[\dfrac{\partial P}{\partial R}\right]+\dfrac{\partial P}{\partial R} \cdot \dfrac{\partial}{\partial z}\left[\rho^{-1}\right]\)
R and z are independent, allowing the order of differentiation to be reversed in the first term on the RHS:
\(\dfrac{\partial}{\partial z}\left[\dfrac{1}{\rho} \dfrac{\partial P}{\partial R}\right]=\dfrac{1}{\rho} \cdot \dfrac{\partial}{\partial R}\left[\dfrac{\partial P}{\partial z}\right]-\dfrac{1}{\rho^{2}} \dfrac{\partial P}{\partial R} \cdot \dfrac{\partial \rho}{\partial z}\)
Use the hydrostatic eq. ∂P/∂z = –ρ·|g| in the first term on the RHS:
\(\dfrac{\partial}{\partial z}\left[\dfrac{1}{\rho} \dfrac{\partial P}{\partial R}\right]=\dfrac{1}{\rho} \cdot \dfrac{\partial}{\partial R}[-\rho \cdot|g|]-\dfrac{1}{\rho} \dfrac{\partial P}{\partial R} \cdot \dfrac{1}{\rho} \dfrac{\partial \rho}{\partial z}\)
But |g| is constant. Also, substitute (a) in the last term:
\(\dfrac{\partial}{\partial z}\left[\dfrac{1}{\rho} \dfrac{\partial P}{\partial R}\right]=-\dfrac{|g|}{\rho} \cdot \dfrac{\partial \rho}{\partial R}-\dfrac{1}{\rho} \dfrac{\partial P}{\partial R} \cdot \dfrac{1}{P} \dfrac{\partial P}{\partial z}\)
Substitute the ideal gas law in the first term on the RHS:
\(\dfrac{\partial}{\partial z}\left[\dfrac{1}{\rho} \dfrac{\partial P}{\partial R}\right]=-\dfrac{|g|}{\rho \cdot \mathfrak{R}} \cdot \dfrac{\partial\left(P \cdot T^{-1}\right)}{\partial R}-\dfrac{1}{P} \dfrac{\partial P}{\partial R} \cdot \dfrac{1}{\rho} \dfrac{\partial P}{\partial z}\)
Use the chain rule on the first term on the right, and substitute the hydrostatic eq. in the last term:
\(\dfrac{\partial}{\partial z}\left[\dfrac{1}{\rho} \dfrac{\partial P}{\partial R}\right]=-\dfrac{P \cdot|g|}{\rho \cdot \Re} \cdot \dfrac{\partial\left(T^{-1}\right)}{\partial R}-\dfrac{|g|}{\rho \cdot \mathfrak{R} \cdot T} \cdot \dfrac{\partial P}{\partial R}+\dfrac{|g|}{P} \dfrac{\partial P}{\partial R}\)
Substitute the ideal gas law in the 2nd term on the right:
\(\dfrac{\partial}{\partial z}\left[\dfrac{1}{\rho} \dfrac{\partial P}{\partial R}\right]=\dfrac{P \cdot|g|}{\rho \cdot \mathfrak{R} \cdot T^{2}} \cdot \dfrac{\partial T}{\partial R}-\dfrac{|g|}{P} \cdot \dfrac{\partial P}{\partial R}+\dfrac{|g|}{P} \dfrac{\partial P}{\partial R}\)
But the last two terms cancel. Using the ideal gas law in the remaining term leaves:
\(\ \begin{align} \dfrac{\partial}{\partial z}\left[\dfrac{1}{\rho} \dfrac{\partial P}{\partial R}\right]=\dfrac{|g|}{T} \cdot \dfrac{\partial T}{\partial R}\tag{c}\end{align}\)
(4) Completion:
Finally, equate (b) and (c):
\(\ \begin{align} \left[\dfrac{2 M_{\tan }}{R}+f_{c}\right] \cdot \dfrac{\partial M_{\tan }}{\partial z}=\dfrac{|g|}{T} \cdot \dfrac{\partial T}{\partial R}\tag{16.6}\end{align}\)
which is the desired answer, when converted from derivatives to finite differences.
16.5.4. Carnot-cycle Heat Engine
Tropical cyclones are analogous to Carnot heat engines in that they convert thermal energy into mechanical energy. One measure of the energy involved is the total entropy s per unit mass of air:
\(\ \begin{align} s=C_{p} \cdot \ln \left(\dfrac{T}{T_{o}}\right)+\dfrac{L_{v} \cdot r}{T}-\mathfrak{R} \cdot \ln \left(\dfrac{P}{P_{o}}\right)\tag{16.7}\end{align}\)
where Cp = 1004 J·kg–1·K–1 is the specific heat of air at constant pressure, T is absolute temperature, Lv = 2500 J gwater vapor –1 is the latent heat of vaporization, r is mixing ratio, ℜ = 287 J·kg–1·K–1 is the gaslaw constant, P is pressure. To = 273 K and Po = 100 kPa are arbitrary reference values.
| Table 16-5. Example of thermodynamic states within a tropical cyclone, corresponding to the points (Pt) circled in Fig. 16.30. Reference: To = 273 K, Po = 100 kPa. | |||||
| Pt | P (kPa) | T (°C) | Td (°C) | r (g/kg) | s [J/(K·kg)] |
|---|---|---|---|---|---|
| 1 | 100 | 28 | –70 | ≈ 0 | 98 |
| 2 | 90 | 28 | 28 | 28 | 361 |
| 3 | 25 | –18 | –18 | 3.7 | 366 |
| 4 | 20 | –83 | –83 | ≈ 0 | 98 |
A thermo diagram is used to illustrate tropical cyclone thermodynamics (Fig. 16.30). Because of limitations in range and accuracy of thermo diagrams, you might find slightly different answers than those given in Table 16-5. For simplicity, assume constant sea surface temperature of TSST = 28°C.
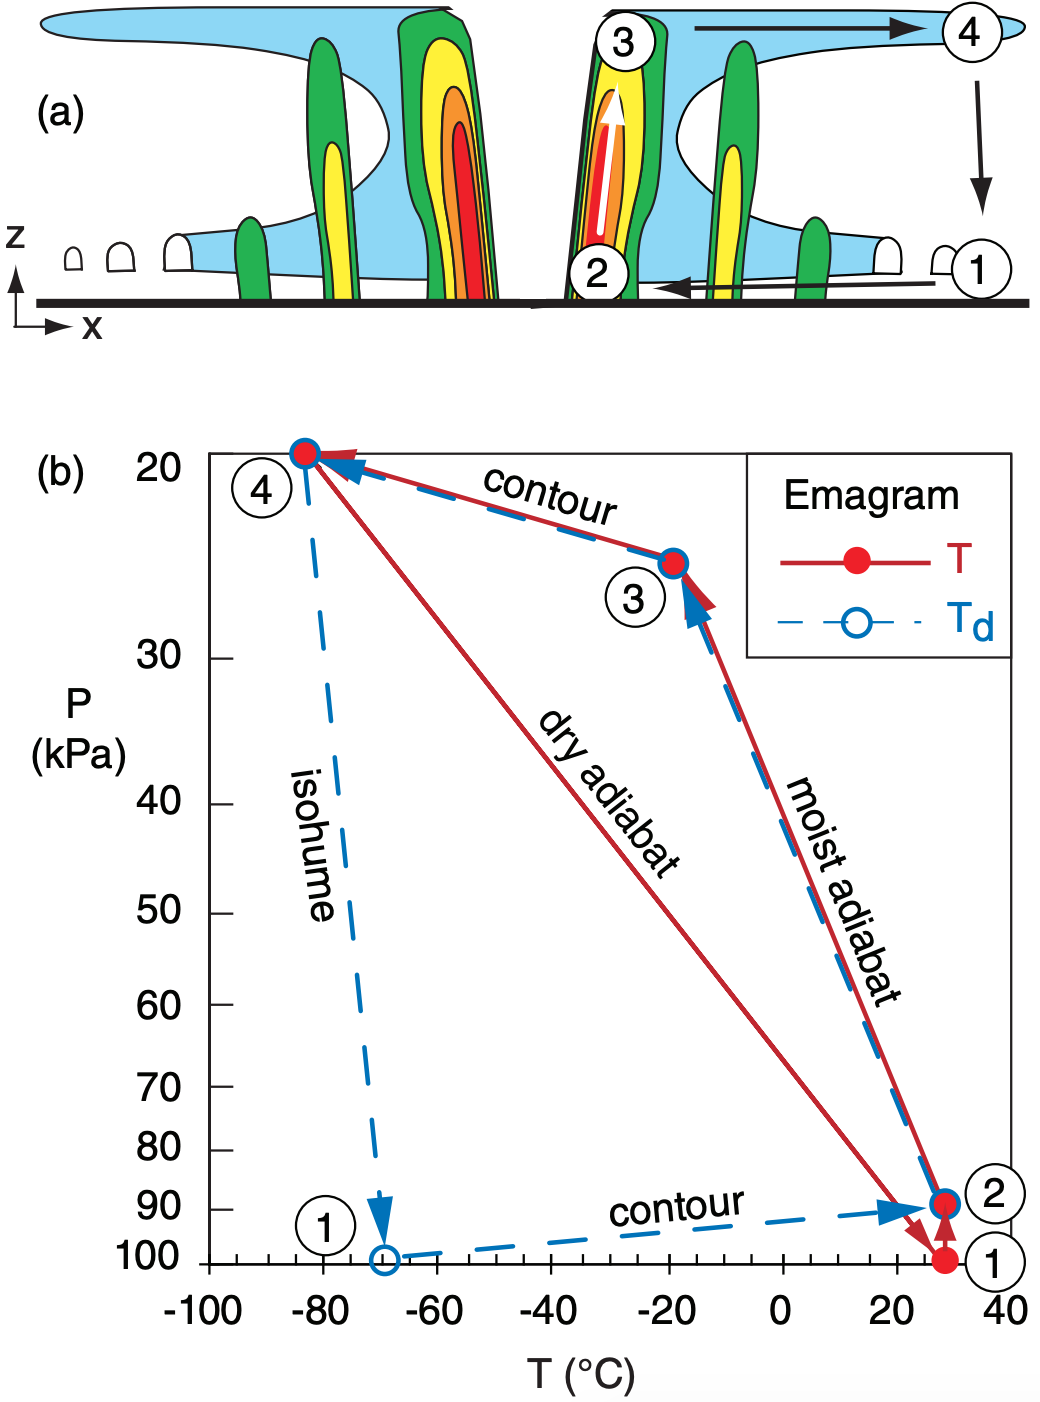
As an initial condition at Point 1 in Fig. 16.30, consider relatively warm (T = 28°C) dry air (r ≈ 0, Td = –70°C) in the boundary layer (z = 0; P = 100 kPa), but outside of the tropical cyclone. Using eq. (16.7), the initial entropy is s1 ≈ 98 J·kg–1·K–1.
In the first part of the tropical cyclone’s Carnot cycle, air in the boundary layer spirals in from Point 1 toward the eye wall of the tropical cyclone (Point 2) isothermally (T = 28°C, because of heat transfer with the sea surface) at constant height (z = 0 = sea level). Pressure decreases to P = 90 kPa as the air approaches the low-pressure eye. Evaporation from the sea surface increases the mixing ratio to saturation (r ≈ 28 g kg–1, Td ≈ 28°C), thereby causing entropy to increase to s2 ≈ 361 J·kg–1·K–1. This evaporation is the major source of energy for the storm.
From Point 2, air rises moist adiabatically to Point 3 in the thunderstorms of the eye wall. The moist-adiabatic process conserves entropy (s3 = 366 J·kg–1·K–1 , within the accuracy of the thermo diagram, thus s2 ≈ s3). During this process, temperature drops to T ≈ –18°C and mixing ratio decreases to about r ≈ 3.7 g kg–1. However, the decrease of pressure (P = 90 to 25 kPa) in this rising air compensates to maintain nearly constant entropy.
Once the cloudy air reaches the top of the troposphere at Point 3, it flows outward to Point 4 at roughly constant altitude. (Note that, the thermo diagrams at the end of the Atmospheric Stability chapter do not go high enough to simulate a real tropical cyclone of 15 km depth, so we will use z ≈ 10 km here.) The divergence of air is driven by a pressure gradient of P = 25 kPa in the eye to 20 kPa outside the tropical cyclone.
During this high-altitude outflow from Points 3 to 4, air rapidly loses heat due to infrared radiation, causing its temperature to decrease from T = Td = –18°C to – 83°C. The air remains saturated, and mixing ratio decreases from r ≈ 3.7 to near 0. The cooling also converts more water vapor into precipitation. Entropy drops to 98 J·kg–1·K–1.
Finally, the air subsides dry adiabatically from Points 4 to 1, with no change of mixing ratio (r ≈ 0; Td ≈ –70°C). Temperature increases adiabatically to T = 28°C, due to compression as the air descends into higher pressure (P = 100 kPa). This dry adiabatic process also preserves entropy, and thus is called an isentropic process (and dry adiabats are also known as isentropes). The final state of the air is identical to the initial state, at Point 1 in Fig. 16.30.
This Carnot process is a closed cycle – the air can recirculate through the tropical cyclone. However, during this cycle, entropy is gained near the sea surface where the temperature is warm, while it is lost near cloud top where temperatures are colder.
The gain of entropy at one temperature and loss at a different temperature allows the Carnot engine to produce mechanical energy ME according to
\(\ \begin{align} M E=\left(T_{B}-T_{T . a v g}\right) \cdot\left(s_{e y e w a l l}-s_{\infty}\right)_{B}\tag{16.8}\end{align}\)
where subscripts B and T denote bottom and top of the troposphere, eyewall denotes boundary-layer air under the eye wall, and ∞ denotes the ambient conditions at large distances from the tropical cyclone (e.g., P∞ ≈ 101.3 kPa). This mechanical energy drives the tropical cyclone-force winds, ocean waves, atmospheric waves, and causes mixing of both the atmosphere and ocean against buoyant forces.
If all of the mechanical energy were consumed trying to maintain the tropical cyclone-force winds against the frictional drag in the boundary layer (an unrealistic assumption), then the tropical cyclone could support the following maximum pressure ratio at the surface:
\(\ \begin{align} \ln \left(\dfrac{P_{\infty}}{P_{e y e}}\right)_{B}=\dfrac{M E}{T_{B} \cdot \Re}\tag{16.9}\end{align}\)
Sample Application
Suppose air in the eye of a tropical cyclone has the following thermodynamic state: P = 70 kPa, r = 1 g kg–1, T = 15°C. Find the entropy.
Find the Answer
Given: P = 70 kPa, r = 1 g kg–1, T = 288 K.
Find: s = ? J·kg–1·K–1
Use eq. (16.7):
\(s=\left(1004 \dfrac{J}{k g_{a i r} \cdot K}\right) \cdot \ln \left(\dfrac{288 K}{273 K}\right)+
\left(2500 \dfrac{J}{g_{\text {water}}}\right) \cdot\left(1 \dfrac{g_{\text {water}}}{k_{\text {gair}}}\right) \dfrac{1}{288 \mathrm{K}}
-\left(287 \dfrac{J}{k_{\text {gair}} \cdot K}\right) \cdot \ln \left(\dfrac{70 \mathrm{kPa}}{100 \mathrm{kPa}}\right)\)
s = 165 J·kg–1·K–1
Check: Units OK. Physics OK.
Exposition: The actual value of entropy is meaningless, because of the arbitrary constants To and Po. However, the difference between two entropies is meaningful, because the arbitrary constants cancel out.
Sample Application
Find the mechanical energy and minimum possible eye pressure that can be supported by the tropical cyclone of Table 16-5.
Find the Answer
Given: seyewall = 361 J·kg–1·K–1, s∞ = 98 J·kg–1·K–1
TB = 28°C, TT avg ≈ 0.5·(–18–83) = –50.5°C.
Find: ME = ? kJ kg–1, Peye = ? kPa
Use eq. (16.8): ME = (28 + 50.5)(K)·(361–98)(J·kg–1·K–1) = 20.6 kJ kg–1
Use eq. (16.9):
\(\ln \left(\dfrac{P_{\infty}}{P_{\text {eye}}}\right)_{B}=\dfrac{\left(20,600 \mathrm{J} \cdot \mathrm{kg}^{-1}\right)}{(301 \mathrm{K}) \cdot\left(287 \mathrm{J} \cdot \mathrm{kg}^{-1} \cdot \mathrm{K}^{-1}\right)}=0.238\)
Solving for Peye gives:
Peye =(101.3kPa)/exp(0.238) = 79.8 kPa.
Check: Units OK. Physics OK.
Exposition: This eye pressure is lower than the actual eye pressure of 90 kPa. The difference is related to the ME of winds and waves.
Another measure of tropical cyclone power is the rate of dissipation of kinetic energy by wind drag against the sea surface. This is proportional to the ABL wind speed cubed, times the sea-surface area over which that speed is valid, summed over all areas under the tropical cyclone. K. A. Emanuel (1999, Weather, 54, 107-108) estimates dissipation rates of 3 x 10¹² W for a Category 3 Atlantic hurricane (with max winds of 50 m s–1 at radius 30 km), and 3 x 10¹³ W for a Pacific typhoon (with max winds of 80 m s–1 at radius 50 km).