
19.2: Anthropogenic Climate Change
- Page ID
- 7880

\( \newcommand{\vecs}[1]{\overset { \scriptstyle \rightharpoonup} {\mathbf{#1}} } \)
\( \newcommand{\vecd}[1]{\overset{-\!-\!\rightharpoonup}{\vphantom{a}\smash {#1}}} \)
\( \newcommand{\dsum}{\displaystyle\sum\limits} \)
\( \newcommand{\dint}{\displaystyle\int\limits} \)
\( \newcommand{\dlim}{\displaystyle\lim\limits} \)
\( \newcommand{\id}{\mathrm{id}}\) \( \newcommand{\Span}{\mathrm{span}}\)
( \newcommand{\kernel}{\mathrm{null}\,}\) \( \newcommand{\range}{\mathrm{range}\,}\)
\( \newcommand{\RealPart}{\mathrm{Re}}\) \( \newcommand{\ImaginaryPart}{\mathrm{Im}}\)
\( \newcommand{\Argument}{\mathrm{Arg}}\) \( \newcommand{\norm}[1]{\| #1 \|}\)
\( \newcommand{\inner}[2]{\langle #1, #2 \rangle}\)
\( \newcommand{\Span}{\mathrm{span}}\)
\( \newcommand{\id}{\mathrm{id}}\)
\( \newcommand{\Span}{\mathrm{span}}\)
\( \newcommand{\kernel}{\mathrm{null}\,}\)
\( \newcommand{\range}{\mathrm{range}\,}\)
\( \newcommand{\RealPart}{\mathrm{Re}}\)
\( \newcommand{\ImaginaryPart}{\mathrm{Im}}\)
\( \newcommand{\Argument}{\mathrm{Arg}}\)
\( \newcommand{\norm}[1]{\| #1 \|}\)
\( \newcommand{\inner}[2]{\langle #1, #2 \rangle}\)
\( \newcommand{\Span}{\mathrm{span}}\) \( \newcommand{\AA}{\unicode[.8,0]{x212B}}\)
\( \newcommand{\vectorA}[1]{\vec{#1}} % arrow\)
\( \newcommand{\vectorAt}[1]{\vec{\text{#1}}} % arrow\)
\( \newcommand{\vectorB}[1]{\overset { \scriptstyle \rightharpoonup} {\mathbf{#1}} } \)
\( \newcommand{\vectorC}[1]{\textbf{#1}} \)
\( \newcommand{\vectorD}[1]{\overrightarrow{#1}} \)
\( \newcommand{\vectorDt}[1]{\overrightarrow{\text{#1}}} \)
\( \newcommand{\vectE}[1]{\overset{-\!-\!\rightharpoonup}{\vphantom{a}\smash{\mathbf {#1}}}} \)
\( \newcommand{\vecs}[1]{\overset { \scriptstyle \rightharpoonup} {\mathbf{#1}} } \)
\(\newcommand{\longvect}{\overrightarrow}\)
\( \newcommand{\vecd}[1]{\overset{-\!-\!\rightharpoonup}{\vphantom{a}\smash {#1}}} \)
\(\newcommand{\avec}{\mathbf a}\) \(\newcommand{\bvec}{\mathbf b}\) \(\newcommand{\cvec}{\mathbf c}\) \(\newcommand{\dvec}{\mathbf d}\) \(\newcommand{\dtil}{\widetilde{\mathbf d}}\) \(\newcommand{\evec}{\mathbf e}\) \(\newcommand{\fvec}{\mathbf f}\) \(\newcommand{\nvec}{\mathbf n}\) \(\newcommand{\pvec}{\mathbf p}\) \(\newcommand{\qvec}{\mathbf q}\) \(\newcommand{\svec}{\mathbf s}\) \(\newcommand{\tvec}{\mathbf t}\) \(\newcommand{\uvec}{\mathbf u}\) \(\newcommand{\vvec}{\mathbf v}\) \(\newcommand{\wvec}{\mathbf w}\) \(\newcommand{\xvec}{\mathbf x}\) \(\newcommand{\yvec}{\mathbf y}\) \(\newcommand{\zvec}{\mathbf z}\) \(\newcommand{\rvec}{\mathbf r}\) \(\newcommand{\mvec}{\mathbf m}\) \(\newcommand{\zerovec}{\mathbf 0}\) \(\newcommand{\onevec}{\mathbf 1}\) \(\newcommand{\real}{\mathbb R}\) \(\newcommand{\twovec}[2]{\left[\begin{array}{r}#1 \\ #2 \end{array}\right]}\) \(\newcommand{\ctwovec}[2]{\left[\begin{array}{c}#1 \\ #2 \end{array}\right]}\) \(\newcommand{\threevec}[3]{\left[\begin{array}{r}#1 \\ #2 \\ #3 \end{array}\right]}\) \(\newcommand{\cthreevec}[3]{\left[\begin{array}{c}#1 \\ #2 \\ #3 \end{array}\right]}\) \(\newcommand{\fourvec}[4]{\left[\begin{array}{r}#1 \\ #2 \\ #3 \\ #4 \end{array}\right]}\) \(\newcommand{\cfourvec}[4]{\left[\begin{array}{c}#1 \\ #2 \\ #3 \\ #4 \end{array}\right]}\) \(\newcommand{\fivevec}[5]{\left[\begin{array}{r}#1 \\ #2 \\ #3 \\ #4 \\ #5 \\ \end{array}\right]}\) \(\newcommand{\cfivevec}[5]{\left[\begin{array}{c}#1 \\ #2 \\ #3 \\ #4 \\ #5 \\ \end{array}\right]}\) \(\newcommand{\mattwo}[4]{\left[\begin{array}{rr}#1 \amp #2 \\ #3 \amp #4 \\ \end{array}\right]}\) \(\newcommand{\laspan}[1]{\text{Span}\{#1\}}\) \(\newcommand{\bcal}{\cal B}\) \(\newcommand{\ccal}{\cal C}\) \(\newcommand{\scal}{\cal S}\) \(\newcommand{\wcal}{\cal W}\) \(\newcommand{\ecal}{\cal E}\) \(\newcommand{\coords}[2]{\left\{#1\right\}_{#2}}\) \(\newcommand{\gray}[1]{\color{gray}{#1}}\) \(\newcommand{\lgray}[1]{\color{lightgray}{#1}}\) \(\newcommand{\rank}{\operatorname{rank}}\) \(\newcommand{\row}{\text{Row}}\) \(\newcommand{\col}{\text{Col}}\) \(\renewcommand{\row}{\text{Row}}\) \(\newcommand{\nul}{\text{Nul}}\) \(\newcommand{\var}{\text{Var}}\) \(\newcommand{\corr}{\text{corr}}\) \(\newcommand{\len}[1]{\left|#1\right|}\) \(\newcommand{\bbar}{\overline{\bvec}}\) \(\newcommand{\bhat}{\widehat{\bvec}}\) \(\newcommand{\bperp}{\bvec^\perp}\) \(\newcommand{\xhat}{\widehat{\xvec}}\) \(\newcommand{\vhat}{\widehat{\vvec}}\) \(\newcommand{\uhat}{\widehat{\uvec}}\) \(\newcommand{\what}{\widehat{\wvec}}\) \(\newcommand{\Sighat}{\widehat{\Sigma}}\) \(\newcommand{\lt}{<}\) \(\newcommand{\gt}{>}\) \(\newcommand{\amp}{&}\) \(\definecolor{fillinmathshade}{gray}{0.9}\)When we talk about anthropogenic climate change, we are generally thinking of the industrial era, which really got going when we started using fossil fuels (coal to begin with) to drive machinery and trains. That was around the middle of the 18th century. The issue with fossil fuels is that they involve burning carbon that was naturally stored in the crust over hundreds of millions of years as part of Earth’s process of counteracting the warming Sun.
Some climate scientists argue that anthropogenic climate change actually goes back much further than the industrial era, and that humans began to impact the climate by clearing land to grow grains in Europe and the Middle East around 8,000 years BCE and by creating wetlands to grow rice in Asia around 5,000 years BCE. Clearing forests for crops is a type of climate-forcing because the CO2 storage capacity of the crops is generally lower than that of the trees they replace, and creating wetlands is a type of climate forcing because the anaerobic bacterial decay of organic matter within wetlands produces CH4.
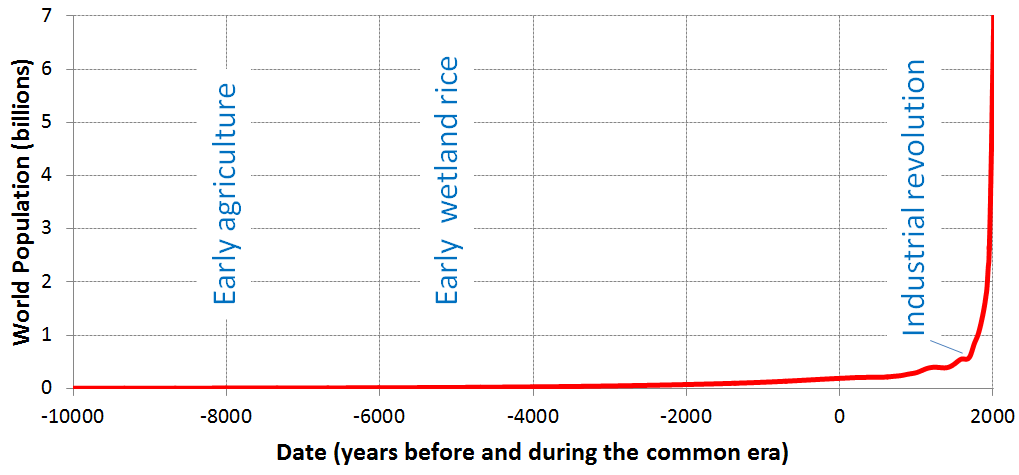
In fact, whether anthropogenic climate change started with the agricultural revolution or the industrial revolution is not important, because the really significant climate changes didn’t start until the early part of the 20th century, and although our activities are a major part of the problem, our increasing numbers are a big issue as well. Figure \(\PageIndex{1}\) shows the growth of the world population from around 5 million, when we first started growing crops, to about 18 million when wetland rice cultivation began, to over 800 million at the start of the industrial revolution, to over 7,700 million in 2019. A big part of the incredible growth in our population is related to the availability of the cheap and abundant energy embodied in fossil fuels, which we use for transportation, heating and cooling, industry, and food production. It will be hard to support a population of this size without fossil fuels, but we have to find a way to do it.
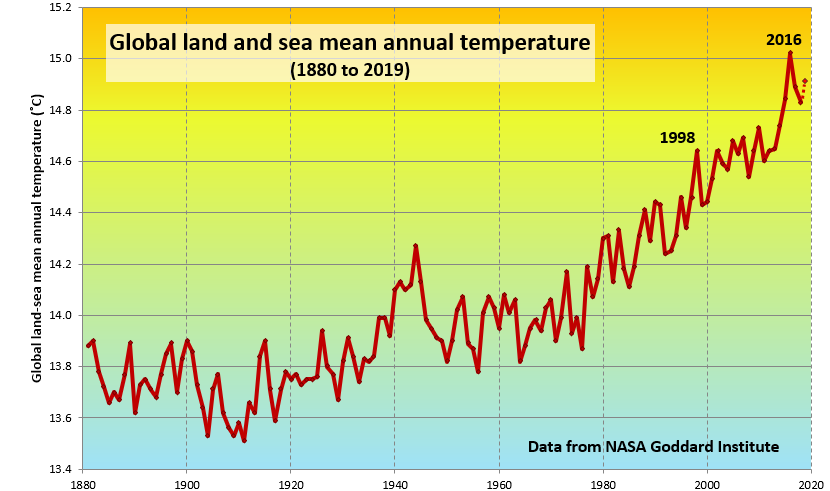
A rapidly rising population, the escalating level of industrialization and mechanization of our lives, and an increasing dependence on fossil fuels for transportation and energy generation have driven the anthropogenic climate change of the past century. The trend of mean global temperatures since 1880 is shown in Figure \(\PageIndex{2}\). For approximately the past 55 years, the temperature has increased at a relatively steady and disturbingly rapid rate, especially compared to past changes. The average temperature now is approximately 1.0°C higher than before industrialization, and two-thirds of this warming has occurred since 1975. One of the driving factors of the recent increase in the rate of climate change has been the migration of North Americans from city centres to the suburbs, and the resulting need for virtually every household to own at least one car, when previously they were able to get around on foot or public transit.
The Intergovernmental Panel on Climate Change (IPCC)—established by the United Nations in 1988—is responsible for reviewing the scientific literature on climate change and issuing periodic reports on several topics, including the scientific basis for understanding climate change, our vulnerability to observed and predicted climate changes, and what we can do to limit climate change and minimize its impacts. Figure \(\PageIndex{3}\), which is based on data from the fifth assessment report of the IPCC, issued in 2014, shows the relative contributions of various long-lasting anthropogenic GHGs to current climate forcing, based on the changes from levels that existed in 1750.
The biggest anthropogenic contributor to warming is CO2, which accounts for 56% of positive forcing. CH4 accounts for 32%, and the halocarbon gases (mostly leaked from older air-conditioning appliances that still contain CFCs) and nitrous oxide (N2O) (from burning fossils fuels) account for 6% each.
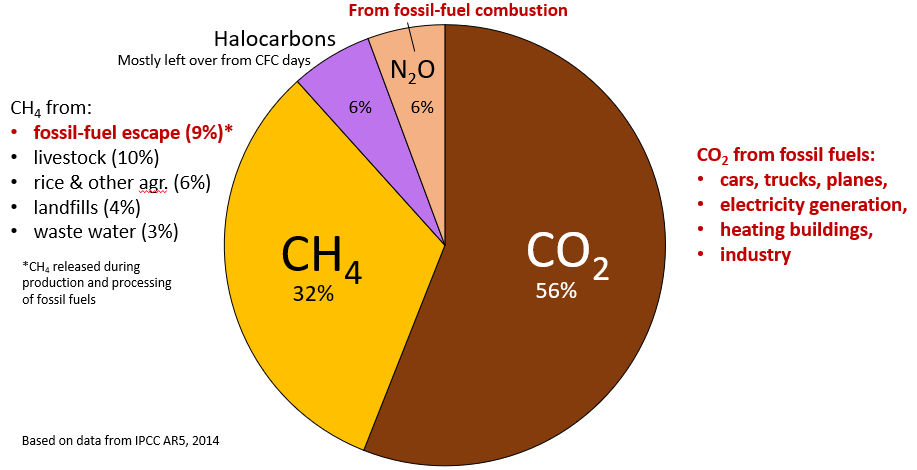
CO2 emissions come mostly from coal- and gas-fired power stations, motorized vehicles (cars, trucks, and aircraft), and industrial operations (e.g., smelting). CH4 emissions come from production of fossil fuels (escape from coal mining and from gas and oil production and processing), livestock farming (mostly beef), landfills, waste water, and wetland rice farming. N2O is derived almost entirely from the combustion of fossil fuels. In summary, most (by far) of our current GHG emissions come from fossil fuel production and use.
Figure \(\PageIndex{3}\) shows the proportions of climate forcing related to the 4 main greenhouse gases, and also includes lists of where those gases come from. The ones that are primarily derived from our use of fossil fuels are shown in red text.
Using the numbers provided in Figure \(\PageIndex{3}\) determine the percentage proportions of GHGs from the 4 main sources listed in the table below. Make sure that your percentages add to 100.
| Source | Percentage |
| Fossil fuel production and use | |
| Food production | |
| Solid and liquid wastes | |
| Halocarbons |
See Appendix 3 for Exercise 19.3 answers.
Media Attributions
- Figure \(\PageIndex{1}\): © Steven Earle. CC BY. Based on World Population Annual 12000 years data.
- Figure \(\PageIndex{2}\): © Steven Earle. CC BY. Based on data from NASA.
- Figure \(\PageIndex{3}\): © Steven Earle. CC BY. Based on data in IPCC AR 5, 2014.