38.6: Anthropogenic climate change
- Page ID
- 22833
\( \newcommand{\vecs}[1]{\overset { \scriptstyle \rightharpoonup} {\mathbf{#1}} } \)
\( \newcommand{\vecd}[1]{\overset{-\!-\!\rightharpoonup}{\vphantom{a}\smash {#1}}} \)
\( \newcommand{\id}{\mathrm{id}}\) \( \newcommand{\Span}{\mathrm{span}}\)
( \newcommand{\kernel}{\mathrm{null}\,}\) \( \newcommand{\range}{\mathrm{range}\,}\)
\( \newcommand{\RealPart}{\mathrm{Re}}\) \( \newcommand{\ImaginaryPart}{\mathrm{Im}}\)
\( \newcommand{\Argument}{\mathrm{Arg}}\) \( \newcommand{\norm}[1]{\| #1 \|}\)
\( \newcommand{\inner}[2]{\langle #1, #2 \rangle}\)
\( \newcommand{\Span}{\mathrm{span}}\)
\( \newcommand{\id}{\mathrm{id}}\)
\( \newcommand{\Span}{\mathrm{span}}\)
\( \newcommand{\kernel}{\mathrm{null}\,}\)
\( \newcommand{\range}{\mathrm{range}\,}\)
\( \newcommand{\RealPart}{\mathrm{Re}}\)
\( \newcommand{\ImaginaryPart}{\mathrm{Im}}\)
\( \newcommand{\Argument}{\mathrm{Arg}}\)
\( \newcommand{\norm}[1]{\| #1 \|}\)
\( \newcommand{\inner}[2]{\langle #1, #2 \rangle}\)
\( \newcommand{\Span}{\mathrm{span}}\) \( \newcommand{\AA}{\unicode[.8,0]{x212B}}\)
\( \newcommand{\vectorA}[1]{\vec{#1}} % arrow\)
\( \newcommand{\vectorAt}[1]{\vec{\text{#1}}} % arrow\)
\( \newcommand{\vectorB}[1]{\overset { \scriptstyle \rightharpoonup} {\mathbf{#1}} } \)
\( \newcommand{\vectorC}[1]{\textbf{#1}} \)
\( \newcommand{\vectorD}[1]{\overrightarrow{#1}} \)
\( \newcommand{\vectorDt}[1]{\overrightarrow{\text{#1}}} \)
\( \newcommand{\vectE}[1]{\overset{-\!-\!\rightharpoonup}{\vphantom{a}\smash{\mathbf {#1}}}} \)
\( \newcommand{\vecs}[1]{\overset { \scriptstyle \rightharpoonup} {\mathbf{#1}} } \)
\( \newcommand{\vecd}[1]{\overset{-\!-\!\rightharpoonup}{\vphantom{a}\smash {#1}}} \)
\(\newcommand{\avec}{\mathbf a}\) \(\newcommand{\bvec}{\mathbf b}\) \(\newcommand{\cvec}{\mathbf c}\) \(\newcommand{\dvec}{\mathbf d}\) \(\newcommand{\dtil}{\widetilde{\mathbf d}}\) \(\newcommand{\evec}{\mathbf e}\) \(\newcommand{\fvec}{\mathbf f}\) \(\newcommand{\nvec}{\mathbf n}\) \(\newcommand{\pvec}{\mathbf p}\) \(\newcommand{\qvec}{\mathbf q}\) \(\newcommand{\svec}{\mathbf s}\) \(\newcommand{\tvec}{\mathbf t}\) \(\newcommand{\uvec}{\mathbf u}\) \(\newcommand{\vvec}{\mathbf v}\) \(\newcommand{\wvec}{\mathbf w}\) \(\newcommand{\xvec}{\mathbf x}\) \(\newcommand{\yvec}{\mathbf y}\) \(\newcommand{\zvec}{\mathbf z}\) \(\newcommand{\rvec}{\mathbf r}\) \(\newcommand{\mvec}{\mathbf m}\) \(\newcommand{\zerovec}{\mathbf 0}\) \(\newcommand{\onevec}{\mathbf 1}\) \(\newcommand{\real}{\mathbb R}\) \(\newcommand{\twovec}[2]{\left[\begin{array}{r}#1 \\ #2 \end{array}\right]}\) \(\newcommand{\ctwovec}[2]{\left[\begin{array}{c}#1 \\ #2 \end{array}\right]}\) \(\newcommand{\threevec}[3]{\left[\begin{array}{r}#1 \\ #2 \\ #3 \end{array}\right]}\) \(\newcommand{\cthreevec}[3]{\left[\begin{array}{c}#1 \\ #2 \\ #3 \end{array}\right]}\) \(\newcommand{\fourvec}[4]{\left[\begin{array}{r}#1 \\ #2 \\ #3 \\ #4 \end{array}\right]}\) \(\newcommand{\cfourvec}[4]{\left[\begin{array}{c}#1 \\ #2 \\ #3 \\ #4 \end{array}\right]}\) \(\newcommand{\fivevec}[5]{\left[\begin{array}{r}#1 \\ #2 \\ #3 \\ #4 \\ #5 \\ \end{array}\right]}\) \(\newcommand{\cfivevec}[5]{\left[\begin{array}{c}#1 \\ #2 \\ #3 \\ #4 \\ #5 \\ \end{array}\right]}\) \(\newcommand{\mattwo}[4]{\left[\begin{array}{rr}#1 \amp #2 \\ #3 \amp #4 \\ \end{array}\right]}\) \(\newcommand{\laspan}[1]{\text{Span}\{#1\}}\) \(\newcommand{\bcal}{\cal B}\) \(\newcommand{\ccal}{\cal C}\) \(\newcommand{\scal}{\cal S}\) \(\newcommand{\wcal}{\cal W}\) \(\newcommand{\ecal}{\cal E}\) \(\newcommand{\coords}[2]{\left\{#1\right\}_{#2}}\) \(\newcommand{\gray}[1]{\color{gray}{#1}}\) \(\newcommand{\lgray}[1]{\color{lightgray}{#1}}\) \(\newcommand{\rank}{\operatorname{rank}}\) \(\newcommand{\row}{\text{Row}}\) \(\newcommand{\col}{\text{Col}}\) \(\renewcommand{\row}{\text{Row}}\) \(\newcommand{\nul}{\text{Nul}}\) \(\newcommand{\var}{\text{Var}}\) \(\newcommand{\corr}{\text{corr}}\) \(\newcommand{\len}[1]{\left|#1\right|}\) \(\newcommand{\bbar}{\overline{\bvec}}\) \(\newcommand{\bhat}{\widehat{\bvec}}\) \(\newcommand{\bperp}{\bvec^\perp}\) \(\newcommand{\xhat}{\widehat{\xvec}}\) \(\newcommand{\vhat}{\widehat{\vvec}}\) \(\newcommand{\uhat}{\widehat{\uvec}}\) \(\newcommand{\what}{\widehat{\wvec}}\) \(\newcommand{\Sighat}{\widehat{\Sigma}}\) \(\newcommand{\lt}{<}\) \(\newcommand{\gt}{>}\) \(\newcommand{\amp}{&}\) \(\definecolor{fillinmathshade}{gray}{0.9}\)Because of the rich energy content of fossil fuels, humans have gotten in the habit of burning them, and depending intensely on the burning. The modern global economy and the lifestyles of us modern humans are powered in large part by the combustion of fossil fuel — solids, liquids, and gases that derive their energy content from sunlight that shone on Earth tens to hundreds of millions of years ago. As plants do with oxygen waste, we toss our \(\ce{CO2}\) waste into the atmosphere. Because it’s invisible, we’ve been able to ignore it for a long time. Out of sight, out of mind.
\(\ce{CO2}\) rise

Since humanity began burning fossil fuels in earnest (the start of the Industrial Revolution), \(\ce{CO2}\) levels have increased in the atmosphere of our world. The seasonal signal of photosynthesis is still there, but every year, \(\ce{CO2}\) ends up at a higher level than the previous year. From a pre-Industrial level of ~280 parts per million (ppm) to the current ~420 ppm, it has increased by about 50%.
It would have been an even larger increase, had not the Earth system been so intimately inter-connected. Much of the \(\ce{CO2}\) that humanity has emitted through the burning of fossil fuels has been re-extracted from the atmosphere: some has been taken out by plants doing photosynthesis more efficiently, and some has been soaked up by the oceans.

Estimates of the flow of carbon between reservoirs in the Earth system suggest that human activities release about nine billion tons (gigatons) of carbon into the atmosphere per year, of which three is then pulled out again by plant photosynthesis, and two is dissolved in the oceans. That leaves a net atmospheric gain of four gigatons per year. Examine the graphic at left to explore the complexities of carbon fluxes between reservoirs, but follow the red numbers, which show the changes that result from the human economy’s dependence on burning ancient trees and algae. This imbalance is why the graph above shows a relentless climb: the rates of carbon absorption can’t match the rates of carbon emission.
Oceanographers are well aware of one of the consequences of this natural carbon sequestration: those extra two gigatons of carbon soaked into the oceans each year produce carbonic acid, which is making the ocean overall more acidic. Already surface ocean pH has dropped by 0.1 unit, with a forecast total of -0.7 pH units change over the next 750 years. This potentially has enormous effects for the viability of life in the oceans. Many of our greatest episodes of mass extinction are correlated with times of intense ocean acidification.
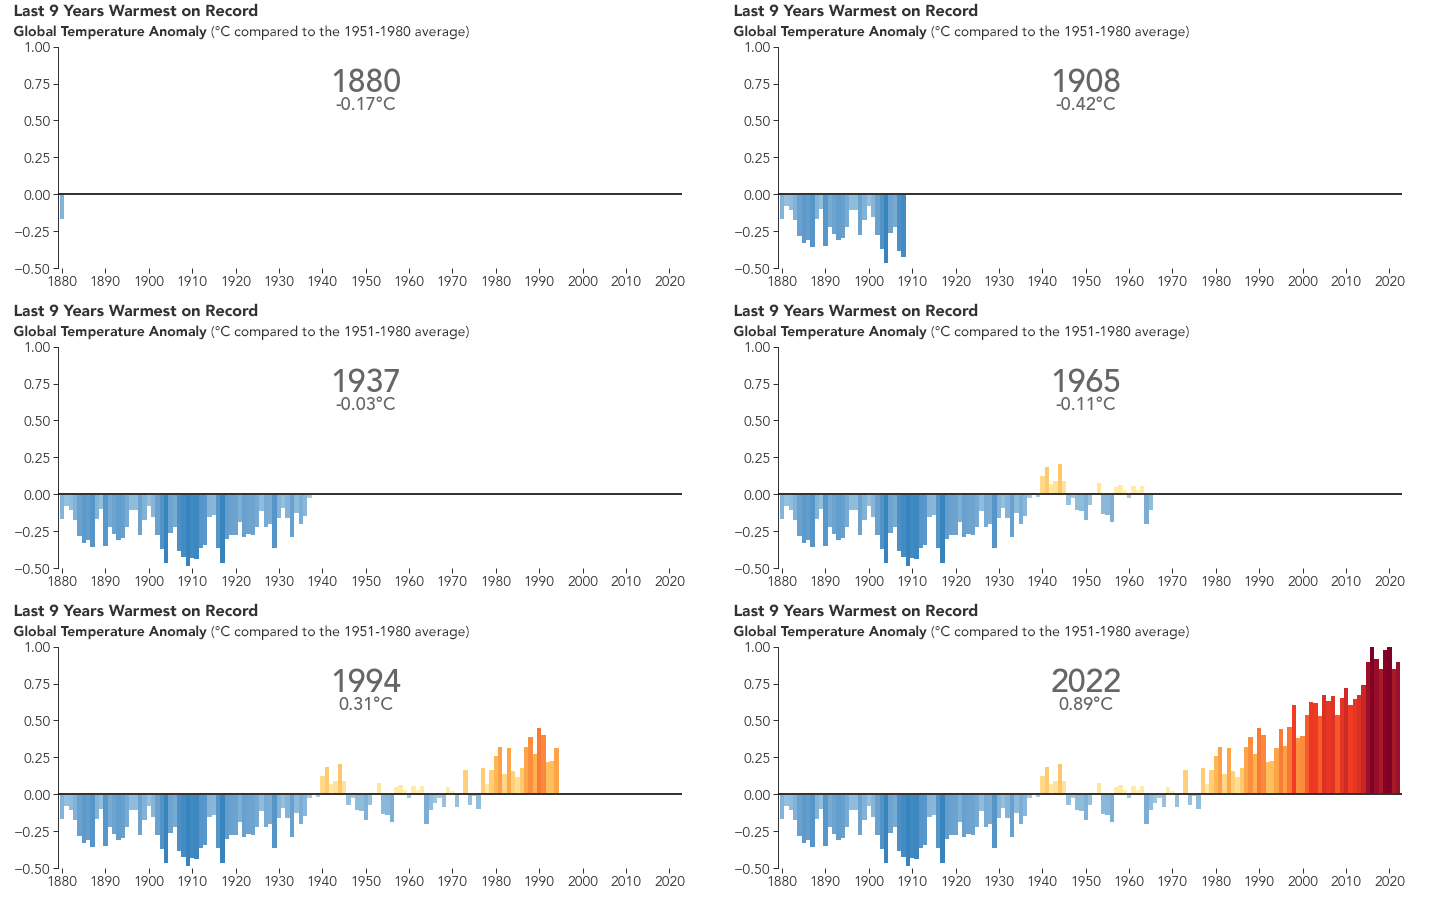
But the bigger issue is probably global warming. Because of the selective transparency of the \(\ce{CO2}\) molecule, the higher level of this greenhouse gas has resulted in Earth retaining more energy than previously. This has caused the average global temperature to increase.

There are many consequences of this change in the planet’s climate, including: melting glacial ice and permafrost, rising sea levels, intensification of tropical storms, increasing desertification, and a spur to the migration of species toward more pole-ward latitudes and higher elevations. It is an interesting time to be alive and scientifically aware on planet Earth.
\(\ce{O2}\) fall
There is another aspect of the burning of fossil fuels which is also noteworthy. The basic combustion reaction of \(\ce{C} + \ce{O2} \rightarrow \ce{CO2}\) generates \(\ce{CO2}\) of course, but it also consumes \(\ce{O2}\). For every atom of carbon we oxidize to power our energy grid or heat our homes or propel our vehicles, we lose one molecule of free oxygen from the atmosphere. Thus, as the past six decades of measurements show a rise in \(\ce{CO2}\), we should also expect a commensurate decline in \(\bf{\ce{O2}}\).
Indeed, that is what we have observed:

At first glance, this graph might seem alarming to readers who breathe oxygen, but remember that this is a parts-per-million level decline in a very large reservoir of oxygen: ~21%. It represents a drop of a few ten-thousandths of the total amount of oxygen. So you don’t have to worry about running out of breathable air. We will exhaust our supply of fossil fuels long before atmospheric oxygen levels change by even 1%.
Instead, save your worrying for the impacts of global warming.


