6.5: Geophysical phenomena
- Page ID
- 22634
\( \newcommand{\vecs}[1]{\overset { \scriptstyle \rightharpoonup} {\mathbf{#1}} } \)
\( \newcommand{\vecd}[1]{\overset{-\!-\!\rightharpoonup}{\vphantom{a}\smash {#1}}} \)
\( \newcommand{\dsum}{\displaystyle\sum\limits} \)
\( \newcommand{\dint}{\displaystyle\int\limits} \)
\( \newcommand{\dlim}{\displaystyle\lim\limits} \)
\( \newcommand{\id}{\mathrm{id}}\) \( \newcommand{\Span}{\mathrm{span}}\)
( \newcommand{\kernel}{\mathrm{null}\,}\) \( \newcommand{\range}{\mathrm{range}\,}\)
\( \newcommand{\RealPart}{\mathrm{Re}}\) \( \newcommand{\ImaginaryPart}{\mathrm{Im}}\)
\( \newcommand{\Argument}{\mathrm{Arg}}\) \( \newcommand{\norm}[1]{\| #1 \|}\)
\( \newcommand{\inner}[2]{\langle #1, #2 \rangle}\)
\( \newcommand{\Span}{\mathrm{span}}\)
\( \newcommand{\id}{\mathrm{id}}\)
\( \newcommand{\Span}{\mathrm{span}}\)
\( \newcommand{\kernel}{\mathrm{null}\,}\)
\( \newcommand{\range}{\mathrm{range}\,}\)
\( \newcommand{\RealPart}{\mathrm{Re}}\)
\( \newcommand{\ImaginaryPart}{\mathrm{Im}}\)
\( \newcommand{\Argument}{\mathrm{Arg}}\)
\( \newcommand{\norm}[1]{\| #1 \|}\)
\( \newcommand{\inner}[2]{\langle #1, #2 \rangle}\)
\( \newcommand{\Span}{\mathrm{span}}\) \( \newcommand{\AA}{\unicode[.8,0]{x212B}}\)
\( \newcommand{\vectorA}[1]{\vec{#1}} % arrow\)
\( \newcommand{\vectorAt}[1]{\vec{\text{#1}}} % arrow\)
\( \newcommand{\vectorB}[1]{\overset { \scriptstyle \rightharpoonup} {\mathbf{#1}} } \)
\( \newcommand{\vectorC}[1]{\textbf{#1}} \)
\( \newcommand{\vectorD}[1]{\overrightarrow{#1}} \)
\( \newcommand{\vectorDt}[1]{\overrightarrow{\text{#1}}} \)
\( \newcommand{\vectE}[1]{\overset{-\!-\!\rightharpoonup}{\vphantom{a}\smash{\mathbf {#1}}}} \)
\( \newcommand{\vecs}[1]{\overset { \scriptstyle \rightharpoonup} {\mathbf{#1}} } \)
\(\newcommand{\longvect}{\overrightarrow}\)
\( \newcommand{\vecd}[1]{\overset{-\!-\!\rightharpoonup}{\vphantom{a}\smash {#1}}} \)
\(\newcommand{\avec}{\mathbf a}\) \(\newcommand{\bvec}{\mathbf b}\) \(\newcommand{\cvec}{\mathbf c}\) \(\newcommand{\dvec}{\mathbf d}\) \(\newcommand{\dtil}{\widetilde{\mathbf d}}\) \(\newcommand{\evec}{\mathbf e}\) \(\newcommand{\fvec}{\mathbf f}\) \(\newcommand{\nvec}{\mathbf n}\) \(\newcommand{\pvec}{\mathbf p}\) \(\newcommand{\qvec}{\mathbf q}\) \(\newcommand{\svec}{\mathbf s}\) \(\newcommand{\tvec}{\mathbf t}\) \(\newcommand{\uvec}{\mathbf u}\) \(\newcommand{\vvec}{\mathbf v}\) \(\newcommand{\wvec}{\mathbf w}\) \(\newcommand{\xvec}{\mathbf x}\) \(\newcommand{\yvec}{\mathbf y}\) \(\newcommand{\zvec}{\mathbf z}\) \(\newcommand{\rvec}{\mathbf r}\) \(\newcommand{\mvec}{\mathbf m}\) \(\newcommand{\zerovec}{\mathbf 0}\) \(\newcommand{\onevec}{\mathbf 1}\) \(\newcommand{\real}{\mathbb R}\) \(\newcommand{\twovec}[2]{\left[\begin{array}{r}#1 \\ #2 \end{array}\right]}\) \(\newcommand{\ctwovec}[2]{\left[\begin{array}{c}#1 \\ #2 \end{array}\right]}\) \(\newcommand{\threevec}[3]{\left[\begin{array}{r}#1 \\ #2 \\ #3 \end{array}\right]}\) \(\newcommand{\cthreevec}[3]{\left[\begin{array}{c}#1 \\ #2 \\ #3 \end{array}\right]}\) \(\newcommand{\fourvec}[4]{\left[\begin{array}{r}#1 \\ #2 \\ #3 \\ #4 \end{array}\right]}\) \(\newcommand{\cfourvec}[4]{\left[\begin{array}{c}#1 \\ #2 \\ #3 \\ #4 \end{array}\right]}\) \(\newcommand{\fivevec}[5]{\left[\begin{array}{r}#1 \\ #2 \\ #3 \\ #4 \\ #5 \\ \end{array}\right]}\) \(\newcommand{\cfivevec}[5]{\left[\begin{array}{c}#1 \\ #2 \\ #3 \\ #4 \\ #5 \\ \end{array}\right]}\) \(\newcommand{\mattwo}[4]{\left[\begin{array}{rr}#1 \amp #2 \\ #3 \amp #4 \\ \end{array}\right]}\) \(\newcommand{\laspan}[1]{\text{Span}\{#1\}}\) \(\newcommand{\bcal}{\cal B}\) \(\newcommand{\ccal}{\cal C}\) \(\newcommand{\scal}{\cal S}\) \(\newcommand{\wcal}{\cal W}\) \(\newcommand{\ecal}{\cal E}\) \(\newcommand{\coords}[2]{\left\{#1\right\}_{#2}}\) \(\newcommand{\gray}[1]{\color{gray}{#1}}\) \(\newcommand{\lgray}[1]{\color{lightgray}{#1}}\) \(\newcommand{\rank}{\operatorname{rank}}\) \(\newcommand{\row}{\text{Row}}\) \(\newcommand{\col}{\text{Col}}\) \(\renewcommand{\row}{\text{Row}}\) \(\newcommand{\nul}{\text{Nul}}\) \(\newcommand{\var}{\text{Var}}\) \(\newcommand{\corr}{\text{corr}}\) \(\newcommand{\len}[1]{\left|#1\right|}\) \(\newcommand{\bbar}{\overline{\bvec}}\) \(\newcommand{\bhat}{\widehat{\bvec}}\) \(\newcommand{\bperp}{\bvec^\perp}\) \(\newcommand{\xhat}{\widehat{\xvec}}\) \(\newcommand{\vhat}{\widehat{\vvec}}\) \(\newcommand{\uhat}{\widehat{\uvec}}\) \(\newcommand{\what}{\widehat{\wvec}}\) \(\newcommand{\Sighat}{\widehat{\Sigma}}\) \(\newcommand{\lt}{<}\) \(\newcommand{\gt}{>}\) \(\newcommand{\amp}{&}\) \(\definecolor{fillinmathshade}{gray}{0.9}\)Several manifestations of plate tectonics are best examined through the lens of geophysics.
Earthquakes
The vast, vast majority of earthquakes on Earth are associated with plate boundaries. Examine this map showing more than a century of epicenters to get an immediate, visceral sense of this pattern:
Earthquakes are caused by the sudden slip of two bodies of rock past one another, after tectonic stresses have accumulated to the point that they overwhelm frictional inertia. Most (95%) of the places where rock is forced into the uncomfortable position of scraping over other rock are located at plate boundaries. The exceptions (5%) are at sites where the crust is being stressed for other reasons: excessive loading due to sedimentation, intrusion of magma, isostatic adjustments, or artificially induced seismicity due to elevated pore pressure.
Volcanoes

Figure \(\PageIndex{1}\): Mount Augustine, a composite volcano in Cook Inlet, Alaska, erupting in 2006. (Photo by Game McGimsey, USGS.)
Similarly, most volcanoes on this planet are associated in some way with plate boundaries [map]. There are four major options here:
1. Subduction of oceanic lithosphere under continental lithosphere (example: Andes)
2. Subduction of oceanic lithosphere under oceanic lithosphere (example: the Philippines)
3. Divergence (rifting) of continental lithosphere (example: East African Rift)
4. Divergence (seafloor spreading) of oceanic lithosphere (example: Mid-Atlantic Ridge)
But volcanoes can also form in non-plate boundary settings. When we find eruptions piercing plates in locations far from their edges, many geologists invoke hot spots or mantle plumes. The idea here is that, independent of plate motions, the mantle has isolated point loci where rising warm material convects upward, and in so doing partially melts. The magma makes its way through the overlying lithosphere and erupts. This can occur in a couple of contexts:
1. Hot spot volcanism through oceanic lithosphere (example: Hawaii)
2. Hot spot volcanism through continental lithosphere (example: Yellowstone)
GPS & InSAR

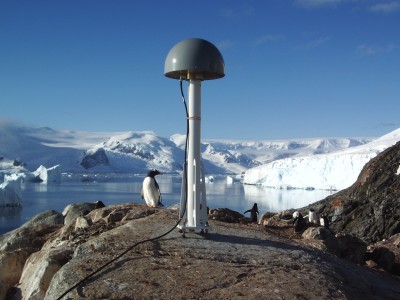
One of the greatest innovations of the modern era is the advent of global navigation satellite systems (GNSS), including the American global positioning system (GPS). With dozens of satellites orbiting the Earth, a given receiver on the ground can trilaterate its position exceptionally precisely. This is not only useful for Waze getting you to your job interview on time, but can also be used for documenting the subtle motions of Earth’s crust.
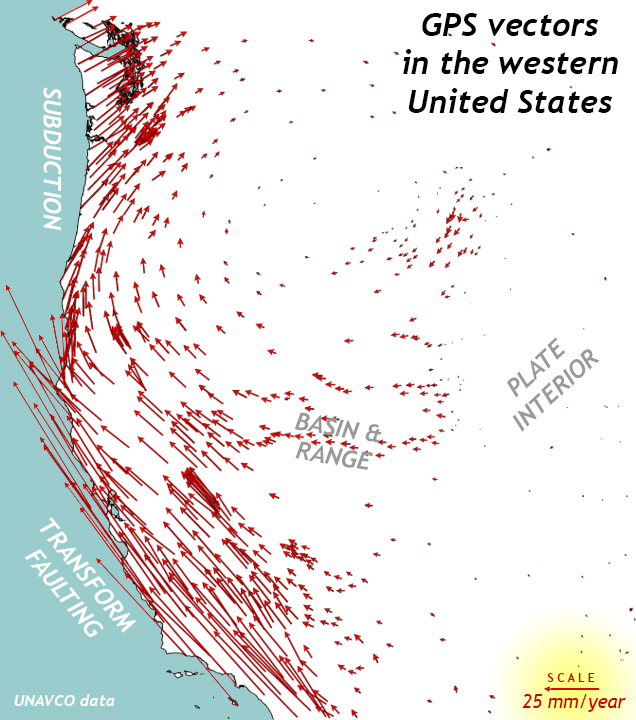
GNSS measurements show the crust moving relative to other parts of the crust. To analyze GNSS information, a geodesist must choose a frame of reference. Since no spot on Earth’s surface is stationary over the long term, it is important to realize that all plate motion is relative to other plates. For instance, if you choose North America as your reference frame, but examine the motions of various spots west of the Wasatch Front, you’ll find an interesting set of patterns:

Each arrow shows the vector of motion* of that location. Vectors are ways of describing motion in terms of both magnitude and direction. The longer the arrow, the faster that bit of the crust is moving. The arrow points in the direction that crust is moving relative to the North American frame of reference.
*Technically, what is shown in that map is the horizontal component of the velocity. There can also be a vertical component of the velocity (i.e., up or down motion), especially at divergent or convergent boundaries, or sites of transpression or transtension. Displaying this vertical motion is an additional option on the UNAVCO GPS Velocity Viewer application.

Another aspect of satellite measurement can be utilized for examining land positions before and after an earthquake. InSAR uses microwaves to repeatedly measure the shape of Earth’s surface, and if there is a change (sudden or gradual), InSAR can detect the difference between one radar mapping “pass” by a satellite and its successor. What’s literally being measured here is whether the land surface has moved toward or away from the satellite. InSAR data is displayed in rainbow-scale maps called “interferograms.” Each psychedelic blue/orange band in such an image represents a vertical displacement of 28 mm. Counting the number of bands and multiplying by 28 will give a fair estimate for the vertical offset of a fault in a given earthquake, as measured in millimeters.
Did I Get It? - Quiz
Where can we find 95% of all earthquakes?
a. Along plate boundaries
b. In plate interiors
c. In the lower mantle
d. Along the edges of continents
- Answer
-
a. Along plate boundaries
GPS stands for ___________.
a. granite posts selfies
b. geostationary positron sycophancy
c. global positioning system
d. gopher performs soliloquy
- Answer
-
c. global positioning system
What is the overall pattern of the continental crust in the western part of the contiguous United States of America?
a. a uniform southward march, but faster in the north than in the south
b. a clockwise spin, with highest velocities west of the San Andreas Fault
c. a counterclockwise spin, with highest velocities east of the Wasatch Fault
- Answer
-
b. a clockwise spin, with highest velocities west of the San Andreas Fault
What is InSAR good for?
a. Quantifying annual plate motion relative to other plates
b. Measuring surface deformation after earthquakes
c. Quantifying subsurface movement of magma
d. Evaluating risk due to future earthquakes
- Answer
-
b. Measuring surface deformation after earthquakes
Which of the following locations is thought to be a modern example of a hot spot?
a. Hawaii
b. Virginia
c. Mid-Atlantic Ridge
d. Andes
e. Philippines
- Answer
-
a. Hawaii


