
11.3: Measuring Earthquakes
- Page ID
- 7839

\( \newcommand{\vecs}[1]{\overset { \scriptstyle \rightharpoonup} {\mathbf{#1}} } \)
\( \newcommand{\vecd}[1]{\overset{-\!-\!\rightharpoonup}{\vphantom{a}\smash {#1}}} \)
\( \newcommand{\dsum}{\displaystyle\sum\limits} \)
\( \newcommand{\dint}{\displaystyle\int\limits} \)
\( \newcommand{\dlim}{\displaystyle\lim\limits} \)
\( \newcommand{\id}{\mathrm{id}}\) \( \newcommand{\Span}{\mathrm{span}}\)
( \newcommand{\kernel}{\mathrm{null}\,}\) \( \newcommand{\range}{\mathrm{range}\,}\)
\( \newcommand{\RealPart}{\mathrm{Re}}\) \( \newcommand{\ImaginaryPart}{\mathrm{Im}}\)
\( \newcommand{\Argument}{\mathrm{Arg}}\) \( \newcommand{\norm}[1]{\| #1 \|}\)
\( \newcommand{\inner}[2]{\langle #1, #2 \rangle}\)
\( \newcommand{\Span}{\mathrm{span}}\)
\( \newcommand{\id}{\mathrm{id}}\)
\( \newcommand{\Span}{\mathrm{span}}\)
\( \newcommand{\kernel}{\mathrm{null}\,}\)
\( \newcommand{\range}{\mathrm{range}\,}\)
\( \newcommand{\RealPart}{\mathrm{Re}}\)
\( \newcommand{\ImaginaryPart}{\mathrm{Im}}\)
\( \newcommand{\Argument}{\mathrm{Arg}}\)
\( \newcommand{\norm}[1]{\| #1 \|}\)
\( \newcommand{\inner}[2]{\langle #1, #2 \rangle}\)
\( \newcommand{\Span}{\mathrm{span}}\) \( \newcommand{\AA}{\unicode[.8,0]{x212B}}\)
\( \newcommand{\vectorA}[1]{\vec{#1}} % arrow\)
\( \newcommand{\vectorAt}[1]{\vec{\text{#1}}} % arrow\)
\( \newcommand{\vectorB}[1]{\overset { \scriptstyle \rightharpoonup} {\mathbf{#1}} } \)
\( \newcommand{\vectorC}[1]{\textbf{#1}} \)
\( \newcommand{\vectorD}[1]{\overrightarrow{#1}} \)
\( \newcommand{\vectorDt}[1]{\overrightarrow{\text{#1}}} \)
\( \newcommand{\vectE}[1]{\overset{-\!-\!\rightharpoonup}{\vphantom{a}\smash{\mathbf {#1}}}} \)
\( \newcommand{\vecs}[1]{\overset { \scriptstyle \rightharpoonup} {\mathbf{#1}} } \)
\(\newcommand{\longvect}{\overrightarrow}\)
\( \newcommand{\vecd}[1]{\overset{-\!-\!\rightharpoonup}{\vphantom{a}\smash {#1}}} \)
\(\newcommand{\avec}{\mathbf a}\) \(\newcommand{\bvec}{\mathbf b}\) \(\newcommand{\cvec}{\mathbf c}\) \(\newcommand{\dvec}{\mathbf d}\) \(\newcommand{\dtil}{\widetilde{\mathbf d}}\) \(\newcommand{\evec}{\mathbf e}\) \(\newcommand{\fvec}{\mathbf f}\) \(\newcommand{\nvec}{\mathbf n}\) \(\newcommand{\pvec}{\mathbf p}\) \(\newcommand{\qvec}{\mathbf q}\) \(\newcommand{\svec}{\mathbf s}\) \(\newcommand{\tvec}{\mathbf t}\) \(\newcommand{\uvec}{\mathbf u}\) \(\newcommand{\vvec}{\mathbf v}\) \(\newcommand{\wvec}{\mathbf w}\) \(\newcommand{\xvec}{\mathbf x}\) \(\newcommand{\yvec}{\mathbf y}\) \(\newcommand{\zvec}{\mathbf z}\) \(\newcommand{\rvec}{\mathbf r}\) \(\newcommand{\mvec}{\mathbf m}\) \(\newcommand{\zerovec}{\mathbf 0}\) \(\newcommand{\onevec}{\mathbf 1}\) \(\newcommand{\real}{\mathbb R}\) \(\newcommand{\twovec}[2]{\left[\begin{array}{r}#1 \\ #2 \end{array}\right]}\) \(\newcommand{\ctwovec}[2]{\left[\begin{array}{c}#1 \\ #2 \end{array}\right]}\) \(\newcommand{\threevec}[3]{\left[\begin{array}{r}#1 \\ #2 \\ #3 \end{array}\right]}\) \(\newcommand{\cthreevec}[3]{\left[\begin{array}{c}#1 \\ #2 \\ #3 \end{array}\right]}\) \(\newcommand{\fourvec}[4]{\left[\begin{array}{r}#1 \\ #2 \\ #3 \\ #4 \end{array}\right]}\) \(\newcommand{\cfourvec}[4]{\left[\begin{array}{c}#1 \\ #2 \\ #3 \\ #4 \end{array}\right]}\) \(\newcommand{\fivevec}[5]{\left[\begin{array}{r}#1 \\ #2 \\ #3 \\ #4 \\ #5 \\ \end{array}\right]}\) \(\newcommand{\cfivevec}[5]{\left[\begin{array}{c}#1 \\ #2 \\ #3 \\ #4 \\ #5 \\ \end{array}\right]}\) \(\newcommand{\mattwo}[4]{\left[\begin{array}{rr}#1 \amp #2 \\ #3 \amp #4 \\ \end{array}\right]}\) \(\newcommand{\laspan}[1]{\text{Span}\{#1\}}\) \(\newcommand{\bcal}{\cal B}\) \(\newcommand{\ccal}{\cal C}\) \(\newcommand{\scal}{\cal S}\) \(\newcommand{\wcal}{\cal W}\) \(\newcommand{\ecal}{\cal E}\) \(\newcommand{\coords}[2]{\left\{#1\right\}_{#2}}\) \(\newcommand{\gray}[1]{\color{gray}{#1}}\) \(\newcommand{\lgray}[1]{\color{lightgray}{#1}}\) \(\newcommand{\rank}{\operatorname{rank}}\) \(\newcommand{\row}{\text{Row}}\) \(\newcommand{\col}{\text{Col}}\) \(\renewcommand{\row}{\text{Row}}\) \(\newcommand{\nul}{\text{Nul}}\) \(\newcommand{\var}{\text{Var}}\) \(\newcommand{\corr}{\text{corr}}\) \(\newcommand{\len}[1]{\left|#1\right|}\) \(\newcommand{\bbar}{\overline{\bvec}}\) \(\newcommand{\bhat}{\widehat{\bvec}}\) \(\newcommand{\bperp}{\bvec^\perp}\) \(\newcommand{\xhat}{\widehat{\xvec}}\) \(\newcommand{\vhat}{\widehat{\vvec}}\) \(\newcommand{\uhat}{\widehat{\uvec}}\) \(\newcommand{\what}{\widehat{\wvec}}\) \(\newcommand{\Sighat}{\widehat{\Sigma}}\) \(\newcommand{\lt}{<}\) \(\newcommand{\gt}{>}\) \(\newcommand{\amp}{&}\) \(\definecolor{fillinmathshade}{gray}{0.9}\)There are two main ways to measure earthquakes. The first of these is an estimate of the energy released, and the value is referred to as magnitude. This is the number that is typically used by the press when a big earthquake happens. It is often referred to as “Richter magnitude,” but that is a misnomer, and it should be just “magnitude.” There are many ways to measure magnitude—including Charles Richter’s method developed in 1935—but they are all ways to estimate the same number, which is proportional to the amount of energy released.
The other way of assessing the impact of an earthquake is to assess what people felt and how much damage was done. This is known as intensity. Intensity values are assigned to locations, rather than to the earthquake itself, and therefore intensity can vary widely, depending on the proximity to the earthquake and the types of materials underneath and the local conditions.
Earthquake Magnitude
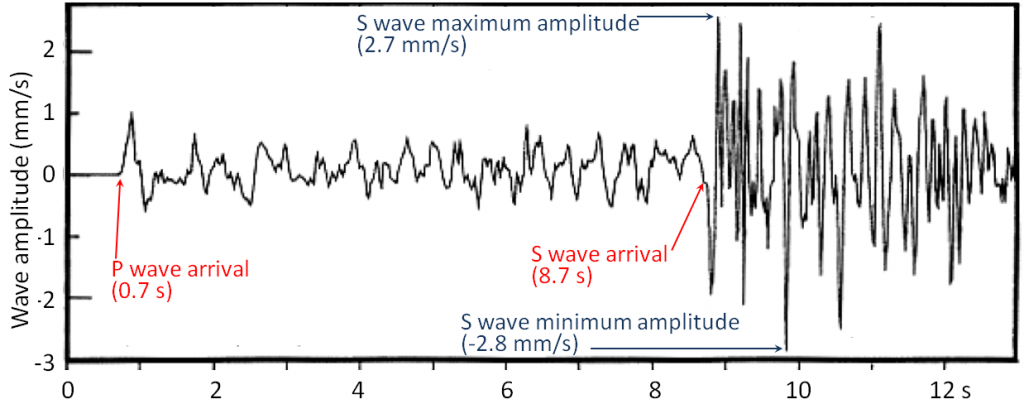
Before we look more closely at magnitude we need to review what we know about body waves, and look at surface waves. Body waves are of two types, P waves, or primary or compression waves (like the compression of the coils of a spring), and S waves, or secondary or shear waves (like the flick of a rope). An example of P and S seismic wave records is shown in Figure \(\PageIndex{1}\). The critical parameters for the measurement of magnitude are labelled, including the time interval between the arrival of the P- and S-waves—which is used to determine the distance from the earthquake to the seismic station, and the amplitude of the S-waves—which is used to estimate the magnitude of the earthquake.
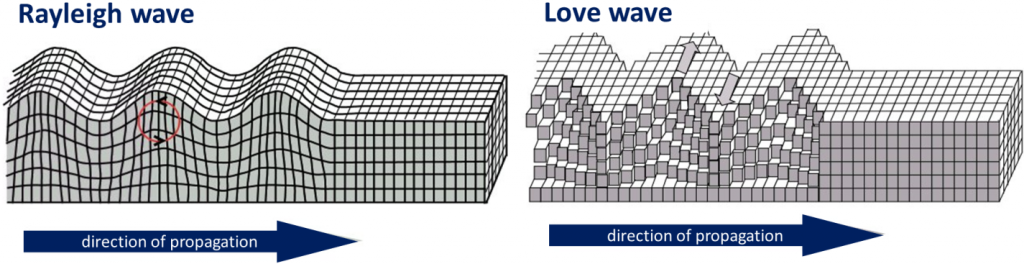
When body waves (P or S) reach Earth’s surface, some of their energy is transformed into surface waves, of which there are two main types, as illustrated in Figure \(\PageIndex{2}\). Rayleigh waves are characterized by vertical motion of the ground surface, like waves on water, while Love waves are characterized by horizontal motion. Both Rayleigh and Love waves are about 10% slower than S-waves (so they arrive later at a seismic station). Surface waves typically have greater amplitudes than body waves, and they do more damage.
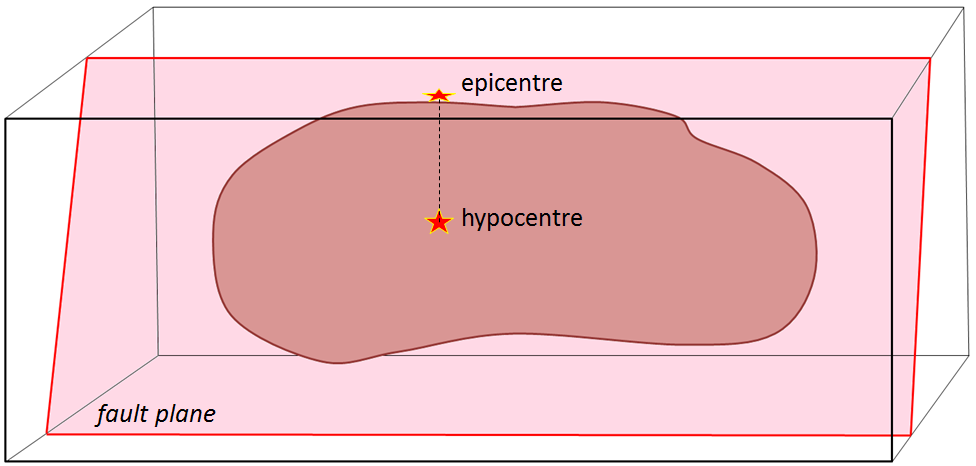
Other important terms for describing earthquakes are hypocentre (or focus) and epicentre. The hypocentre is the actual location of an individual earthquake shock at depth in the ground, and the epicentre is the point on the land surface vertically above the hypocentre (Figure \(\PageIndex{3}\)).
A number of methods for estimating magnitude are listed in Table 11.1. Local magnitude (ML) was widely used until late in the 20th century, but moment magnitude (MW) is now more commonly used because it gives more accurate estimates (especially with larger earthquakes) and can be applied to earthquakes at any distance from a seismometer. Surface-wave magnitudes can also be applied to measure distant large earthquakes.
Because of the increasing size of cities in earthquake-prone areas (e.g., China, Japan, California) and the increasing sophistication of infrastructure, it is becoming important to have very rapid warnings and magnitude estimates of earthquakes that have already happened. This can be achieved by using P-wave data to determine magnitude because P-waves arrive first at seismic stations, in many cases several seconds ahead of the more damaging S-waves and surface waves. Operators of electrical grids, pipelines, trains, and other infrastructure can use the information to automatically shut down systems so that damage and casualties can be limited.
| [Skip Table] | |||
| Type | M Range | Dist. Range | Comments |
|---|---|---|---|
| Local or Richter (ML) | 2 to 6 | 0 to 400 kilometers | The original magnitude relationship defined in 1935 by Richter and Gutenberg. It is based on the maximum amplitude of S-waves recorded on a Wood‑Anderson torsion seismograph. ML values can be calculated using data from modern instruments. L stands for local because it only applies to earthquakes relatively close to the seismic station. |
| Moment (MW) | Greater than 3.5 | All | Based on the seismic moment of the earthquake, which is equal to the average amount of displacement on the fault times the fault area that slipped. It can also be estimated from seismic data if the seismometer is tuned to detect long-period body waves. |
| Surface wave (MS) | 5 to 8 | 20 to 180° | A magnitude for distant earthquakes based on the amplitude of surface waves measured at a period near 20 seconds. |
| P-wave | 2 to 8 | Local | Based on the amplitude of P-waves. This technique is being increasingly used to provide very rapid magnitude estimates so that early warnings can be sent to utility and transportation operators to shut down equipment before the larger (but slower) S-waves and surface waves arrive. |
Use this moment magnitude calculation tool to estimate the moment magnitude based on the approximate length, width, and displacement values provided in the following table:
| [Skip Table] | ||||
| Length (kilometers) | Width (kilometers) | Displacement (meters) | Earthquake | MW? |
|---|---|---|---|---|
| 60 | 15 | 4 | The 1946 Vancouver Island earthquake | |
| 0.4 | 0.2 | .5 | The small Vancouver Island earthquake shown in Figure \(\PageIndex{1}\) | |
| 20 | 8 | 4 | The 2001 Nisqually earthquake described in Exercise 11.3 | |
| 1,100 | 120 | 10 | The 2004 Indian Ocean earthquake | |
| 30 | 11 | 4 | The 2010 Haiti earthquake | |
The largest recorded earthquake had a magnitude of 9.5. Could there be a 10? You can answer that question using this tool. See what numbers are needed to make MW = 10. Are they reasonable?
See Appendix 3 for Exercise 11.2 answers.
The magnitude scale is logarithmic; in fact, the amount of energy released by an earthquake of M4 is 32 times higher than that released by one of M3, and this ratio applies to all intervals in the scale. If we assign an arbitrary energy level of 1 unit to a M1 earthquake the energy for quakes up to M8 will be as shown on the following table:
| Magnitude | Energy |
|---|---|
| 1 | 1 |
| 2 | 32 |
| 3 | 1,024 |
| 4 | 32,768 |
| 5 | 1,048,576 |
| 6 | 33,554,432 |
| 7 | 1,073,741,824 |
| 8 | 34,359,738,368 |
In any given year, when there is a large earthquake on Earth (M8 or M9), the amount of energy released by that one event will likely exceed the energy released by all smaller earthquake events combined.
Earthquake Intensity
The intensity of earthquake shaking at any location is determined not only by the magnitude of the earthquake and its distance, but also by the type of underlying rock or unconsolidated materials. If buildings are present, the size and type of buildings (and their inherent natural vibrations) are also important.
Intensity scales were first used in the late 19th century, and then adapted in the early 20th century by Giuseppe Mercalli and modified later by others to form what we know call the modified Mercalli intensity scale (Table 11.4). Intensity estimates are important because they allow us to characterize parts of any region into areas that are especially prone to strong shaking versus those that are not. The key factor in this regard is the nature of the underlying geological materials, and the weaker those are, the more likely it is that there will be strong shaking. Areas underlain by strong solid bedrock tend to experience much less shaking than those underlain by unconsolidated river or lake sediments.
| [Skip Table] | |
| Level of intensity | Description |
|---|---|
| Not felt (1) | Not felt except by a very few under especially favourable conditions |
| Weak (2) | Felt only by a few persons at rest, especially on upper floors of buildings |
| Weak (3) | Felt quite noticeably by persons indoors, especially on upper floors of buildings; many people do not recognize it as an earthquake; standing motor cars may rock slightly; vibrations similar to the passing of a truck; duration estimated |
| Light (4) | Felt indoors by many, outdoors by few during the day; at night, some awakened; dishes, windows, doors disturbed; walls make cracking sound; sensation like heavy truck striking building; standing motor cars rocked noticeably |
| Moderate (5) | Felt by nearly everyone; many awakened; some dishes, windows broken; unstable objects overturned; pendulum clocks may stop |
| Strong (6) | Felt by all, many frightened; some heavy furniture moved; a few instances of fallen plaster; damage slight |
| Very Strong (7) | Damage negligible in buildings of good design and construction; slight to moderate in well-built ordinary structures; considerable damage in poorly built or badly designed structures; some chimneys broken |
| Severe (8) | Damage slight in specially designed structures; considerable damage in ordinary substantial buildings with partial collapse; damage great in poorly built structures; fall of chimneys, factory stacks, columns, monuments, walls; heavy furniture overturned |
| Violent (9) | Damage considerable in specially designed structures; well-designed frame structures thrown out of plumb; damage great in substantial buildings, with partial collapse; buildings shifted off foundations |
| Extreme (10) | Some well-built wooden structures destroyed; most masonry and frame structures destroyed with foundations; rails bent |
| Extreme (11) | Few, if any (masonry), structures remain standing; bridges destroyed; broad fissures in ground; underground pipelines completely out of service; earth slumps and land slips in soft ground; rails bent greatly |
| Extreme (12) | Damage total; waves seen on ground surfaces; lines of sight and level distorted; objects thrown upward into the air |
An example of this effect is the 1985 M8 earthquake that struck the Michoacán region of western Mexico, southwest of Mexico City. There was relatively little damage in the area around the epicentre, but there was tremendous damage and about 5,000 deaths in heavily populated Mexico City some 350 kilometers from the epicentre. The key reason for this is that Mexico City was built largely on the unconsolidated and water-saturated sediment of former Lake Texcoco. These sediments resonate at a frequency of about two seconds, which was similar to the frequency of the body waves that reached the city. For the same reason that a powerful opera singer can break a wine glass by singing the right note, the amplitude of the seismic waves was amplified by the lake sediments. Survivors of the disaster recounted that the ground in some areas moved up and down by about 20 centimeters every two seconds for over two minutes. Damage was greatest to buildings between 5 and 15 storeys tall, because they also resonated at around two seconds, which amplified the shaking.
The following observations were made by residents of the Nanaimo area during the M6.8 Nisqually earthquake near Olympia, Washington in 2001. Estimate the Mercalli intensities using Table 11.4.
| [Skip Table] | |||||
| Building Type | Floor | Shaking Felt | How long it lasted (in seconds) | Description of Motion | Intensity? |
|---|---|---|---|---|---|
| House | 1 | no | 10 | Heard a large rumble lasting not even 10 seconds, mirror swayed | |
| House | 2 | moderate | 60 | Candles, pictures and CDs on bookshelf moved, towels fell off racks | |
| House | 1 | no | Pots hanging over stove moved and crashed together | ||
| House | 1 | weak | Rolling feeling with a sudden stop, picture fell off mantle, chair moved | ||
| Apartment | 1 | weak | 10 | Sounded like a big truck then everything shook for a short period | |
| House | 1 | moderate | 20-30 | Teacups rattled but didn’t fall off | |
| Institution | 2 | moderate | 15 | Creaking sounds, swaying movement of shelving | |
| House | 1 | moderate | 15-30 | Bed banging against the wall with me in it, dog barking aggressively | |
See Appendix 3 for Exercise 11.3 answers.
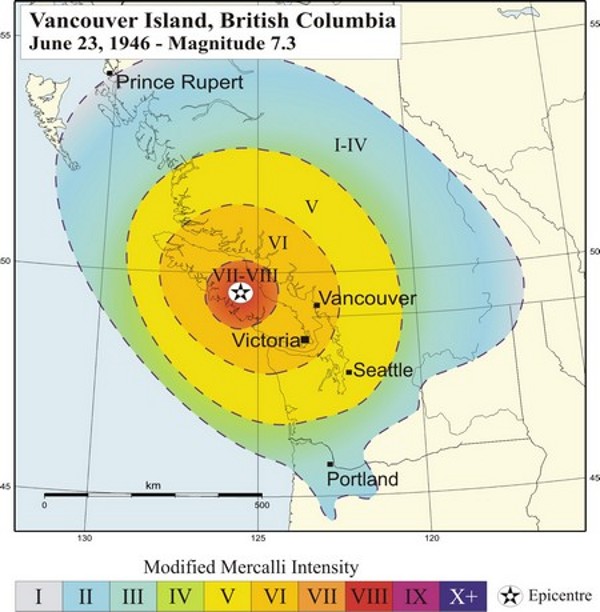
An intensity map for the 1946 M7.3 Vancouver Island earthquake is shown in Figure \(\PageIndex{4}\). The intensity was greatest in the central island region where, in some communities, chimneys were damaged on more than 75% of buildings, some roads were made impassable, and a major rock slide occurred. The earthquake was felt as far north as Prince Rupert, as far south as Portland Oregon, and as far east as the Rockies.
Image Descriptions
Figure \(\PageIndex{1}\) image description: P-waves and S-waves from a small (M4) earthquake near Vancouver Island in 1997. The P-wave arrived in 0.7 seconds with an amplitude ranging from negative 0.7 millimeters per second to 1.1 millimeters per second and lasting until the arrival of the S-wave. The S-wave arrived at 8.7 seconds, with a minimum amplitude of negative 2.8 millimeters per second and a maximum amplitude of 2.7 millimeters per second. The S-wave’s net amplitude gradually decreased over the next 5 seconds. [Return to Figure \(\PageIndex{1}\)]
Figure \(\PageIndex{4}\) image description: The graduated intensity of the 1945 M7.3 Vancouver Island earthquake based on the modified Mercalli intensity scale. The area surrounding the epicentre of the earthquake which included central Vancouver Island ranged between a very strong (7) and severe (8) intensity. The next ring included the northern and southern parts of Vancouver Island, as well as a part of the main land coast including Vancouver and much of the Sunshine coast a strong (6) intensity. The next ring, which reached experienced a moderate (5) intensity, included Seattle and much of the BC interior. The outermost ring ranged between not felt (1) and light (4) intensity. It was felt as far north as Prince Rupert and the southern tip of Haida Gwaii, south eastern BC, and as far south as north western Oregon. [Return to Figure \(\PageIndex{4}\)]
Media Attributions
- Figure \(\PageIndex{1}\): © Steven Earle. CC BY.
- Figure \(\PageIndex{2}\) (left): “Rayleigh Wave.” Adapted by Steven Earle. Public domain.
- Figure \(\PageIndex{2}\) (right): “Love Wave” © Nicoguaro. Adapted by Steven Earle. CC BY.
- Figure \(\PageIndex{3}\): © Steven Earle. CC BY.
- Figure \(\PageIndex{4}\): “Vancouver Island, British Columbia June 23, 1946 – Magnitude 7.3,” © National Resources Canada. Used under the terms allowing for non-commercial reproduction. This reproduction is a copy of an official work that is published by the Government of Canada. This reproduction has not been produced in affiliation with, or with the endorsement of the Government of Canada.
Text Attributions
- Table 11.4: The modified Mercalli intensity scale © Wikipedia. Adapted by Steven Earle. CC BY-SA.
- Table 11.1 by Steven Earle. ↵