4.7: Velocity Profiles
- Page ID
- 4819
\( \newcommand{\vecs}[1]{\overset { \scriptstyle \rightharpoonup} {\mathbf{#1}} } \)
\( \newcommand{\vecd}[1]{\overset{-\!-\!\rightharpoonup}{\vphantom{a}\smash {#1}}} \)
\( \newcommand{\id}{\mathrm{id}}\) \( \newcommand{\Span}{\mathrm{span}}\)
( \newcommand{\kernel}{\mathrm{null}\,}\) \( \newcommand{\range}{\mathrm{range}\,}\)
\( \newcommand{\RealPart}{\mathrm{Re}}\) \( \newcommand{\ImaginaryPart}{\mathrm{Im}}\)
\( \newcommand{\Argument}{\mathrm{Arg}}\) \( \newcommand{\norm}[1]{\| #1 \|}\)
\( \newcommand{\inner}[2]{\langle #1, #2 \rangle}\)
\( \newcommand{\Span}{\mathrm{span}}\)
\( \newcommand{\id}{\mathrm{id}}\)
\( \newcommand{\Span}{\mathrm{span}}\)
\( \newcommand{\kernel}{\mathrm{null}\,}\)
\( \newcommand{\range}{\mathrm{range}\,}\)
\( \newcommand{\RealPart}{\mathrm{Re}}\)
\( \newcommand{\ImaginaryPart}{\mathrm{Im}}\)
\( \newcommand{\Argument}{\mathrm{Arg}}\)
\( \newcommand{\norm}[1]{\| #1 \|}\)
\( \newcommand{\inner}[2]{\langle #1, #2 \rangle}\)
\( \newcommand{\Span}{\mathrm{span}}\) \( \newcommand{\AA}{\unicode[.8,0]{x212B}}\)
\( \newcommand{\vectorA}[1]{\vec{#1}} % arrow\)
\( \newcommand{\vectorAt}[1]{\vec{\text{#1}}} % arrow\)
\( \newcommand{\vectorB}[1]{\overset { \scriptstyle \rightharpoonup} {\mathbf{#1}} } \)
\( \newcommand{\vectorC}[1]{\textbf{#1}} \)
\( \newcommand{\vectorD}[1]{\overrightarrow{#1}} \)
\( \newcommand{\vectorDt}[1]{\overrightarrow{\text{#1}}} \)
\( \newcommand{\vectE}[1]{\overset{-\!-\!\rightharpoonup}{\vphantom{a}\smash{\mathbf {#1}}}} \)
\( \newcommand{\vecs}[1]{\overset { \scriptstyle \rightharpoonup} {\mathbf{#1}} } \)
\( \newcommand{\vecd}[1]{\overset{-\!-\!\rightharpoonup}{\vphantom{a}\smash {#1}}} \)
\(\newcommand{\avec}{\mathbf a}\) \(\newcommand{\bvec}{\mathbf b}\) \(\newcommand{\cvec}{\mathbf c}\) \(\newcommand{\dvec}{\mathbf d}\) \(\newcommand{\dtil}{\widetilde{\mathbf d}}\) \(\newcommand{\evec}{\mathbf e}\) \(\newcommand{\fvec}{\mathbf f}\) \(\newcommand{\nvec}{\mathbf n}\) \(\newcommand{\pvec}{\mathbf p}\) \(\newcommand{\qvec}{\mathbf q}\) \(\newcommand{\svec}{\mathbf s}\) \(\newcommand{\tvec}{\mathbf t}\) \(\newcommand{\uvec}{\mathbf u}\) \(\newcommand{\vvec}{\mathbf v}\) \(\newcommand{\wvec}{\mathbf w}\) \(\newcommand{\xvec}{\mathbf x}\) \(\newcommand{\yvec}{\mathbf y}\) \(\newcommand{\zvec}{\mathbf z}\) \(\newcommand{\rvec}{\mathbf r}\) \(\newcommand{\mvec}{\mathbf m}\) \(\newcommand{\zerovec}{\mathbf 0}\) \(\newcommand{\onevec}{\mathbf 1}\) \(\newcommand{\real}{\mathbb R}\) \(\newcommand{\twovec}[2]{\left[\begin{array}{r}#1 \\ #2 \end{array}\right]}\) \(\newcommand{\ctwovec}[2]{\left[\begin{array}{c}#1 \\ #2 \end{array}\right]}\) \(\newcommand{\threevec}[3]{\left[\begin{array}{r}#1 \\ #2 \\ #3 \end{array}\right]}\) \(\newcommand{\cthreevec}[3]{\left[\begin{array}{c}#1 \\ #2 \\ #3 \end{array}\right]}\) \(\newcommand{\fourvec}[4]{\left[\begin{array}{r}#1 \\ #2 \\ #3 \\ #4 \end{array}\right]}\) \(\newcommand{\cfourvec}[4]{\left[\begin{array}{c}#1 \\ #2 \\ #3 \\ #4 \end{array}\right]}\) \(\newcommand{\fivevec}[5]{\left[\begin{array}{r}#1 \\ #2 \\ #3 \\ #4 \\ #5 \\ \end{array}\right]}\) \(\newcommand{\cfivevec}[5]{\left[\begin{array}{c}#1 \\ #2 \\ #3 \\ #4 \\ #5 \\ \end{array}\right]}\) \(\newcommand{\mattwo}[4]{\left[\begin{array}{rr}#1 \amp #2 \\ #3 \amp #4 \\ \end{array}\right]}\) \(\newcommand{\laspan}[1]{\text{Span}\{#1\}}\) \(\newcommand{\bcal}{\cal B}\) \(\newcommand{\ccal}{\cal C}\) \(\newcommand{\scal}{\cal S}\) \(\newcommand{\wcal}{\cal W}\) \(\newcommand{\ecal}{\cal E}\) \(\newcommand{\coords}[2]{\left\{#1\right\}_{#2}}\) \(\newcommand{\gray}[1]{\color{gray}{#1}}\) \(\newcommand{\lgray}[1]{\color{lightgray}{#1}}\) \(\newcommand{\rank}{\operatorname{rank}}\) \(\newcommand{\row}{\text{Row}}\) \(\newcommand{\col}{\text{Col}}\) \(\renewcommand{\row}{\text{Row}}\) \(\newcommand{\nul}{\text{Nul}}\) \(\newcommand{\var}{\text{Var}}\) \(\newcommand{\corr}{\text{corr}}\) \(\newcommand{\len}[1]{\left|#1\right|}\) \(\newcommand{\bbar}{\overline{\bvec}}\) \(\newcommand{\bhat}{\widehat{\bvec}}\) \(\newcommand{\bperp}{\bvec^\perp}\) \(\newcommand{\xhat}{\widehat{\xvec}}\) \(\newcommand{\vhat}{\widehat{\vvec}}\) \(\newcommand{\uhat}{\widehat{\uvec}}\) \(\newcommand{\what}{\widehat{\wvec}}\) \(\newcommand{\Sighat}{\widehat{\Sigma}}\) \(\newcommand{\lt}{<}\) \(\newcommand{\gt}{>}\) \(\newcommand{\amp}{&}\) \(\definecolor{fillinmathshade}{gray}{0.9}\)Introduction
You have already seen that the profile of time-average local fluid velocity \(\overline{u}\) from the bottom to the surface in turbulent flow down a plane is much blunter over most of the flow depth than the corresponding parabolic profile for laminar flow (Figure 4.3.1). This is the place to amplify and quantify the treatment of velocity profiles in turbulent boundary-layer flows.
First I will pose the following question: Can an equation for the velocity profile in a turbulent boundary-layer flow be found by writing an equation like Equation 1.3.6 for turbulent flow and solving for the velocity profile by integration? As noted earlier, Equation 4.2.4, for the distribution of total shear stress in the flow, is valid for turbulent flow as well as for laminar flow, because no assumptions were made about the nature of internal fluid motions in its derivation, just that the flow must be steady and uniform on the average. And an expression of the same kind as Equation 1.3.6, defining the shear stress, can also be written for turbulent flow:
\[\tau=\mu \frac{d u}{d y}+\eta \frac{d u}{d y} \label{4.12} \]
The term \(\mu(d u / d y)\) is the viscous shear stress due to the mean shear across planes parallel to the boundary. (Actually it’s is a spatial average over an area of such a plane that is large relative to eddy scales, because fluid shear varies from point to point in turbulent flow.) The term \(\eta(d u / d y)\) is a way of writing the turbulent shear stress across these planes that involves an artificial quantity \(\eta\), called the eddy viscosity, that is formally like the molecular viscosity \(\mu\). Everywhere in a turbulent shear flow except very near the solid boundary the eddy viscosity is much larger than the molecular viscosity, because turbulent momentum transport is dominant over molecular momentum transport. (Often \(\eta\) is written as \(\rho \varepsilon\), where \(\varepsilon\) can be viewed as the kinematic eddy viscosity, in analogy with \(ν\); \(\varepsilon\) is also called the eddy diffusion coefficient.) Just as for laminar flow, the expressions for \(\tau_{\text{o}}\) in Equation \ref{4.12} and Equation 1.3.6 can be set equal to give a differential equation for \(u\) as a function of distance \(y\) from the boundary:
\[(\mu+\eta) \frac{d u}{d y}=\gamma \sin \alpha(d-y) \label{4.13} \]
Unfortunately there is always an insuperable problem in integrating Equation \ref{4.13}, or any other equation like it for turbulent flow in a conduit or channel with some other geometry, to find the velocity distribution. Unlike the molecular viscosity \(\mu\), the eddy viscosity \(\eta\), rather than being a property of the fluid, depends upon the flow: it varies with height above the boundary, because the turbulent shear stress it represents is a function of the flow itself, for which we are trying to solve. We are therefore always forced to find the velocity distribution in turbulent flow by experiment.
It is important to realize, however, that experiments to find the velocity profile do not have to be blindly empirical: physical reasoning can be used to guess which effects and therefore which variables are important in governing the velocity distribution in the various layers of the flow. If the functional relationships thus specified by the dimensional structure of the problem are consistent with the observational results, then the correctness of that qualitative view of the physics is confirmed. In fact, much of what is known about turbulent flow past solid boundaries has been learned in this way.
We will stick with steady and uniform flow down a plane, but exactly the same kind of analysis could be made for flow in a closed conduit. Think about which variables you have to specify to take full account of the profile of time-average velocity u along an imaginary line through the flow, normal to the bottom boundary, stretching from the bottom to the free surface (Figure \(\PageIndex{1}\)).
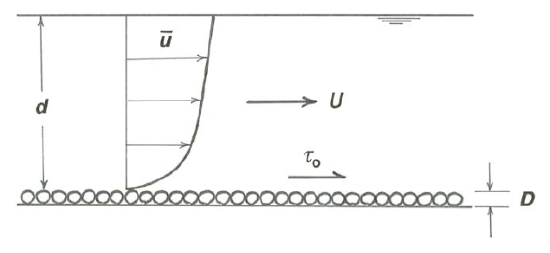
The bottom can be either smooth or rough. As in the flow-resistance problem, make the assumption (not a good one, but it gets us started) that the roughness can be characterized by the size \(D\) of the elements without having to worry about their shape and arrangement. The boundary shear stress \(\tau_{\text{o}}\) is the best variable to use to characterize the strength of the flow. You should expect that in general the flow depth \(d\) would be needed as well. The viscosity \(\mu\) is needed, because it is tied up with shearing in the fluid. Finally, as in all problems in turbulent flow, the fluid density \(\rho\) is needed, because the fluid experiences local accelerations (in the form of eddies), so fluid inertia is important. So \(\overline{u}\) can be viewed as a function of \(\tau_{\text{o}}\), \(\rho\), \(\mu\), \(d\), and \(D\), and of course the distance \(y\) above the bottom:
\[\overline{u}=f\left(\tau_{0}, \rho, \mu, D, d, y\right) \label{4.14} \]
The dimensionless functional relationship for \(\overline{u}\) is then
\[\frac{\overline{u}}{u .}=f\left(\frac{u_{*} D}{v}, \frac{d}{D}, \frac{y}{d}\right) \label{4.15} \]
where we have made use of the shear velocity \(u_{*}\) and the kinematic viscosity \(ν\) introduced earlier in this chapter. Equation \ref{4.15} says that \(\overline{u} /u_{*}\), a dimensionless version of \(\overline{u}\) (often denoted \(u^{+}\)), should be a function only of the roughness Reynolds number \(u_{*}D/ν\) and the relative roughness \(d/D\) for a given dimensionless position \(y/d\) in the flow. There are alternative possibilities for the three independent dimensionless variables (for example, all three could be put into the form of a Reynolds number, each with a different one of the three length variables), but this is the most natural.
I am sure that all the velocity data you could get your hands on would plot very nicely in a four-dimensional graph using the variables \(\overline{u} /u_{*}\), \(u_{*}D/ν\), \(d/D\), and \(y/d\). But even though the number of variables has been reduced from seven to four, you would still have a burdensome plotting job and a product that would be unwieldy for practical use. Moreover, further careful study would be needed to decipher what the graph is telling you about the physics behind velocity profiles. This is a good place to think about whether the problem can be simplified further by a divide-and-conquer approach wherein certain of the variables are eliminated or modified in certain ranges of conditions to arrive at simpler functions that represent the data well under those conditions. This serves two purposes: it provides useful results, and it helps to clarify the physical effects that are important.
First off, in the next two sections, I will present some ideas about energy in turbulent flow. This may seem out of place here, but it leads to two conclusions that are of great importance for velocity profiles in turbulent flow: that of
- the existence of overlapping inner and outer layers of the flow, in which separate equations for velocity profiles hold, and that of
- the approximate independence of these profiles on the mean-flow Reynolds number.
Further subsections are devoted to the details of velocity profiles in the inner and outer layers of flows for which the diameter of the sediment on the bed is far smaller than the flow depth.
Energy
In making some simplifying assumptions it helps to take a closer look at the nature of turbulence in a channel flow. I will present some arguments that I hope will make some sense to you even though they cannot be developed rigorously here. In what follows, remember that kinetic energy, a quantity \(m v^{2} / 2\) associated with a body with mass \(m\) moving with velocity \(v\), is changed only when an unbalanced force does work on the body, and the change in kinetic energy is equal to the work done. The change in kinetic energy caused by the action of certain forces like gravity can be recaptured without any loss of mechanical energy, but the work done by frictional forces represents conversion of mechanical energy into heat.
I will start with laminar flow because the energy bookkeeping is simpler (Figure \(\PageIndex{2}\)A). The viscous shear stress acting across the shear planes does work against the moving fluid. (Remember that a force does work on a moving body provided that there is a component of the force in the direction of movement of the body, as is the case here.) The viscous shear stress is the mechanism that converts potential energy into heat, the heat then being transferred to the surroundings by conduction or radiation. The particular magnitude of kinetic energy in the flow in the process of this conversion is an outcome of the dynamics of the flow.

In turbulent flow (Figure \(\PageIndex{2}\)B), kinetic energy is contained not just in the mean flow but also in the turbulent fluctuations. Potential energy is again converted to heat, but the way the flow mediates this conversion, and therefore the picture of kinetic energy in the flow, is more complicated. This is because energy is extracted mainly by the work done against the mean motion by the turbulent shear stress rather than by the viscous stress, because at all levels in the flow except very near the bottom the former greatly overshadows the latter. This work done by the turbulent shear stress transforms the kinetic energy of the mean motion into kinetic energy associated mostly with the largest eddies, which have the dominant role in the turbulent shear stress because they are the longest-range carriers of fluid momentum. But not much of this turbulent kinetic energy is converted directly into heat in these large eddies, because they are so large relative to the velocity differences across them that shear rates in them are very small.
Then where does the kinetic energy go? Answer: it is handed down to smaller eddies. This phrase “handed down” might strike you as plausible but unilluminating. Large eddies degenerate or become distorted into smaller eddies in ways not elaborated here, and when this happens the kinetic energy that was associated with the large eddies becomes “transferred to” (that is, is now associated with) the smaller eddies. But the odds are all against smaller eddies organizing themselves again into larger eddies—just watch the breakup of regular flow in a smoke plume to get the sense that the natural tendency in turbulent motions is for larger-scale motions to be broken up into smaller-scale motions. So in terms of kinetic energy, turbulence is largely a one-way street: it passes energy mostly from large scales to small scales, not in the other direction. This effect is called an energy cascade. Shear rates are greatest in the smallest eddies because of their small size relative to the velocity differences across them, and it is in these smallest eddies that most of the kinetic energy is finally converted into heat. In fact, the reason why there is a lower limit to eddy size is that below a certain scale the viscous shear stresses are so strong that they damp out the velocity fluctuations.
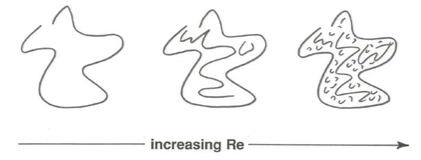
A very significant consequence is that viscosity has a direct effect on turbulence only at the smallest scales of turbulent motion. If the mean- flow Reynolds number is increased, the energy cascade is lengthened at the smallest scales by development of even smaller eddies, but the structure of turbulence at larger scales is not much changed (Figure \(\PageIndex{3}\)). So any bulk characteristic of the flow that is governed by the large-scale turbulence— like the velocity profile, which depends mainly on the turbulent exchange of fluid momentum—should be only slightly dependent on the Reynolds number. This effect is called Reynolds-number similarity.
Inner and Outer Layers
Now back to velocity profiles. I want to convince you that two different but overlapping regions or layers of the flow can be recognized (Figure \(\PageIndex{4}\)) in which the velocity profile depends not on the full list of variables \(\tau_{\text{o}}\), \(\rho\), \(\mu\), \(D\), \(y\), and \(d\) used in the dimensional analysis above but on certain subsets. The advantage is that in each of these layers there is then a simpler functional relationship for the velocity profile, one that leads to a curve in a two-dimensional graph that holds very well for almost the entire range of turbulent channel flows. I will wave my arms a little about the various variables, but of course the most convincing evidence is that this is how things actually work out, as you will see.
Near the bottom boundary, in what I called the buffer zone and for a ways outside it, the turbulence is small-scale and intense, and both production and dissipation of turbulent kinetic energy are known from actual measurements to be at a peak. It is reasonable to view the dynamics of the turbulence, and therefore the nature of the velocity profile, as being controlled by local effects and substantially independent of the nature of the turbulence in the rest of the flow, all the way up to the free surface. This is also true of the viscous sublayer, if one is present, because there the velocity profile is controlled by the strong viscous shear adjacent to the solid boundary. The velocity profile in this inner layer thus depends on \(\tau_{\text{o}}\), \(D\), \(\rho\), \(\mu\), and \(y\), but not on \(d\).
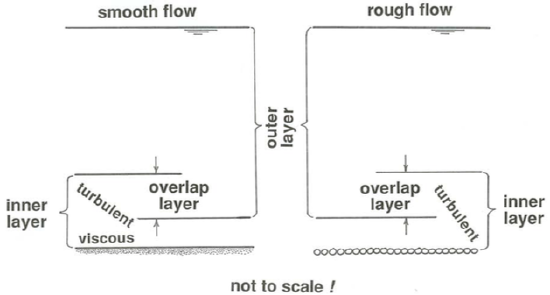
On the other hand, over most of the flow depth, from the free surface all the way down to the top of the buffer layer in smooth flow, you have seen already from the discussion of turbulent energy that the velocity profile should be largely independent of \(\mu\). If the boundary is rough, the profile should be independent of \(D\) as well as of \(\mu\) down to a position just far enough above the roughness elements that the turbulence shed by the elements is not important in the turbulence dynamics. But you should expect the profile to depend on \(d\), because the size of the largest eddies is proportional to the flow depth. The velocity profile in this outer layer (here I have generalized the significance of the concept of the outer layer introduced in an earlier section) should thus depend on \(\tau_{\text{o}}\), \(\rho\), \(d\), and \(y\), but not on \(D\) or \(\mu\).
If you scrutinize the definitions of the inner and outer layers in the last two paragraphs in the light of what I have said about the structure of the flow, you will see that they are likely to overlap. In other words, there is a zone where the velocity profile is at the same time independent of all three variables \(d\), \(\mu\), and \(D\). This should be true so long as the mean-flow Reynolds number is high enough (well beyond the laminar–turbulent transition) that the viscosity-dominated zone near the boundary is very thin relative to the flow depth. (Remember that the thickness of the viscous sublayer decreases as the Reynolds number increases, because the Reynolds number is a measure of the relative importance of inertial forces and viscous forces.)
You are probably thinking by now that I have presented you with a confusion of layers. I will summarize them at this point. On the one hand, in terms of the relative importance of viscous shear stress and turbulent shear stress it is natural to recognize three intergrading but well defined zones (the viscous sublayer, the buffer layer, and the outer layer) or, more generally, a viscosity-dominated layer below and a turbulence- dominated layer above. On the other hand, in terms of importance or unimportance of variables (a related but not identical matter), two overlapping layers can be recognized: an inner layer in which the mean velocity, and other mean characteristics of the flow as well, depends on \(\mu\) or \(D\) (or both) but not \(d\), and the same outer layer in which the mean velocity depends on \(d\) but not on \(\mu\) or \(D\). In rough flow the entire thickness of the flow is dominated by turbulence, and there is no viscosity-dominated layer—but there are still inner and outer layers.
The Law of the Wall for Smooth Boundaries
Look first at the inner-layer velocity profile over a physically smooth bottom boundary. From what was just said about the inner layer,
\[\overline{u}=f\left(\tau_{0}, \rho, \mu, y\right) \label{4.16} \]
or in dimensionless form,
\[\frac{\overline{u}}{u}=f\left(\frac{\rho u_{*} y}{\mu}\right) \label{4.17} \]
Equation \ref{4.17} states that the velocity \(u\) , nondimensionalized using \(u_{*}\), depends only on \(y^{+}\), the dimensionless distance from the bottom. So the velocity profile should be expressible as a single curve for all turbulent channel flows with smooth bottom boundaries. Equation \ref{4.17} is the general form of what is called the law of the wall for smooth boundaries.
You should expect the velocity profile expressed in Equation \ref{4.17} to be in two parts, one corresponding to the viscous sublayer and the other to the outer part of the inner layer, where turbulent shear stress predominates over viscous shear stress. These two parts of the profile have to pass smoothly one from the other in the intervening buffer layer. Because fluid accelerations are unimportant in the viscous sublayer, \(u\) there depends on \(\tau_{\text{o}}\), \(\mu\), and \(y\), but not on \(\rho\):
\[\overline{u}=f\left(\tau_{0}, \mu, y\right) \label{4.18} \]
The only way to write Equation \ref{4.18} in dimensionless form is
\[\frac{\mu u}{\tau_{o} y}=\mathrm{const} \label{4.19} \]
because there is only one way to form a dimensionless variable from the four variables \(\overline{u}\) , \(\tau_{\text{o}}\), \(\mu\), and \(y\). Equation \ref{4.19} can be juggled algebraically a little by introducing \(\rho\) on both sides, for no other reason than to put it in the same form as Equation \ref{4.17}:
\[\frac{\overline{u}}{u_{*}}=\mathrm{const} \frac{\rho u_{*} y}{\mu} \label{4.20} \]
The constant in Equation \ref{4.20} turns out to be unity. To get an idea why, go back to Equation 4.2.7, the exact solution for the velocity profile in laminar channel flow. It is reasonable to expect that the velocity profile in the viscous sublayer of a turbulent channel flow is like the velocity profile near the boundary in a laminar channel flow. Points near the boundary in laminar flow, where the velocity gradient \(d\overline{u} /dy\) is very large, are way out on the limb of the parabola in Equation 4.2.7, so the second term on the right in Equation 4.2.7 can be neglected and \(u\) assumed to be a linear function of \(y/d\):
\[\overline{u}=\frac{\tau_{o}}{\mu d}(y d) \label{4.21} \]
When cast in the same form as Equation \ref{4.20}, this becomes
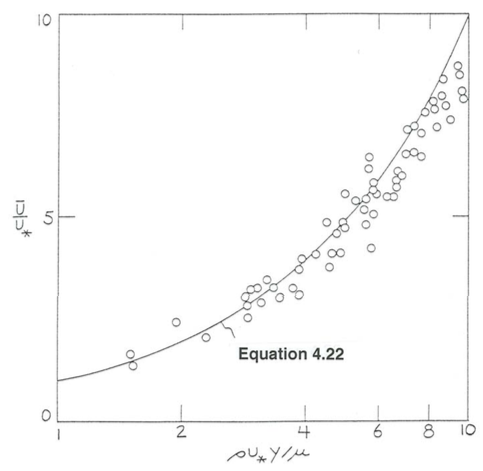
\[\frac{\overline{u}}{u_{*}}=\frac{\rho u_{*} y}{\mu} \label{4.22} \]
Equation \ref{4.22} represents the specific part of the law of the wall for a dynamically smooth flow inside the viscous sublayer. Figure \(\PageIndex{5}\) shows that Equation \ref{4.22} is in good agreement with careful velocity measurements in the viscous sublayer.
In the outer, turbulence-dominated part of the inner layer over a physically smooth bottom, we can assume that \(d\overline{u}/ dy\) does not depend on \(\mu\), because the shear stress and therefore the velocity gradient is determined almost entirely by turbulent momentum exchange (see Equation \ref{4.12}). On the other hand, \(u\) itself must depend on \(\mu\), because the velocity profile in the turbulence-dominated part of the inner layer must be connected to that in the viscosity-dominated part, and you have just seen that the velocity profile in the viscous sublayer depends on \(\mu\). In other words, the velocity at the base of the turbulence-dominated part of the inner layer depends on the velocity at the top of the viscous sublayer, which in turn depends on \(\mu\). The viscosity-dominated part of the profile can be viewed as “anchoring” the turbulence-dominated part of the profile to the bottom, where the velocity is zero by the no-slip condition. So to get the velocity profile we have to start with the velocity gradient, rather than the velocity itself, and write \(d \overline{u} / d y y = f\left(\tau_{0}, \rho, y\right)\) in dimensionless form as
\[\frac{y}{u_{*}} \frac{d u}{d y}=A \label{4.23} \]
where \(A\) is a dimensionless constant that should hold in this particular layer for all turbulent channel flows over smooth boundaries, and then integrate to obtain the dimensionless velocity profile:
\[\frac{\overline{u}}{u_{*}}=A \ln y+A_{1} \label{4.24} \]
where \(A_{1}\), also dimensionless, is a constant of integration. By the concept of Reynolds-number similarity discussed above, \(A\) should be very nearly constant provided that the Reynolds number is high enough for the turbulence to be fully developed.
Note that Equation \ref{4.24} does not contain \(\mu\) explicitly, but from what was said above, \(\mu\) has to be in there somewhere. The resolution of this seeming paradox is that the constant of integration \(A_{1}\) must depend upon \(\mu\). You can verify that this is so by noting that Equation \ref{4.24} can be put into the general form of the law of the wall given by Equation \ref{4.17} if and only if \(A_{1}\) is equal to \(A \ln \left(\rho u_{*} / \mu\right)+B\): putting this expression for \(A_{1}\) into Equation \ref{4.24},
\(\frac{\overline{u}}{u_{*}}=A \ln y+A \ln \frac{\rho u_{*}}{\mu}+\mathrm{B}\)
\[=A \ln \frac{\rho u_{*} y}{\mu}+B \label{4.25}\]
The constant \(B\) is just the residuum of the constant of integration after \(A \ln \left(\rho u_{*} / \mu\right)\) has been extracted.
There is no universal agreement in the literature on the values of the constants \(A\) and \(B\): \(A\) is usually taken to be between \(2.4\) and \(2.5\), and \(B\) is taken to be between \(5\) and \(6\). The small differences in \(A\) and the larger differences in \(B\) from source to source are an understandable result of fitting straight lines in semilogarithmic plots of slightly scattered data from diverse experimental studies. Discussions on the values of these constants can be found in Monin and Yaglom (l971) and Hinze (1975). With the commonly used values \(A = 2.5\), \(B = 5.1\), Equation \ref{4.25} becomes
\[\frac{\overline{u}}{u_{*}}=2.5 \ln \frac{\rho u_{*} y}{\mu}+5.1 \label{4.26} \]
The constant \(A\), which is a reflection of the nature of turbulent momentum transport in the inner layer, is often written 1\(/ \kappa\), and \(\kappa\) is called von Kármán’s constant. Thus, \(\kappa\) has a value very nearly \(0.4\). The reason \(A\) is written as \(1/\kappa\) is historical, not fundamental. Also, you should expect a weak dependence of \(A\) on the mean-flow Reynolds number. The exact nature of variation of \(A\) with the Reynolds number, and with the suspended- sediment concentration in sediment-transporting flows as well, has been controversial.
Equation \ref{4.26} shows that the velocity profile is expressed by a single curve for the turbulence-dominated part of the inner layer, just as was the case for the viscosity-dominated part. It is the profile given by Equation \ref{4.26} that is usually called the law of the wall, although that term more properly describes the whole inner-layer profile, viscosity-dominated and turbulence-dominated, plus the transition between.
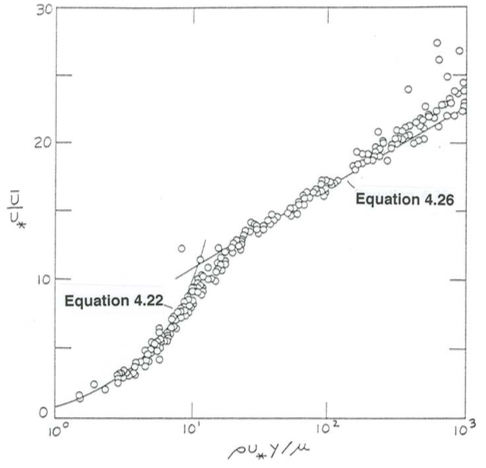
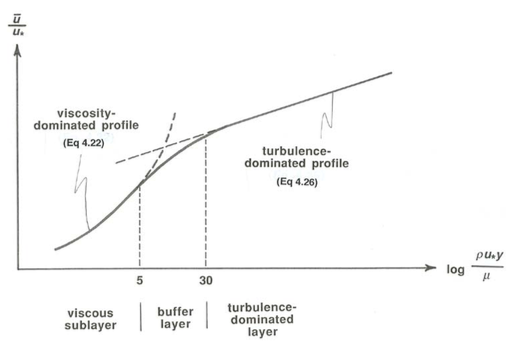
In summary, time-average velocity \(u\) in the inner layer over a smooth boundary, when nondimensionalized by dividing by \(u_{*}\), should plot as a single curve as a function of \(y^{+}\), the dimensionless distance above the bottom. Figure \(\PageIndex{6}\), which incorporates the data already plotted in Figure \(\PageIndex{5}\) for the viscous sublayer, shows the velocity profile through the whole of the inner layer over a smooth boundary. This profile represents the complete law of the wall for smooth boundaries. The data points in the viscosity-dominated part of the inner layer follow Equation \ref{4.22}; the data points in the turbulence-dominated part of the inner layer follow Equation \ref{4.26}, which plots here as a straight line because of the semilogarithmic coordinates.
Between \(y^{+}\) values of about \(5\) and about \(30\) in Figure \(\PageIndex{6}\) there is a smooth transition between the viscosity-dominated profile (Equation \ref{4.22}) and the turbulence-dominated profile (Equation \ref{4.26}); see Figure \(\PageIndex{7}\). This is the buffer layer, where viscous shear stress and turbulent shear stress are both important. For \(y^{+} < 5\) the turbulent shear stress is negligible, and Equation \ref{4.22} describes the profile; for \(y^{+} > 30\) the viscous shear stress is negligible, and Equation \ref{4.26} describes the profile. It is in wall-law plots like Figure \(\PageIndex{6}\) that the lower and upper limits of the buffer layer are most clearly manifested. You will see a variety of lower and upper limiting \(y^{+}\) values mentioned in the literature; this is understandable, because the divergence of the curves given by Equations \ref{4.22} and \ref{4.26} from the actual profile is gradual. Although it is of no great physical significance, the height of intersection of Equations \ref{4.22} and \ref{4.26} in the buffer layer is at \(y^{+} = 11\), as you can see from Figure \(\PageIndex{6}\). What is of greater significance is that the turbulent shear stress and the viscous shear stress are found experimentally to be equal at a slightly larger \(y^{+}\) value of about \(12\); this is in a sense the “middle” of the buffer layer.
The dimensionless height \(y^{+}\) above the boundary at which \(\overline{u} / u_{*}\) begins to deviate from the law of the wall depends on the mean-flow Reynolds number \(\text{Re}\); it ranges upward from around \(500\) at small \(\text{Re}\) to over \(1000\) at larger \(\text{Re}\). For \(y^{+}\) greater than this, \(\overline{u} / u_{*}\) is greater than predicted by the law of the wall.
How thick is the inner layer? The upper limit of \(y^{+}\) for the law of the wall at high Reynolds numbers for open-channel flow is not well established, but assume a \(y^{+}\) value of \(1000\) in a flow of room-temperature water 1 \(\mathrm{m}\) deep at a mean flow velocity of 0.5 \(\mathrm{m} / \mathrm{s}\). Then \(y\) at the outer limit of the inner layer is about 5 \(\mathrm{cm}\). (To figure this out, compute \(\text{Re}\), use the smooth-flow curve in Figure 4.6.7 to get \(f\) and therefore \(\tau_{\text{o}}\), and put that into \(y^{+}\).) So the inner layer occupies only a small percentage of the flow depth, no more than \(10-20 \%\). And the viscous sublayer in this flow is only a fraction of a millimeter thick. Note that the logarithmic abscissa axis in plots like Figure \(\PageIndex{6}\) crowds the whole outer layer, in which Equation \ref{4.26} no longer holds, into a small part of the graph.
Most of the data points in Figure \(\PageIndex{6}\) are from flows in circular pipes and rectangular ducts rather than from open-channel flows. But data from open-channel flows, and from boundary layers developing on flat plates as well, are consistent with those from flow in pipes and ducts. This emphasizes the important point that the law of the wall holds for a wide variety of geometries of outer-layer flow. From the earlier discussion of variables important in the inner and outer layers, this should be no surprise: the flow in the inner layer is governed by local effects and is independent of the nature of the outer flow. In fact, the law of the wall is even more general: although we won’t pursue the matter here, the law of the wall holds even when there is a substantial pressure gradient (negative or positive) in the direction of flow, resulting in downstream acceleration or deceleration.
The Law of the Wall for Rough Boundaries
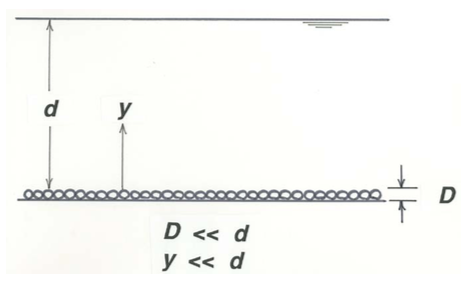
In many turbulent boundary-layer flows, the boundary is not physically smooth but instead is occupied by, or is covered by, or consists of, roughness elements of some kind. By the term roughness element I mean any local part of the boundary that protrudes above the overall or average boundary surface. Such things as buildings, trees, crops, people, water waves, sand particles, boulders, or corrosion scales come readily to mind. In what follows, we will assume (Figure \(\PageIndex{8}\)) that the roughness elements are much smaller than the flow depth \((D << d)\) and that the layer of the flow we will consider, for now, has a thickness that is not a large fraction of the flow depth \((y << d)\). Provided that the roughness elements are not much smaller than the thickness of the viscous sublayer, the velocity profile in the boundary layer depends on the size, shape, and arrangement of the roughness elements as well as on \(\tau_{\text{o}}\), \(\rho\), \(\mu\), and \(y\):
\[\overline{u}=f\left(\tau_{o}, \rho, \mu, y, \text { roughness geometry) }\right. \label{4.27} \]
where the roughness geometry is specified by the size distribution, the shape distribution, and the plan-view packing or arrangement of the roughness elements.
To make any progress we have to be specific about the nature of the roughness. Assume here that the roughness is composed of fairly well sorted mineral sediment particles with the usual natural range of particle shape and roundness, and that the particles form a full sediment bed that is planar on a large scale. Roughness of this kind, called close-packed granular roughness by fluid dynamicists, is fairly well characterized by the single variable \(D\), the mean or median particle size. This roughness is the best-studied kind, and it is important in a great many natural water flows over sediments, but there are many other kinds of roughness, in both nature and technology.
With the above simplifications, Equation \ref{4.27} becomes
\[\overline{u}=f\left(\tau_{0}, \rho, \mu, y, D\right) \label{4.28} \]
or, in dimensionless form,
\[\frac{\overline{u}}{u_{*}}=f\left(\frac{\rho u_{*} y}{\mu}, \frac{\rho u_{*} D}{\mu}\right) \label{4.29} \]
So for flow over rough boundaries the dimensionless velocity \(u/u_{*}\) generally depends not only on \(y^{+}\) but also on the boundary Reynolds number. Equation \ref{4.28}, which could also be written using \(y/D\) instead of \(\rho u_{*} D / \mu\), is called the law of the wall for granular-rough boundaries.
Two different aspects of the effect of the roughness on the velocity profile become apparent upon examination of Equation \ref{4.29}. First, the size of the roughness elements relative to the thickness of the viscous sublayer is important. Remember from the section on smooth flow and rough flow earlier in this chapter that if \(D\) is much smaller than the viscous length scale \(\mu/\rho u_{*}\) the roughness elements are embedded in the viscous sublayer, whereas if \(D\) is much larger than \(\mu / \rho u_{*}\) there is no viscous sublayer and the roughness elements are enveloped in turbulence generated by flow separation around upstream elements. You should suspect, then, that for very small \(\rho u_{*} D / \mu\) (less than about \(5\), for which viscous-sublayer thickness and roughness height are about equal), the roughness has no effect on the velocity profile. Under these conditions the velocity profile over physically rough boundaries is indeed found to coincide with that over physically smooth boundaries—provided that we do not place our velocity meter so close to the bed that individual roughness elements distort the velocity field. The law of the wall for smooth boundaries, Equations \ref{4.22} and \ref{4.26} together with the transition between them through the buffer layer, therefore holds for flows with \(\rho u_{*} D / \mu<5\) over physically rough boundaries also. These are the flows that in the section on flow resistance were termed dynamically smooth even though physically rough and were shown to fall on the curve for physically smooth boundaries in the resistance diagram in Figure 4.6.7. For very large \(\rho u_{*} D / \mu\), however, there is no viscous sublayer and therefore no effect of \(\mu\) on the velocity profile, and you should expect to see a velocity profile that is rather different from the law of the wall for smooth flow. The next two subsections are devoted to the velocity profile in these dynamically rough flows.
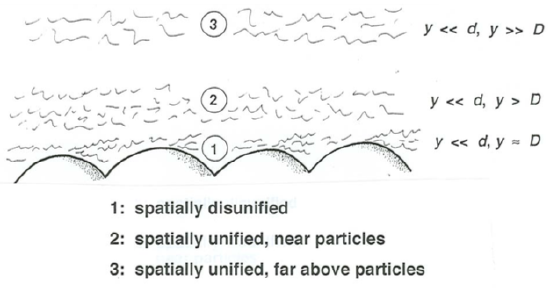
Second, in the case of rough flow the value of \(y\) relative to \(D\) is important (Figure \(\PageIndex{9}\)). For \(y \approx D\), at points in the flow that are nestled among the roughness elements themselves or are just a few roughness heights above the tops of the roughness elements, the velocity depends in a complicated way on the shapes of the roughness elements and on the position of the profile relative to individual elements, and we should not expect to find any generally applicable profile; the velocity profile could be said to be spatially disunified. A bit higher in the flow, several diameters above the tops of the elements, the wakes shed by individual elements blend together in such a way that the velocity profile is about the same at all positions, but the flow structure is still affected by the roughness- generated turbulence. Far above the tops of the elements, however, for \(y>> D\), it is reasonable to expect that the turbulence structure is governed by local dynamics, as in smooth flow, and not by the wakes from the little roughness elements far below. If \(D\) is sufficiently smaller than the flow depth \(d\), there should then be a layer of the flow for which \(y << d\) and \(y >> D\) at the same time—that is, a part of the inner layer in which roughness-generated turbulence is not of direct importance. Remember, however, that by analogy with what was said about smooth flow above, this part of the profile still has to be anchored at its lower end to that part of the velocity profile controlled by the roughness-generated turbulence.
In the following I will present the velocity profile in rough flows for which there is indeed a zone for which \(y << d\) but at the same time \(y >> D\) (or, more precisely, above the near-bed layer of spatial disunification of the profile, which is something like several roughness heights above the tops of the roughness elements). I will deal only with the region far enough above the bed that the roughness elements do not affect the profile shape; this could be called “the inner layer far above the roughness elements”. I will make only a few brief comments about the equally important flows in which there is no zone for which \(y << d\) and \(y >> D\), examples being shallow flows in gravel-bed streams.
In the part of the inner layer for which \(y >> D\), neither \(\mu\) nor \(D\) affects the slope of the velocity profile. We can therefore make exactly the same statement as for the turbulence-dominated part of the inner layer in physically smooth flow: the velocity gradient \(d \overline{u} /dy\) depends only on \(\tau_{\text{o}}\), \(\rho\), and \(y\). This leads again to Equation \ref{4.23}, and upon integration, to Equation \ref{4.24}. We should even expect the constant \(A\) to be the same, because it is a manifestation of the vertical turbulent transport of streamwise fluid momentum, and we just concluded that sufficiently far from the boundary the structure of the turbulence depends only on local effects and is independent of the turbulence shed by the boundary roughness. The constant of integration \(A_{1}\), however, is different, because it depends on the nature of the connecting velocity profile nearer the boundary, which is different from that in smooth flow. This latter difference has to do with the relative importance of viscous shear stress and turbulent shear stress near the boundary, and with the relative importance of viscous drag and pressure drag at the boundary: if \(D>>\mu / \rho u_{*}\) (I termed such flows fully rough), viscous shear stress in the flow and viscous drag on the boundary are negligible, so not only the velocity gradient but also the velocity itself is unaffected by μ in the layer under consideration here.
We can rearrange Equation \ref{4.24} to obtain Equation \ref{4.25} just as in the case of smooth flow, but with one important difference: by comparison with the general form of the law of the wall for rough flow (Equation \ref{4.29}), the term \(B\) is now not a constant but instead a function of the boundary Reynolds number:
\[\frac{\overline{u}}{u_{ .}}=A \ln \frac{\rho u_{*} y}{\mu}+f\left(\frac{\rho u_{*} D}{\mu}\right) \label{4.30} \]
Equation \ref{4.30} can be put into an equivalent but more revealing and more useful form by splitting \(f\left(\rho u_{*} D / \mu\right)\) into two parts: \(-A \ln \left(\rho u_{*} D / \mu\right)\) plus a remainder that is some different function of \(\rho u_{*} D / \mu\), which I will call \(B^{\prime}\). The only reason for this otherwise arbitrary choice is that now Equation \ref{4.30} can be written
\(\frac{\overline{u}}{u_{*}}=A\left(\ln \frac{\rho u_{* }y}{\mu}-\ln \frac{\rho u_{*} D}{\mu}\right)+\mathrm{B}^{\prime}\)
\[=A \ln \frac{y}{D}+B^{\prime} \label{4.31} \]
Equation \ref{4.31} is neater than Equation \ref{4.30}, but remember that \(B^{\prime}\) is a function of \(\rho u_{*} D / \mu\). If \(\rho u_{*} D / \mu\) is sufficiently large, however, so that \(D\) is large relative to what the viscous-sublayer thickness would be, turbulence extends down among the roughness elements and there is no viscosity-dominated layer next to the bottom. The velocity profile then cannot depend on \(\mu\) and therefore not on \(\rho u_{*} D / \mu\), so \(B^{\prime}\) in Equation \ref{4.31} is a constant, which has a value of about \(8.5\) for uniform, close-packed sand-grain roughness. (There is about as much uncertainty about this constant as there is about the constant \(B\) in Equation \ref{4.25}.) The value of \(B\) has indeed been found experimentally to become constant for \(\rho u_{*} D / \mu > 60\). It is under these conditions that the flow was termed fully rough in the earlier section on flow resistance. Equation \ref{4.31} can then be written as Equation \ref{4.32}, the law of the wall for fully rough flow:
\[\frac{\overline{u}}{u_{*}}=2.5 \ln \frac{y}{D}+8.5 \label{4.32}\]
Figure \(\PageIndex{10}\) shows Equation \ref{4.32} together with the data from Nikuradse (1933) on which the value of \(8.5\) for \(B^{\prime}\) was originally derived. Nikuradse’s data were obtained for a particular geometry of granular roughness manufactured by gluing a somewhat open monolayer of subrounded and almost single-size sand to the inner walls of circular pipes. You should expect the value of \(B^{\prime}\) to be different for different roughness geometries, even if the average roughness height is the same, because the shape and arrangement of the roughness elements would be different, and this affects the details of the turbulence structure right near the boundary and thus also the velocity profile right near the boundary.
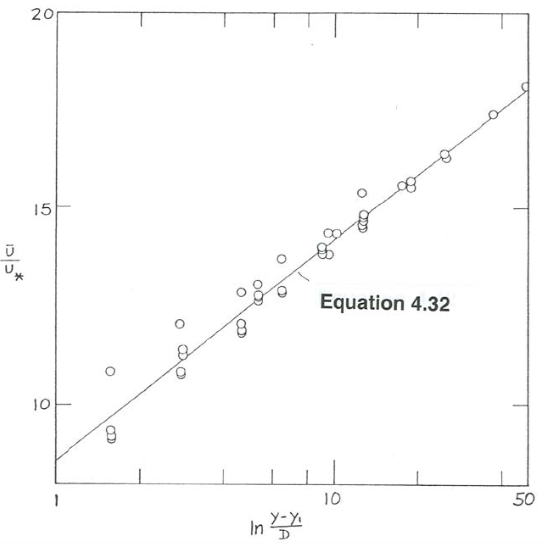
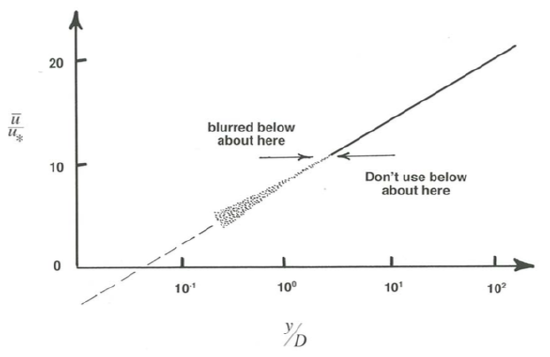
Figure \(\PageIndex{11}\) is another plot of Equation \ref{4.32}, this time without the data points. It is meant to serve as a warning about how close to the boundary Equation \ref{4.32} actually applies. Recall that at heights no greater than a few roughness-element sizes, the flow can be said to be spatially disunified (see Paragraph 114 above), and in that region the basis for derivation of Equation \ref{4.32} no longer holds. That is emphasized, in cartoon form, by the blurring of the profile near the rough boundary.
As is commonly done, you can preserve the value of \(8.5\) for \(B^{\prime}\) in Equation \ref{4.31} and use for \(D\) the fictitious diameter of single-size sand grains in a uniform monolayer that makes Equation \ref{4.31} fit the velocity data best. That size is called the equivalent sand roughness, usually denoted \(k_{s}\). (A more descriptive term would be the “equivalent Nikuradse- style sand roughness”.) In other words, \(k_{s}\) for any given bed roughness, of any kind whatever, is the uniform-sand-grain height that gives the same wall-law velocity distribution for a given value of \(\tau_{\text{o}}\). On the face of it this seems like a neat way around the problem of what the value of \(B^{\prime}\) is, but keep in mind that to determine \(B^{\prime}\) in the first place you need to measure both the velocity profile and the boundary shear stress, independently, at the same time.
For \(5<\rho u_{*} D / \mu<60\) the flow is said to be transitionally rough. The velocity profile is still a semilog straight line for \(y >> D\), whether \(\overline{u} /u_{*}\) is plotted against \(\rho u_{*} y / \mu\) as in Figure \(\PageIndex{6}\) or against \(y/D\) as in Figure \(\PageIndex{10}\), and it still has the same slope given by the universal constant \(A\). But the position of the straight line varies as the near-bed part of the profile changes from the smooth-flow profile shown in Figure \(\PageIndex{6}\) to the fully rough profile shown in Figure \(\PageIndex{10}\). For transitionally rough flows, the law of the wall in the innermost region, where there is some dependence on \(\mu\), cannot be derived in the form of a simple equation like Equation \ref{4.26} or Equation {4.31}; keep in mind, however, that some form of the general law of the wall for rough boundaries (Equation \ref{4.30}) holds there nonetheless.
Finally, if \(\rho u_{*} D / \mu\) is very small the roughness elements are deeply embedded in the viscous sublayer and can have no effect on the structure of the turbulence and the shape of the velocity profile above the viscous sublayer. The velocity profile is then the same as if the boundary were physically smooth. As discussed earlier in the section on flow resistance, the flow is dynamically smooth even though physically rough.
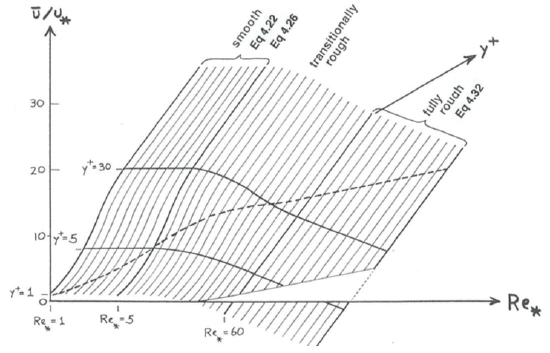
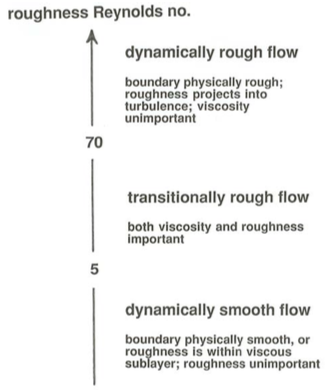
Figure \(\PageIndex{12}\), a combined plot of the law of the wall in smooth and rough flows, summarizes much of what is in this section and the previous one (see also Figure \(\PageIndex{13}\)). The three-dimensional surface in Figure \(\PageIndex{12}\), drawn by use of Equations \ref{4.22}, \ref{4.26}, and \ref{4.32}, shows \(\overline{u} /u_{*}\) as a function of \(y^(+)\) and \(\text{Re}_{*}\). In smooth flows, represented by the left-hand part of the surface, the velocity profiles do not depend on \(\text{Re}_{*}\), so the surface is a cylinder whose elements are parallel to the \(\text{Re}_{*}\) axis. Each of the several profiles shown, which represent intersections of the surface with planes for which \(\text{Re}_{*} = const\), is exactly the same as that in Figure \(\PageIndex{6}\). In fully rough flows, represented by the region to the right of the plane \(\text{Re}_{*} = 60\), the velocity profiles depend only on \(y/D\). To see why the right-hand part of the surface slopes downward to the right, write \(\ln (y / D)\) as \(\ln \left(\rho u_{*} y / \mu\right)-\ln \left(\rho u_{*} D / \mu\right)\), or \(\ln y^{+}-\ln \mathrm{Re}_{*}\); thus, the larger the value of \(\text{Re}^{*}\), the smaller the value of \(\overline{u} / u_{*}\) for a given value of \(y^{+}\). Because there is no viscous sublayer or buffer layer to contend with, the profiles are straight lines all the way down to positions not far above the tops of the roughness elements. The rough-wall profile deviates from a semilog straight line within several roughness heights above the tops of the roughness elements—to say nothing of the spatial disunification of the velocity profile that sets in at a level just above the tops of the roughness elements. Only at points on the surface in Figure \(\PageIndex{12}\) well above the dashed curve that expresses the condition \(y = D\) are the profiles valid; the part of the surface shown in the lower right is therefore useful only hypothetically, for displaying the nature of the relationships. Finally, in the middle part of the surface the profiles are transitional between the smooth and the fully rough profiles. Here the lines for \(y^{+} = 5\) and \(y^{+} = 30\) shown on the left-hand part of the surface lose their physical significance as the viscous sublayer disappears.
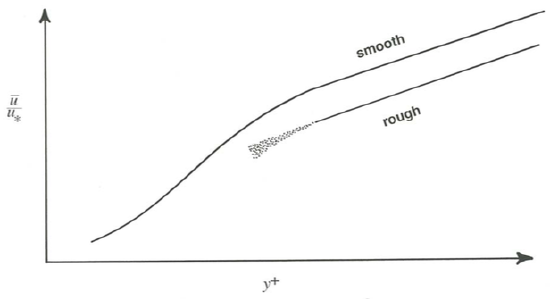
Note in Figure \(\PageIndex{12}\) that at any value of \(y^{+}\) well up in the inner layer \(\overline{u} /u_{*}\) in any rough flow is less than \(\overline{u} /u_{*}\) in any smooth flow, although the slopes of the profiles for the two flows are the same at that height. This is because nearer the bottom the velocity increases more sharply with distance from the bottom in smooth flow than in rough flow. Figure \(\PageIndex{14}\) shows that effect, in cartoon form: the profile for rough flow lies everywhere below the profile for smooth flow. You can think of the two profiles shown in Figure \(\PageIndex{14}\) as being representative of the left and right extremes of the surface shown in Figure \(\PageIndex{12}\), given that the surface slopes downward to the right in Figure \(\PageIndex{12}\).
A conventional additional step that is taken with Equation \ref{4.31} is to write \(B^{\prime}\) in the form \(-A \ln \left(y_{0} / D\right)\), where the quantity \(y_{\text{o}}\), with the dimensions of length, is called the roughness length. (Outdoors fluid dynamicists like meteorologists take the normal-to-boundary coordinate direction to be \(z\), so they deal with \(z_{\text{o}}\), not \(y_{\text{o}}\).) Note: if you read the literature on velocity profiles in natural flow environments, you are likely to encounter this roughness length, rather than the equivalent quantities I have used earlier in this section.
Use of \(y_{\text{o}}\) allows \(B^{\prime}\) to be completely absorbed into the log term in Equation \ref{4.32}:
\(\frac{\overline{u}}{u_{*}}=A \ln \frac{y}{D}-A \ln \frac{y_{o}}{D}\)
\[=A \ln \frac{y}{y_{o}} \label{4.33} \]
By the definition of the natural logarithm, \(y_{\text{o}}\) can be written in terms of \(B^{\prime}\) as \(y_{0}=D \exp \left(-B^{\prime} / A\right)\).
If the flow is only transitionally rough, \(y_{\text{o}}\) is a function of \(\rho u_{*} D / \mu\), as is \(B^{\prime}\). If the flow is fully rough, however, \(y_{\text{o}}\) is independent of \(\rho u_{*} D / \mu\) for the same reason that \(B^{\prime}\) in Equation \ref{4.30} is independent of \(\rho u_{*} D / \mu\).
Note
Warning: don’t confuse \(y_{\text{o}}\) with the actual roughness height \(D\): for a given geometry of roughness in fully rough flow \(y_{\text{o}}\) is proportional to \(D\) (for close-packed uniform sand-grain roughness \(y_{0}=D / 30\)), but the proportionality coefficient varies considerably depending upon the particular geometry of the roughness.
Setting \(y\) equal to \(y_{\text{o}}\) in Equation \ref{4.33} gives \(\overline{u} / u_{*}=0\). So another way of looking at \(y_{\text{o}}\) is that it is the height at which the velocity would become zero if the logarithmic rough-wall equation for the velocity profile could be extended down to that height. It is important to remember, however, that Equation \ref{4.33} becomes inapplicable far above that position, which is nestled in among the roughness elements. (That is why I used the contrary-to-fact “subjunctive” verb construction in the preceding sentence.) See the very brief comments in the next paragraph.
We still have not considered the lowermost part of the inner layer, not far above the tops of the roughness elements. For sand-size bed roughness this region is not much more than a few millimeters thick, but for water flowing over gravels or for wind blowing over large ground-surface roughness like buildings or vegetation it may be decimeters or even meters thick, and no sophisticated, miniaturized velocity meters are needed to include it in measured velocity profiles. At positions this close to the bed, two complications arise: the logarithmic profile becomes distorted, and there is no obvious choice for \(y = 0\).
Velocity Defect Law
Now look at the velocity profile in the outer layer. There the velocity is most naturally specified relative to that at the boundary with the free stream (or, in the case of free-surface flow, relative to the surface velocity, or in the case of pipe flow, relative to the centerline velocity), because we have seen that the inner layer, with a different relationship for the velocity, intervenes between the outer layer and the bottom boundary. In other words, if we look at the velocity relative to that at the surface we do not have to worry about how the velocity is anchored to the bottom through the inner layer. So instead of \(\overline{u}\) we use \(U_{s}-\overline{u}\), called the velocity defect, where \(U_{s}\) is the surface (i.e., maximum) velocity.
If you go back and review the discussion in the section on inner and outer layers you will see that the structure of the turbulence in the outer layer should depend on \(\tau_{\text{o}}\), \(\rho\), \(y\), and \(d\), but not on \(\mu\), for the same reason that the velocity profile in the turbulence-dominated part of the inner layer does not depend on \(\mu\). Because this is true from the free surface down to the bottom of the outer layer, and because \(U_{s}-\overline{u}\) characterizes the velocity relative to the free surface rather than the bottom, then not just the velocity gradient \(d\overline{u} /dy\) (as in the turbulent part of the inner layer) but also \(U_{s}-\overline{u}\) itself is independent of \(\mu\). Turbulence structure and \(U_{s}-\overline{u}\) should not depend on \(D\) either, provided that \(D << d\). So the general form of the velocity-defect profile is
\[U_{s}-\overline{u}=f\left(\tau_{o}, \rho, y, d\right) \label{4.34} \]
or in dimensionless form
\[\frac{U_{s}-\overline{u}}{u_{*}}=f\left(\frac{y}{d}\right) \label{4.35} \]
Equation \ref{4.35} tells us that the dimensionless velocity defect depends only on the dimensionless height above the bottom. This relationship for the velocity profile in the outer layer is called the velocity-defect law. I will defer further discussion of velocity profiles in the outer part of the flow until the following section, where an examination of the region of overlap between the inner and outer layers affords further insight into the form of the velocity-defect law.
The Overlap Layer; More on the Velocity-Defect Law
One more matter to consider in this exposition of velocity profiles has to do with the overlap layer, where at sufficiently high mean- flow Reynolds numbers the conditions defining the inner and outer layers hold simultaneously; I refer you once more to the earlier section on inner and outer layers. This overlap layer is far enough from the bottom that the flow structure is independent of both viscosity and the characteristics of the bottom roughness but close enough to the bottom that the flow structure is independent of the flow depth (Figure \(\PageIndex{15}\)). Here the inner-layer and outer-layer velocity profiles must match—that is, the velocities given by the law of the wall and by the velocity-defect law at any level in the overlap layer must be the same. The upper limit of the overlap layer is at the top of the inner layer. In smooth flow the lower limit is at the top of the buffer layer. With regard to the lower limit in rough flow, presumably the velocity-defect representation of the velocity profile, which looks downward from the free surface and can ignore the details of the bottom roughness, must start to break down when it reaches the lower part of the inner layer, where you have seen that the roughness causes the inner-layer profile to curve away from a semilog straight line.
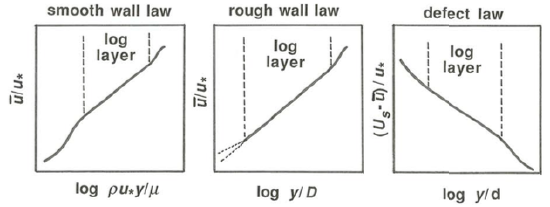
The constraints imposed by the matching requirement on the form of both the wall law and the velocity-defect law in the overlap layer were first perceived by Izakson (1937) and Millikan (1939). The mathematical consequence of this matching, which I will not detail here, is that in the overlap layer—but not farther out, beyond the inner layer—the velocity-defect law as well as the wall law is of logarithmic form. The overlap layer is often called the logarithmic layer, because in it both the wall law and the defect law are logarithmic.
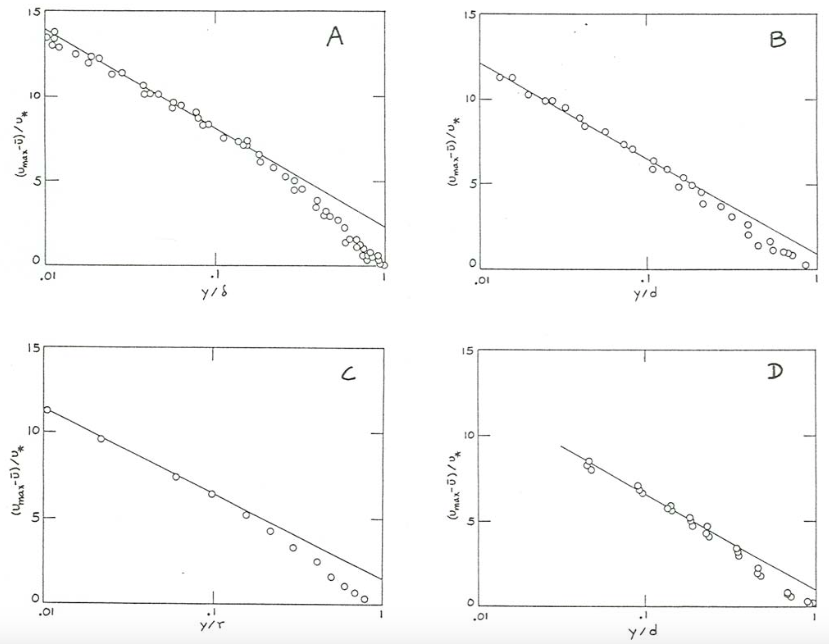
Figure \(\PageIndex{16}\) shows velocity-defect profiles on flat plates and in pipes, wide planar ducts, and open channels. The open-channel data, from Coleman (1981), are for a width-to-depth ratio of only about \(2\), but I have not been able to find any better data; the scarcity of good published data on complete velocity profiles from surface to bottom in steady uniform open-channel flows at large ratios of width to depth is striking. In each graph in Figure \(\PageIndex{16}\) the data points define a single curve that holds for a wide range of mean-flow Reynolds numbers, indicating that our assumptions about the controls on velocity and turbulence in the outer layer are justified. In each graph there is a well-defined semilog straight-line segment for fairly small \(y/d\); that is the log layer. Toward the position of maximum velocity at \(y/d = 1\) the profile breaks away from the semilog straight line to reach the point \((U_{s} - \overline{u} )/u_{*} = 0\) at the position of maximum velocity.
The differing shape of the outer part of the velocity-defect profile in different geometries of flow is to be expected because of differing physical effects in the movement and geometry of large eddies in the region of the flow farthest from the solid boundary. Because the outer edge of a freely growing turbulent boundary layer is highly irregular in shape (Chapter 3), at any point near the outer edge passage of large turbulent eddies alternates with passage of nonturbulent fluid, so the efficacy of turbulent momentum exchange is less and the velocity gradient correspondingly steeper than in regions closer to the boundary; this explains the large divergence of the profile from the semilog straight-line segment in Figure \(\PageIndex{16}\A. In pipes and planar ducts the similar but smaller divergence might be explained by the free passage of large eddies across the centerline or center plane from the opposite sides of the flow. In open- channel flow a similar effect might be produced by flattening of large eddies moving toward the free surface. The meager data from open channels suggest an effect similar in magnitude to that in pipes and planar ducts, or perhaps even smaller. There seems to be no reason to expect a perfectly logarithmic profile all the way to the free surface, but the deviations clearly are insubstantial, at least for practical work.
Effects of Roughness Height and Spacing
It is in some ways discouraging to sit back and consider that just about everything said so far about velocity profiles is limited to the case of sediment-free flow over close-packed roughness elements whose size is a tiny fraction of the flow depth. Obviously this is only a small subset of turbulent boundary-layer flows over rough boundaries. The discussion in this section emphasizes mostly the qualitative effects to be expected as
- The height of the roughness elements increases relative to the flow depth.
- The spacing of the roughness elements increases relative to their height.
Figure \(\PageIndex{17}\) summarizes the changes in velocity profile as the size of close-packed granular roughness increases relative to flow depth. In Figure \(\PageIndex{17}\)A the particles are so small (or, more precisely, the roughness Reynolds number \(\rho u_{*} D / \mu\) is so small) that the particles are embedded in a viscous sublayer, and the flow is dynamically smooth. In Figure \(\PageIndex{17}\)B the particles are larger and the flow is dynamically rough, but the particle size is still so small relative to the flow depth that there is a well developed outer layer beyond the overlap layer in which the velocity-defect profile holds but the inner-layer profile does not. These first two cases are covered by the preceding detailed treatment of velocity profiles.
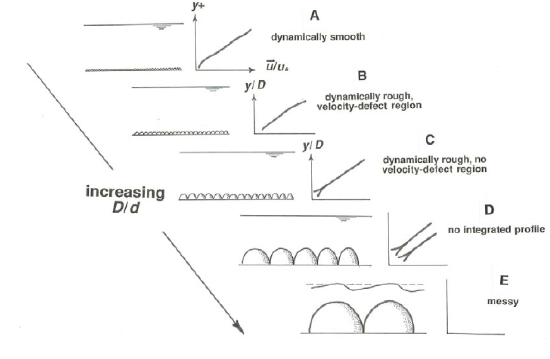
In Figure \(\PageIndex{17}\)C, as the ratio of flow depth to particle size decreases still further, the distinction between inner and outer layers begins to be blurred, and eventually a situation is reached where the entire profile, from bottom to free surface, is affected by the details of the roughness. The whole profile then looks like just the lower part of the wall-law profile in flows with very large values of \(d/D\). This effect begins to become appreciable at \(d/D\) values of something like \(10\) to \(15\).
As \(d/D\) decreases further, an increasingly large fraction of the total flow depth is occupied by the zone of the flow, within one or perhaps two grain diameters above the tops of the roughness particles, where the velocity profile is spatially disunified, in the sense that it varies with position relative to the layout of the particles. As shown in Figure \(\PageIndex{17}\)D in exaggerated form, for \(d/D\) values below about \(2\) or \(3\) most or all of the velocity profile is spatially variable in this way.
What happens as \(d/D\) decreases further (Figure \(\PageIndex{17}\)E) depends on the value of the mean-flow Froude number \(U/(gD)^{1/2}\). (For full appreciation of this point you will have to wait until I have presented more about free-surface flow later, in the next chapter.) For Froude numbers close to or greater than one (i.e., for supercritical or nearly supercritical flow), the free surface is strongly deformed by the presence of the particles just below the surface; think of a shallow fast-flowing mountain stream with a bed of cobbles and boulders. For the same very small \(d/D\) but low Froude numbers, however, the grains rest just beneath a relatively placid water surface, or in the extreme case project above the surface as islands.
Figure \(\PageIndex{18}\) is a cartoon showing the changes in the structure of the flow as the roughness spacing decreases relative to the roughness height. Start with a physically smooth and planar bottom; the flow is dynamically smooth, and \(y = 0\) is naturally taken at the planar bottom. Now take a set of roughness elements whose heights are a very small fraction of the flow depth and begin to place them either randomly or in a regular pattern on the bed. The elements could be three-dimensional bluff bodies or two-dimensional ridges transverse to the flow; the effects are qualitatively the same, at least until the ratio of spacing to height becomes very small.
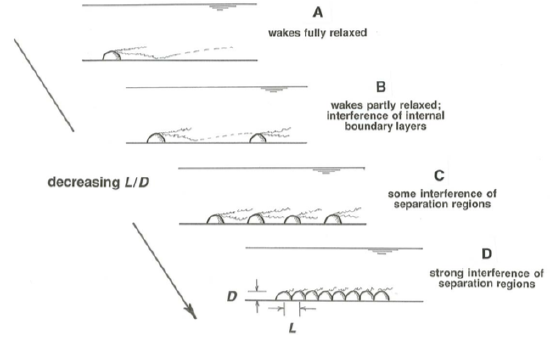
Provided that the roughness Reynolds number (based on the height of the roughness elements being added) is sufficiently large, each element creates a wake as the flow separates around it. From the discussion of flow separation in Chapter 3 you can see that the flow structure downstream of each roughness element is very complicated: the smooth- flow boundary layer is profoundly modified by the development of a highly turbulent shear layer that extends downstream from the separation point. Downstream from each element the flow gradually readjusts toward the boundary-layer structure that would exist in the absence of roughness; the wakes shed by the elements are said to relax. This readjustment or relaxation takes the form of a new lowest layer of the flow, expanding upward at the expense of the turbulent shear layer, in which a turbulence- dominated wall-law profile is established in just the same way as in a boundary layer growing on a flat plate. It takes a surprisingly large number of element heights downstream, something of the order of a hundred, for the process to be completed, whereupon the local structure of the flow shows no trace of the presence of the roughness element upstream and the wall-law layer extends without interruption from the planar bottom up into the region of the flow far above the level of the tops of the large roughness elements. The case of low roughness Reynolds numbers is of less interest here, because then the elements are embedded in a viscous sublayer, but in that case also a deficit in fluid momentum is created downstream of each element even though the flow does not separate, and this deficit is ironed out downstream by viscous shear until the original viscosity-dominated velocity profile is reestablished.
If the roughness elements are sufficiently far apart (Figure \(\PageIndex{18}\)A) each has a long wake extending downstream, but the flow is able to return to normal before it encounters the next roughness element. This has been called isolated-roughness flow (Morris, 1955). The velocity profile measured above a given point on the bed depends on the position of that point relative to the wakes behind the elements. You would have to measure a large number of profiles and average them spatially to obtain a profile that represents the entire flow. Compared with the original smooth- flow profile before emplacement of any roughness elements, the spatially averaged profile shows a deficit of velocity within one or two roughness heights of the bed.
The spatially averaged boundary shear stress \(\tau_{\text{o}}\) is still dominantly viscous, as in the absence of roughness elements, but the contribution of pressure drag to \(\tau_{\text{o}}\) increases with the roughness density. The flow could now be termed transitionally rough, although in a rather different sense from the use of that term in flow over close-packed roughness in earlier sections. Note also that the original flow, before emplacement of roughness elements, can itself be dynamically rough, if the bottom is covered with close-packed roughness that is much smaller than the large, isolated roughness we are adding. Then τo is dominated from the start by pressure drag, but this pressure drag is of two parts: a spatially uniform part produced by the underlying small and close-packed roughness, and a spatially nonuniform part produced by the large and isolated roughness. It takes only a low density of large roughness elements for their contribution to the pressure drag to outweigh that of the close-packed elements.
As we continue to add large roughness elements, a point is reached where the wakes shed by the elements do not relax completely before encountering another roughness element downstream, and with some further increase in density most points in the near-bed flow are within wakes in various stages of relaxation (Figure \(\PageIndex{18}\)B). Now there iss no place on the bed that shows the relatively simple velocity profile of the original smooth flow without roughness elements. A flow of this kind has been called wake-interference flow (Morris, 1955). Again you have to take a large number of local velocity profiles and spatially average them to get a profile representative of the entire bed. Because most of the area of the bed is overlain by reattached and relaxing wakes, the spatially averaged profile shows two distinct segments: one, adjacent to the bed and extending upward for some fraction of the roughness height, represents the spatial average of the local wall-law profiles in the relaxing wakes, and the other, starting well above the tops of the large roughness elements and extending far above, represents the wall law above the zone in which the upward- diffusing wake turbulence blends into a spatially uniform layer—the case that was treated at length in the earlier part of this chapter. These two distinctive parts of the profile tend to plot as semilog straight lines with a transition at heights somewhat below to somewhat above the tops of the roughness elements. See Nowell and Church (1979) for a good example. As the roughness spacing decreases, the height of the \(y = 0\) level for the overall wall-law profile above the tops of the roughness elements rises higher and higher above the planar bottom.
With increasing roughness density, eventually most of the area of the bed between roughness elements is overlain by the parts of the wakes that lie upstream rather than downstream of reattachment (Figures \(\PageIndex{18}\)C, \(\PageIndex{18}\)D); this condition sets in when the ratio of roughness spacing to roughness height is of the order of ten or less. Well before this stage the lower straight-line segment of the spatially averaged velocity profile loses its distinctive character. The turbulent shear layers downstream of loci of separation then impinge mostly upon the surfaces of roughness elements downstream rather than on the planar bottom; viscous shear stresses on the planar bottom are almost nonexistent, and the geometry of the bottom in the areas between the roughness elements is irrelevant to the dynamics of the flow. For three-dimensional granular roughness this condition is maintained with no qualitative change as the elements become so closely spaced that their bases are touching—a good approximation to the condition of a loose granular bed treated in detail earlier. If the roughness consists of transverse ridges, however, the ratio of spacing to height can continue to decrease toward zero, and as it becomes smaller than about one the flow skims across the crests of the ridges and drives a circulation of stable vortices located in the deep and narrow troughs between the ridges; this has been called skimming flow (Morris, 1955).


