
8.4.2: Blockage of longshore transport by shore-normal structures
- Page ID
- 16391

\( \newcommand{\vecs}[1]{\overset { \scriptstyle \rightharpoonup} {\mathbf{#1}} } \)
\( \newcommand{\vecd}[1]{\overset{-\!-\!\rightharpoonup}{\vphantom{a}\smash {#1}}} \)
\( \newcommand{\id}{\mathrm{id}}\) \( \newcommand{\Span}{\mathrm{span}}\)
( \newcommand{\kernel}{\mathrm{null}\,}\) \( \newcommand{\range}{\mathrm{range}\,}\)
\( \newcommand{\RealPart}{\mathrm{Re}}\) \( \newcommand{\ImaginaryPart}{\mathrm{Im}}\)
\( \newcommand{\Argument}{\mathrm{Arg}}\) \( \newcommand{\norm}[1]{\| #1 \|}\)
\( \newcommand{\inner}[2]{\langle #1, #2 \rangle}\)
\( \newcommand{\Span}{\mathrm{span}}\)
\( \newcommand{\id}{\mathrm{id}}\)
\( \newcommand{\Span}{\mathrm{span}}\)
\( \newcommand{\kernel}{\mathrm{null}\,}\)
\( \newcommand{\range}{\mathrm{range}\,}\)
\( \newcommand{\RealPart}{\mathrm{Re}}\)
\( \newcommand{\ImaginaryPart}{\mathrm{Im}}\)
\( \newcommand{\Argument}{\mathrm{Arg}}\)
\( \newcommand{\norm}[1]{\| #1 \|}\)
\( \newcommand{\inner}[2]{\langle #1, #2 \rangle}\)
\( \newcommand{\Span}{\mathrm{span}}\) \( \newcommand{\AA}{\unicode[.8,0]{x212B}}\)
\( \newcommand{\vectorA}[1]{\vec{#1}} % arrow\)
\( \newcommand{\vectorAt}[1]{\vec{\text{#1}}} % arrow\)
\( \newcommand{\vectorB}[1]{\overset { \scriptstyle \rightharpoonup} {\mathbf{#1}} } \)
\( \newcommand{\vectorC}[1]{\textbf{#1}} \)
\( \newcommand{\vectorD}[1]{\overrightarrow{#1}} \)
\( \newcommand{\vectorDt}[1]{\overrightarrow{\text{#1}}} \)
\( \newcommand{\vectE}[1]{\overset{-\!-\!\rightharpoonup}{\vphantom{a}\smash{\mathbf {#1}}}} \)
\( \newcommand{\vecs}[1]{\overset { \scriptstyle \rightharpoonup} {\mathbf{#1}} } \)
\( \newcommand{\vecd}[1]{\overset{-\!-\!\rightharpoonup}{\vphantom{a}\smash {#1}}} \)
\(\newcommand{\avec}{\mathbf a}\) \(\newcommand{\bvec}{\mathbf b}\) \(\newcommand{\cvec}{\mathbf c}\) \(\newcommand{\dvec}{\mathbf d}\) \(\newcommand{\dtil}{\widetilde{\mathbf d}}\) \(\newcommand{\evec}{\mathbf e}\) \(\newcommand{\fvec}{\mathbf f}\) \(\newcommand{\nvec}{\mathbf n}\) \(\newcommand{\pvec}{\mathbf p}\) \(\newcommand{\qvec}{\mathbf q}\) \(\newcommand{\svec}{\mathbf s}\) \(\newcommand{\tvec}{\mathbf t}\) \(\newcommand{\uvec}{\mathbf u}\) \(\newcommand{\vvec}{\mathbf v}\) \(\newcommand{\wvec}{\mathbf w}\) \(\newcommand{\xvec}{\mathbf x}\) \(\newcommand{\yvec}{\mathbf y}\) \(\newcommand{\zvec}{\mathbf z}\) \(\newcommand{\rvec}{\mathbf r}\) \(\newcommand{\mvec}{\mathbf m}\) \(\newcommand{\zerovec}{\mathbf 0}\) \(\newcommand{\onevec}{\mathbf 1}\) \(\newcommand{\real}{\mathbb R}\) \(\newcommand{\twovec}[2]{\left[\begin{array}{r}#1 \\ #2 \end{array}\right]}\) \(\newcommand{\ctwovec}[2]{\left[\begin{array}{c}#1 \\ #2 \end{array}\right]}\) \(\newcommand{\threevec}[3]{\left[\begin{array}{r}#1 \\ #2 \\ #3 \end{array}\right]}\) \(\newcommand{\cthreevec}[3]{\left[\begin{array}{c}#1 \\ #2 \\ #3 \end{array}\right]}\) \(\newcommand{\fourvec}[4]{\left[\begin{array}{r}#1 \\ #2 \\ #3 \\ #4 \end{array}\right]}\) \(\newcommand{\cfourvec}[4]{\left[\begin{array}{c}#1 \\ #2 \\ #3 \\ #4 \end{array}\right]}\) \(\newcommand{\fivevec}[5]{\left[\begin{array}{r}#1 \\ #2 \\ #3 \\ #4 \\ #5 \\ \end{array}\right]}\) \(\newcommand{\cfivevec}[5]{\left[\begin{array}{c}#1 \\ #2 \\ #3 \\ #4 \\ #5 \\ \end{array}\right]}\) \(\newcommand{\mattwo}[4]{\left[\begin{array}{rr}#1 \amp #2 \\ #3 \amp #4 \\ \end{array}\right]}\) \(\newcommand{\laspan}[1]{\text{Span}\{#1\}}\) \(\newcommand{\bcal}{\cal B}\) \(\newcommand{\ccal}{\cal C}\) \(\newcommand{\scal}{\cal S}\) \(\newcommand{\wcal}{\cal W}\) \(\newcommand{\ecal}{\cal E}\) \(\newcommand{\coords}[2]{\left\{#1\right\}_{#2}}\) \(\newcommand{\gray}[1]{\color{gray}{#1}}\) \(\newcommand{\lgray}[1]{\color{lightgray}{#1}}\) \(\newcommand{\rank}{\operatorname{rank}}\) \(\newcommand{\row}{\text{Row}}\) \(\newcommand{\col}{\text{Col}}\) \(\renewcommand{\row}{\text{Row}}\) \(\newcommand{\nul}{\text{Nul}}\) \(\newcommand{\var}{\text{Var}}\) \(\newcommand{\corr}{\text{corr}}\) \(\newcommand{\len}[1]{\left|#1\right|}\) \(\newcommand{\bbar}{\overline{\bvec}}\) \(\newcommand{\bhat}{\widehat{\bvec}}\) \(\newcommand{\bperp}{\bvec^\perp}\) \(\newcommand{\xhat}{\widehat{\xvec}}\) \(\newcommand{\vhat}{\widehat{\vvec}}\) \(\newcommand{\uhat}{\widehat{\uvec}}\) \(\newcommand{\what}{\widehat{\wvec}}\) \(\newcommand{\Sighat}{\widehat{\Sigma}}\) \(\newcommand{\lt}{<}\) \(\newcommand{\gt}{>}\) \(\newcommand{\amp}{&}\) \(\definecolor{fillinmathshade}{gray}{0.9}\)In this section, we discuss the effect of (partial) blockage of longshore transport by groynes and breakwaters. As in Sect. 8.3.3, we expect updrift accretion and downdrift erosion. Figure 8.18 (in Example 8.4.2.1) serves as a further illustration. Whereas in Sect. 8.3.3 we considered steady wave conditions, here we consider a full wave climate as well a schematization into primary and secondary waves. Primary or prevailing waves are waves that give a gross transport in the net transport direction averaged over all wave conditions. By contrast, secondary waves give a gross transport smaller in magnitude and in the opposite direction.
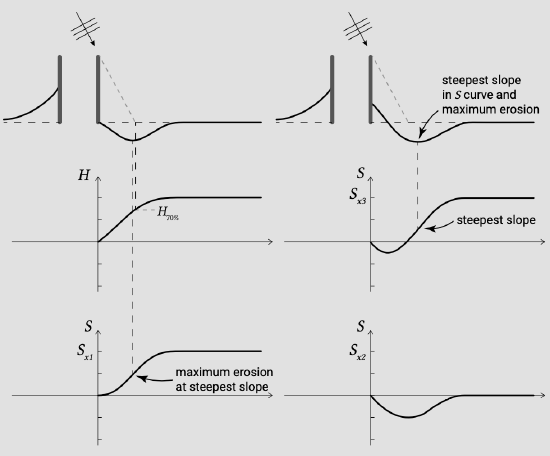
The development in the lee side of a jettied entrance is illustrated in Fig. 8.18. Let us consider irregular waves conditions from one primary direction. The transport away from the downdrift jetty by the alongshore current is \(S_{x,1}\). It is reduced in the lee side of the jetty due to the reduced wave heights (changes in wave angle are neglected). The shoreline development in response to \(S_{x,1}\) only is shown at the top left of the figure. The secondary transport component due to set-up driven currents is \(S_{x,2}\) and is directed towards the downdrift jetty. The total transport is \(S_{x, 3} = S_{x, 1} + S_{x, 2}\). In the zone directly downdrift the jetty the transport gradient \(dS_{x, 3}/dx\) is negative resulting in sedimentation (see top right of the figure). Erosion occurs where \(dS_{x, 3}/dx\) is positive. Further away from the jetty a constant \(dS_{x, 3}/dx\) implies no coastline change.
Let us – as in Sect. 8.3.3 – consider a long breakwater that extends far beyond the surf zone, such that at least initially no appreciable transport will take place around the tip of the breakwater. The wave conditions are as given in Intermezzo 8.2 and hence Fig. 8.10 shows the transport curve. This curve is valid for the undisturbed coastline far from the breakwater that is reached by waves from all directions. On the updrift side of the breakwater, the secondary waves with negative angles of attack are initially blocked by the long breakwater. This locally increases the yearly-averaged transport rate (i.e. only the gross positive transport should be considered) and hence not only the transport for the unchanged coastline orientation but the coastline orientation for zero transport as well. This means that the equilibrium coastline orientation to be expected on the updrift side of the breakwater at \(x = 0\) is initially larger than \(15^{\circ}\). Similarly, on the downdrift side, the waves with positive angles of attack are blocked by the breakwater. Waves with negative wave angles will reach the breakwater and result in a transport towards the breakwater, such that local accretion can be expected at the breakwater. Note that the term downdrift refers to the net transport direction along the undisturbed coast averaged over all conditions. The angle of the accretion at the breakwater is determined by the condition of zero transport for the waves that can reach the ray just on the lee side of the breakwater. This angle follows from a transport curve (for the conditions giving a negative transport only) that intersects the \(y\)-axis at a negative transport rate and the \(x\)-axis at a negative angle. Note that the effects of diffraction of the waves with positive wave angles into the sheltered area (see Fig. 8.14) and corresponding set-up induced currents are not yet taken into account in the above reasoning about the downdrift equilibrium angle at the breakwater.
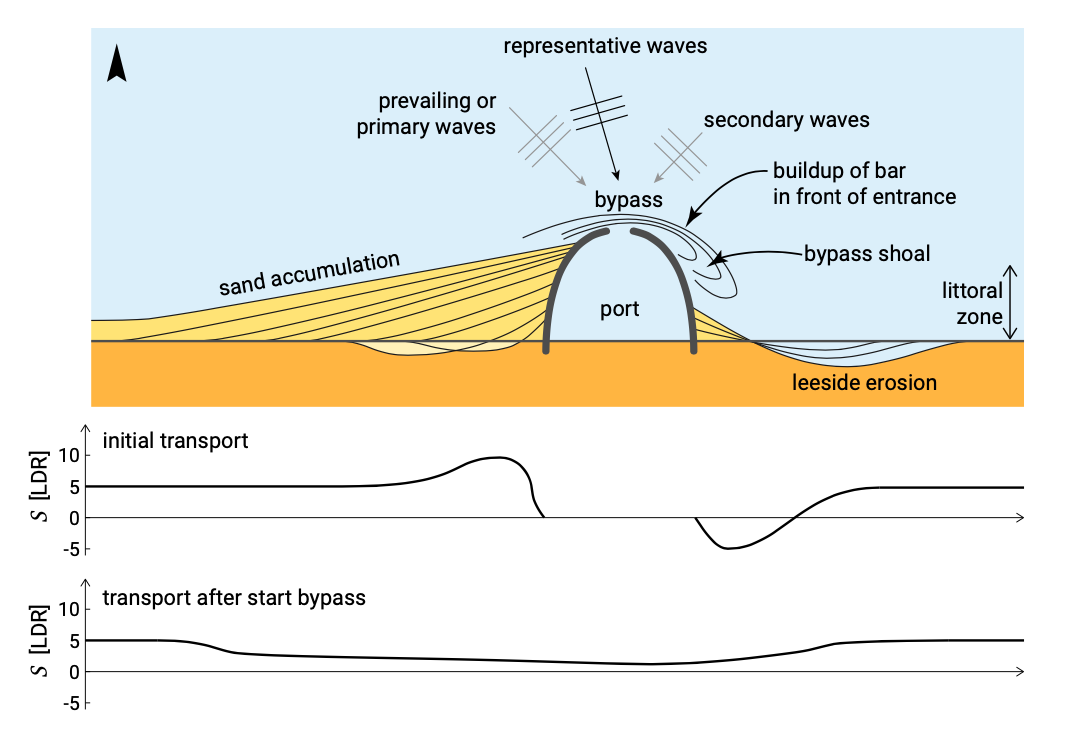
The expected development of the coastline for a comparable case is shown in Fig. 8.19 (from Mangor, 2004). The wave climate is schematised into prevailing waves from the NW and secondary waves from the NE. The ‘representative wave condition’ shown in Fig. 8.19 is a single condition that would reproduce the net transport of the full climate as well as the corresponding shoreline equilibrium angle. The wave angles are smaller than 45°. The figure shows the longshore transport rates along the coast, both initially after construction of the harbour and after bypass has started. The transport rates are expressed in units LDR (Longshore Drift Rate). The prevailing and secondary waves give transports of 10 LDR eastward (E) and 5 LDR westward (W) respectively. Hence, the net transport far from the breakwater is 5 LDR eastward.
Initially, the transport on the updrift side increases from 5 LDR E (outside the area of influence of the breakwater) to 10 LDR E closer to the breakwater, where the secondary waves do not penetrate. At the breakwater of course the transport is zero. In the beginning therefore, the zone on the updrift side that is sheltered from secondary waves, shows accretion close to the breakwater (where the transport gradients are negative) and a smaller (only initial) erosion a bit further away from the breakwater (in the zone with positive transport gradients). The updrift side as a whole has a sediment surplus of 5 LDR and hence experiences accretion.
Downdrift of the breakwater the expected initial transport rates are 5 LDR E further from the breakwater. Very close to the breakwater – in the shadow zone for the pre- vailing waves – the transport is 5 LDR W (resulting in a small accumulation at the breakwater). The lee side as a whole has a sediment deficit of 5 LDR and therefore experiences erosion. From sediment continuity considerations, it follows that the de- posited sediment volumes in the entire affected area must match the eroded volumes.
At any given time the coastline orientation at the breakwater (updrift) is normal to the direction of the waves that can reach the advanced coastline. The angle can therefore be seen to gradually change from normal to the direction of the prevailing waves to normal to the direction of the ‘resulting’ (representative for the net transport) waves.
After the bypass starts, a bar will build up in the harbour entrance and the updrift coastline will try to re-orientate itself towards the original direction (but will never succeed). Although the downdrift coastline will continue to experience erosion, the erosion will diminish after the coastline receives sediment via the migrating bypass shoal.