
10.7.3: Counteracting structural erosion of coasts
- Page ID
- 16447

\( \newcommand{\vecs}[1]{\overset { \scriptstyle \rightharpoonup} {\mathbf{#1}} } \)
\( \newcommand{\vecd}[1]{\overset{-\!-\!\rightharpoonup}{\vphantom{a}\smash {#1}}} \)
\( \newcommand{\id}{\mathrm{id}}\) \( \newcommand{\Span}{\mathrm{span}}\)
( \newcommand{\kernel}{\mathrm{null}\,}\) \( \newcommand{\range}{\mathrm{range}\,}\)
\( \newcommand{\RealPart}{\mathrm{Re}}\) \( \newcommand{\ImaginaryPart}{\mathrm{Im}}\)
\( \newcommand{\Argument}{\mathrm{Arg}}\) \( \newcommand{\norm}[1]{\| #1 \|}\)
\( \newcommand{\inner}[2]{\langle #1, #2 \rangle}\)
\( \newcommand{\Span}{\mathrm{span}}\)
\( \newcommand{\id}{\mathrm{id}}\)
\( \newcommand{\Span}{\mathrm{span}}\)
\( \newcommand{\kernel}{\mathrm{null}\,}\)
\( \newcommand{\range}{\mathrm{range}\,}\)
\( \newcommand{\RealPart}{\mathrm{Re}}\)
\( \newcommand{\ImaginaryPart}{\mathrm{Im}}\)
\( \newcommand{\Argument}{\mathrm{Arg}}\)
\( \newcommand{\norm}[1]{\| #1 \|}\)
\( \newcommand{\inner}[2]{\langle #1, #2 \rangle}\)
\( \newcommand{\Span}{\mathrm{span}}\) \( \newcommand{\AA}{\unicode[.8,0]{x212B}}\)
\( \newcommand{\vectorA}[1]{\vec{#1}} % arrow\)
\( \newcommand{\vectorAt}[1]{\vec{\text{#1}}} % arrow\)
\( \newcommand{\vectorB}[1]{\overset { \scriptstyle \rightharpoonup} {\mathbf{#1}} } \)
\( \newcommand{\vectorC}[1]{\textbf{#1}} \)
\( \newcommand{\vectorD}[1]{\overrightarrow{#1}} \)
\( \newcommand{\vectorDt}[1]{\overrightarrow{\text{#1}}} \)
\( \newcommand{\vectE}[1]{\overset{-\!-\!\rightharpoonup}{\vphantom{a}\smash{\mathbf {#1}}}} \)
\( \newcommand{\vecs}[1]{\overset { \scriptstyle \rightharpoonup} {\mathbf{#1}} } \)
\( \newcommand{\vecd}[1]{\overset{-\!-\!\rightharpoonup}{\vphantom{a}\smash {#1}}} \)
\(\newcommand{\avec}{\mathbf a}\) \(\newcommand{\bvec}{\mathbf b}\) \(\newcommand{\cvec}{\mathbf c}\) \(\newcommand{\dvec}{\mathbf d}\) \(\newcommand{\dtil}{\widetilde{\mathbf d}}\) \(\newcommand{\evec}{\mathbf e}\) \(\newcommand{\fvec}{\mathbf f}\) \(\newcommand{\nvec}{\mathbf n}\) \(\newcommand{\pvec}{\mathbf p}\) \(\newcommand{\qvec}{\mathbf q}\) \(\newcommand{\svec}{\mathbf s}\) \(\newcommand{\tvec}{\mathbf t}\) \(\newcommand{\uvec}{\mathbf u}\) \(\newcommand{\vvec}{\mathbf v}\) \(\newcommand{\wvec}{\mathbf w}\) \(\newcommand{\xvec}{\mathbf x}\) \(\newcommand{\yvec}{\mathbf y}\) \(\newcommand{\zvec}{\mathbf z}\) \(\newcommand{\rvec}{\mathbf r}\) \(\newcommand{\mvec}{\mathbf m}\) \(\newcommand{\zerovec}{\mathbf 0}\) \(\newcommand{\onevec}{\mathbf 1}\) \(\newcommand{\real}{\mathbb R}\) \(\newcommand{\twovec}[2]{\left[\begin{array}{r}#1 \\ #2 \end{array}\right]}\) \(\newcommand{\ctwovec}[2]{\left[\begin{array}{c}#1 \\ #2 \end{array}\right]}\) \(\newcommand{\threevec}[3]{\left[\begin{array}{r}#1 \\ #2 \\ #3 \end{array}\right]}\) \(\newcommand{\cthreevec}[3]{\left[\begin{array}{c}#1 \\ #2 \\ #3 \end{array}\right]}\) \(\newcommand{\fourvec}[4]{\left[\begin{array}{r}#1 \\ #2 \\ #3 \\ #4 \end{array}\right]}\) \(\newcommand{\cfourvec}[4]{\left[\begin{array}{c}#1 \\ #2 \\ #3 \\ #4 \end{array}\right]}\) \(\newcommand{\fivevec}[5]{\left[\begin{array}{r}#1 \\ #2 \\ #3 \\ #4 \\ #5 \\ \end{array}\right]}\) \(\newcommand{\cfivevec}[5]{\left[\begin{array}{c}#1 \\ #2 \\ #3 \\ #4 \\ #5 \\ \end{array}\right]}\) \(\newcommand{\mattwo}[4]{\left[\begin{array}{rr}#1 \amp #2 \\ #3 \amp #4 \\ \end{array}\right]}\) \(\newcommand{\laspan}[1]{\text{Span}\{#1\}}\) \(\newcommand{\bcal}{\cal B}\) \(\newcommand{\ccal}{\cal C}\) \(\newcommand{\scal}{\cal S}\) \(\newcommand{\wcal}{\cal W}\) \(\newcommand{\ecal}{\cal E}\) \(\newcommand{\coords}[2]{\left\{#1\right\}_{#2}}\) \(\newcommand{\gray}[1]{\color{gray}{#1}}\) \(\newcommand{\lgray}[1]{\color{lightgray}{#1}}\) \(\newcommand{\rank}{\operatorname{rank}}\) \(\newcommand{\row}{\text{Row}}\) \(\newcommand{\col}{\text{Col}}\) \(\renewcommand{\row}{\text{Row}}\) \(\newcommand{\nul}{\text{Nul}}\) \(\newcommand{\var}{\text{Var}}\) \(\newcommand{\corr}{\text{corr}}\) \(\newcommand{\len}[1]{\left|#1\right|}\) \(\newcommand{\bbar}{\overline{\bvec}}\) \(\newcommand{\bhat}{\widehat{\bvec}}\) \(\newcommand{\bperp}{\bvec^\perp}\) \(\newcommand{\xhat}{\widehat{\xvec}}\) \(\newcommand{\vhat}{\widehat{\vvec}}\) \(\newcommand{\uhat}{\widehat{\uvec}}\) \(\newcommand{\what}{\widehat{\wvec}}\) \(\newcommand{\Sighat}{\widehat{\Sigma}}\) \(\newcommand{\lt}{<}\) \(\newcommand{\gt}{>}\) \(\newcommand{\amp}{&}\) \(\definecolor{fillinmathshade}{gray}{0.9}\)When a beach suffers from structural erosion, artificial nourishments can be applied as a ‘soft’ remedy. The occurring losses out of a stretch of coast are replenished from time to time. Regularly applying nourishments with borrow material that has the same size as the native material will, to a first approximation, not interfere in the longshore sediment transports and thus not influence the occurring losses. Hence, the erosion does not stop and after a certain period the nourishment has to be repeated. The example of the Dutch coast shows that long-term and large-scale erosion can be stopped by massive beach and shoreface nourishment over long periods of time.
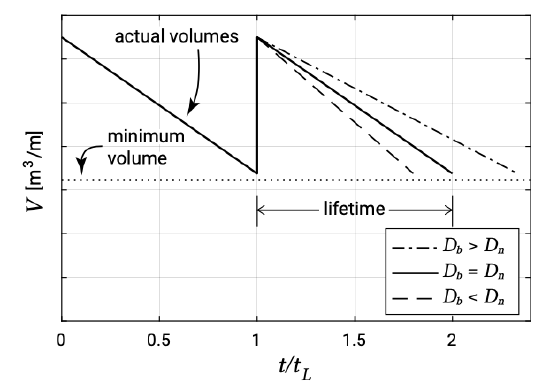
If a well-defined beach volume has been assigned a minimum limit of acceptance, then a re-nourishment project has to be carried out as soon as this minimum is reached (at \(t/t_L = 1\) in Fig. 10.34).
If the borrow sand is the same as the native sand (the material already present at the location) and if to a first approximation it is assumed that the morphological processes do not change, the erosional tendency after the nourishment is the same as before the nourishment (see the red line in Fig. 10.34, which has the same slope before and after the nourishment). The expected lifetime of the nourishment project then is \(t_2 - t_1\). Generally lifetimes of 5 to 10 years are strived for since the initial costs of a nourishment operation are often rather high due to mobilisation costs.
By contrast, if the grain size of the borrow sand is larger than of the native sand, the longshore transport rate will be smaller than before. The time in which the beach volume will decrease to the minimum volume will be larger. The lifetime of the nourishment increases (see the black line in Fig. 10.34). However, when the grain size of the borrow sand is smaller than the native sand, the longshore transport in the nourished area increases. Therefore the lifetime of a nourishment with finer sand is smaller than the lifetime of a nourishment with the native sand (see the blue line in Fig. 10.34).
With an average sand loss \(\Delta V\) of 20 \(m^3/m\) per year (annual retreat of coastline of about 1 m per year; see Intermezzo 10.1) a time period between nourishments of 5 years means that about 1000 \(m^3/m\) has to be replenished every 5 years. This is a quite normal value. If the relevant stretch of coast is 5 km long, a total volume of 500000 \(m^3\) has to be nourished every 5 years. This volume must be increased with 10% to 20% to account for additional losses of the fine fraction during the execution of the nourishment.
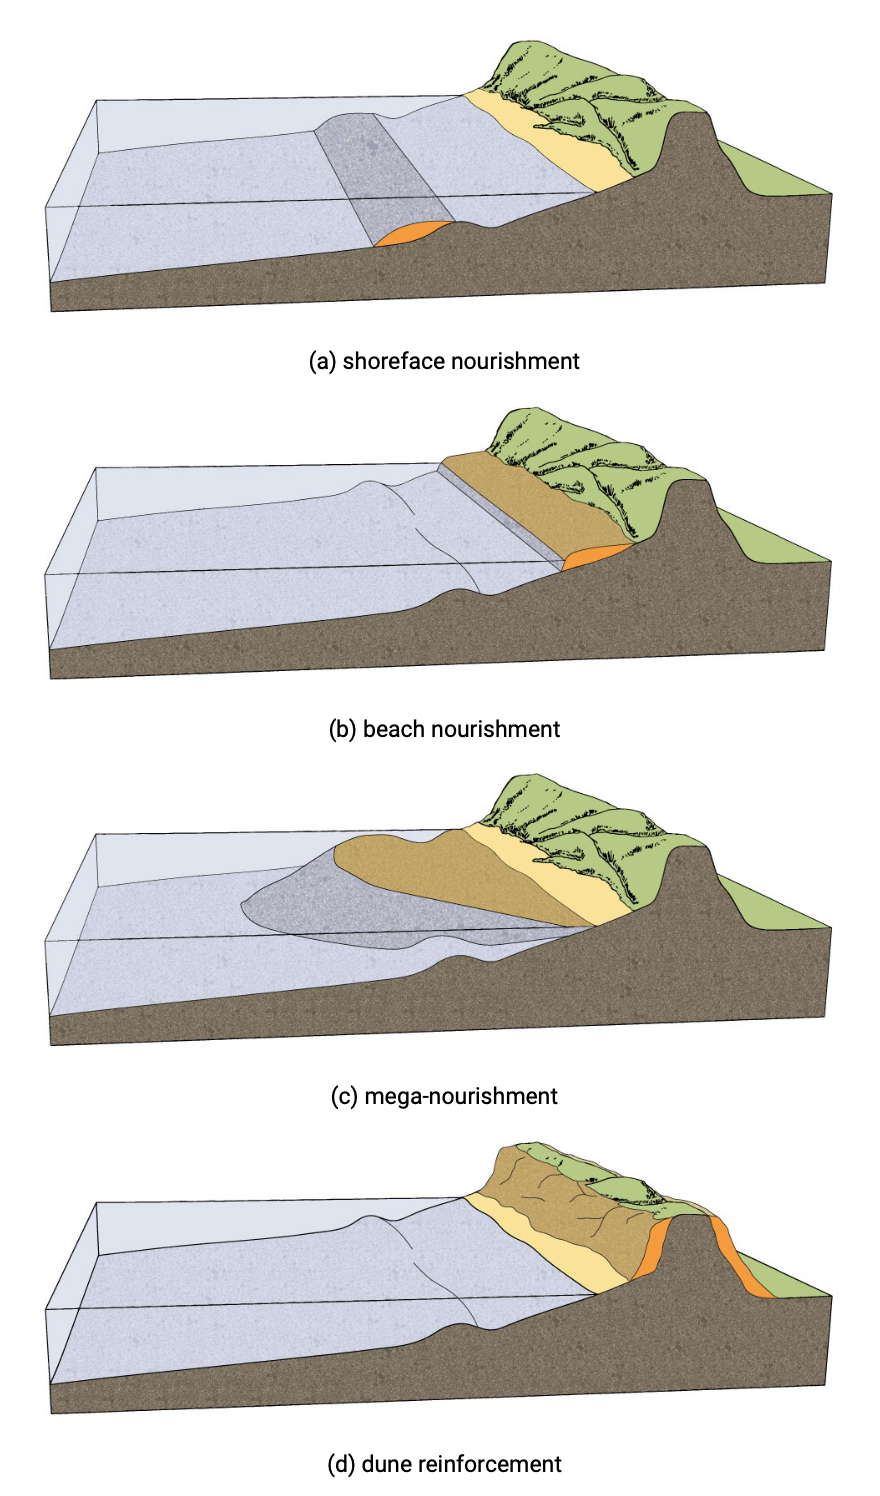
Artificial nourishments to combat structural erosion of a stretch of coast can be placed at various positions in a cross-shore profile (Fig. 10.35), viz. at the dry beach (Fig. 10.35b) or at the shoreface (Fig. 10.35a). In both cases cross-shore redistribution of sand will spread out the sediments. The dune reinforcement (Fig. 10.35d) and mega-nourishment (Fig. 10.35c) are described in the following sections.
In the case of a beach nourishment, sand is placed between the LW line and the dune foot. Eventually, the quantity supplied will be evenly distributed over the full height (and length) of the shoreface slope, following the equilibrium rules dictated by wave climate and grain size. This means that after a beach nourishment operation, large quantities of newly supplied material will disappear under water soon. The general public tends to call this phenomenon “erosion”, though we must understand that it is initially no more than a re-distribution of the material within the natural cross-section of the coast.
For shoreface nourishments, the nourishment volume often is of the order of the volume of the outer breaker bar (say 300 \(m^3/m\) to 500 \(m^3/m\)). The length scale (along-shore 2 km to 5 km) of a shoreface nourishment is of the order of several times the width of the surf zone. Relatively large nourishment volumes are required as only part of the nourishment volume (approximately 20 % to 30 %) will reach the beach zone after 5 years. Besides, because the costs per \(m^3\) of a shoreface nourishment project are far less than the costs of a beach nourishment project, often much larger volumes are added to the system in the case of shoreface nourishments than in the case of beach nourishments (stock pile nourishments). Such large shoreface nourishments can be expected to significantly impact sediment transport processes. A large shoreface nourishment may behave in the same way as a submerged breakwater, although the effect diminishes in time. Examples are also known where the bar motion in the seaward direction is disturbed by a large shoreface nourishment project; see e.g. Spanhoff and Van de Graaff (2007).
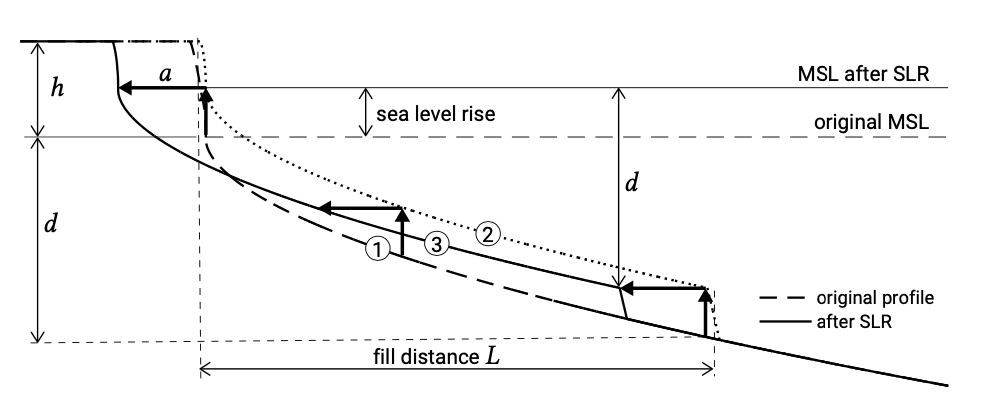
Artificial nourishments can also be applied to counteract the structural coastal retreat due to Sea Level Rise (\(SLR\)), see also Sect. 7.4. If one chooses to maintain the current coastline (in the Netherlands the 1990 coastline is maintained, Fig. 10.1), nourishments should fill in the space created by the sea-level rise (between profile 1 and 2 in Fig. 10.36). A volume of \(SLR\) times the fill distance \(L\) is necessary. With e.g. \(SLR = 1.0\ m\) per century and \(L = 1000\ m\), a volume of 1000 \(m^3/m\) is required in 100 years. This volume of 10 \(m^3/m\) per year is quite a usual nourishment volume.
Profile 3 would be the resulting equilibrium coastal profile without human interference; the new equilibrium is achieved by a horizontal shift a of profile 2 towards profile 3 in Fig. 10.36. The horizontal shift a can be determined from Eq. 7.4.1: \9a = (SLR \times L)/(d+h)\). With \(SLR = 1.0\ m\) (e.g. per century), \(L = 1000\ m\), \(d = 10\ m\) and \(h = 10\ m\), \(a\) becomes \(50\ m\). Whether such a gradual retreat of the coast (in the example \(0.5\ m\) per year) is acceptable depends on the situation. Note that in the situation of a very flat coastal profile (see Fig. 2.25, Bangladesh), the retreat will be significantly larger.