
3.3: Measuring ocean surface elevations
- Page ID
- 16182

\( \newcommand{\vecs}[1]{\overset { \scriptstyle \rightharpoonup} {\mathbf{#1}} } \)
\( \newcommand{\vecd}[1]{\overset{-\!-\!\rightharpoonup}{\vphantom{a}\smash {#1}}} \)
\( \newcommand{\id}{\mathrm{id}}\) \( \newcommand{\Span}{\mathrm{span}}\)
( \newcommand{\kernel}{\mathrm{null}\,}\) \( \newcommand{\range}{\mathrm{range}\,}\)
\( \newcommand{\RealPart}{\mathrm{Re}}\) \( \newcommand{\ImaginaryPart}{\mathrm{Im}}\)
\( \newcommand{\Argument}{\mathrm{Arg}}\) \( \newcommand{\norm}[1]{\| #1 \|}\)
\( \newcommand{\inner}[2]{\langle #1, #2 \rangle}\)
\( \newcommand{\Span}{\mathrm{span}}\)
\( \newcommand{\id}{\mathrm{id}}\)
\( \newcommand{\Span}{\mathrm{span}}\)
\( \newcommand{\kernel}{\mathrm{null}\,}\)
\( \newcommand{\range}{\mathrm{range}\,}\)
\( \newcommand{\RealPart}{\mathrm{Re}}\)
\( \newcommand{\ImaginaryPart}{\mathrm{Im}}\)
\( \newcommand{\Argument}{\mathrm{Arg}}\)
\( \newcommand{\norm}[1]{\| #1 \|}\)
\( \newcommand{\inner}[2]{\langle #1, #2 \rangle}\)
\( \newcommand{\Span}{\mathrm{span}}\) \( \newcommand{\AA}{\unicode[.8,0]{x212B}}\)
\( \newcommand{\vectorA}[1]{\vec{#1}} % arrow\)
\( \newcommand{\vectorAt}[1]{\vec{\text{#1}}} % arrow\)
\( \newcommand{\vectorB}[1]{\overset { \scriptstyle \rightharpoonup} {\mathbf{#1}} } \)
\( \newcommand{\vectorC}[1]{\textbf{#1}} \)
\( \newcommand{\vectorD}[1]{\overrightarrow{#1}} \)
\( \newcommand{\vectorDt}[1]{\overrightarrow{\text{#1}}} \)
\( \newcommand{\vectE}[1]{\overset{-\!-\!\rightharpoonup}{\vphantom{a}\smash{\mathbf {#1}}}} \)
\( \newcommand{\vecs}[1]{\overset { \scriptstyle \rightharpoonup} {\mathbf{#1}} } \)
\( \newcommand{\vecd}[1]{\overset{-\!-\!\rightharpoonup}{\vphantom{a}\smash {#1}}} \)
\(\newcommand{\avec}{\mathbf a}\) \(\newcommand{\bvec}{\mathbf b}\) \(\newcommand{\cvec}{\mathbf c}\) \(\newcommand{\dvec}{\mathbf d}\) \(\newcommand{\dtil}{\widetilde{\mathbf d}}\) \(\newcommand{\evec}{\mathbf e}\) \(\newcommand{\fvec}{\mathbf f}\) \(\newcommand{\nvec}{\mathbf n}\) \(\newcommand{\pvec}{\mathbf p}\) \(\newcommand{\qvec}{\mathbf q}\) \(\newcommand{\svec}{\mathbf s}\) \(\newcommand{\tvec}{\mathbf t}\) \(\newcommand{\uvec}{\mathbf u}\) \(\newcommand{\vvec}{\mathbf v}\) \(\newcommand{\wvec}{\mathbf w}\) \(\newcommand{\xvec}{\mathbf x}\) \(\newcommand{\yvec}{\mathbf y}\) \(\newcommand{\zvec}{\mathbf z}\) \(\newcommand{\rvec}{\mathbf r}\) \(\newcommand{\mvec}{\mathbf m}\) \(\newcommand{\zerovec}{\mathbf 0}\) \(\newcommand{\onevec}{\mathbf 1}\) \(\newcommand{\real}{\mathbb R}\) \(\newcommand{\twovec}[2]{\left[\begin{array}{r}#1 \\ #2 \end{array}\right]}\) \(\newcommand{\ctwovec}[2]{\left[\begin{array}{c}#1 \\ #2 \end{array}\right]}\) \(\newcommand{\threevec}[3]{\left[\begin{array}{r}#1 \\ #2 \\ #3 \end{array}\right]}\) \(\newcommand{\cthreevec}[3]{\left[\begin{array}{c}#1 \\ #2 \\ #3 \end{array}\right]}\) \(\newcommand{\fourvec}[4]{\left[\begin{array}{r}#1 \\ #2 \\ #3 \\ #4 \end{array}\right]}\) \(\newcommand{\cfourvec}[4]{\left[\begin{array}{c}#1 \\ #2 \\ #3 \\ #4 \end{array}\right]}\) \(\newcommand{\fivevec}[5]{\left[\begin{array}{r}#1 \\ #2 \\ #3 \\ #4 \\ #5 \\ \end{array}\right]}\) \(\newcommand{\cfivevec}[5]{\left[\begin{array}{c}#1 \\ #2 \\ #3 \\ #4 \\ #5 \\ \end{array}\right]}\) \(\newcommand{\mattwo}[4]{\left[\begin{array}{rr}#1 \amp #2 \\ #3 \amp #4 \\ \end{array}\right]}\) \(\newcommand{\laspan}[1]{\text{Span}\{#1\}}\) \(\newcommand{\bcal}{\cal B}\) \(\newcommand{\ccal}{\cal C}\) \(\newcommand{\scal}{\cal S}\) \(\newcommand{\wcal}{\cal W}\) \(\newcommand{\ecal}{\cal E}\) \(\newcommand{\coords}[2]{\left\{#1\right\}_{#2}}\) \(\newcommand{\gray}[1]{\color{gray}{#1}}\) \(\newcommand{\lgray}[1]{\color{lightgray}{#1}}\) \(\newcommand{\rank}{\operatorname{rank}}\) \(\newcommand{\row}{\text{Row}}\) \(\newcommand{\col}{\text{Col}}\) \(\renewcommand{\row}{\text{Row}}\) \(\newcommand{\nul}{\text{Nul}}\) \(\newcommand{\var}{\text{Var}}\) \(\newcommand{\corr}{\text{corr}}\) \(\newcommand{\len}[1]{\left|#1\right|}\) \(\newcommand{\bbar}{\overline{\bvec}}\) \(\newcommand{\bhat}{\widehat{\bvec}}\) \(\newcommand{\bperp}{\bvec^\perp}\) \(\newcommand{\xhat}{\widehat{\xvec}}\) \(\newcommand{\vhat}{\widehat{\vvec}}\) \(\newcommand{\uhat}{\widehat{\uvec}}\) \(\newcommand{\what}{\widehat{\wvec}}\) \(\newcommand{\Sighat}{\widehat{\Sigma}}\) \(\newcommand{\lt}{<}\) \(\newcommand{\gt}{>}\) \(\newcommand{\amp}{&}\) \(\definecolor{fillinmathshade}{gray}{0.9}\)Measurements of waves can be done in various ways, either at the location of the waves itself (in situ) using for instance wave buoys or poles being present in the water or from some distance with remote-sensing techniques like radar. The accuracy of most of the instruments is \(\pm 10\)% or better. The easiest way to measure the vertical elevation is by visual observation of individual waves from ships, a technique that has been applied for a long time.
The in-situ measurements are often aimed at obtaining the vertical elevation of the sea surface at one location either in deep water (buoys or poles) or in the surf zone. Arrays of bottom-mounted pressure gauges can be placed just offshore of the surf zone to determine the offshore wave heights and directions which act as boundary conditions for the coastal system. Placed in deep water it is suited to measure long- wave fluctuations like tides and tsunamis (the shorter fluctuations will not reach the bottom, see Sect. 5.4).
Coastal tide gauges measure tide and mean sea-level changes relative to points on land rather than to an absolute reference. These coastal tide gauges are often based on floats operating in a stilling well or on electrical measurements of water heights in a pipe. In order to arrive at absolute mean sea-level changes, the local vertical land motion has to be measured and corrected for1, see also Sect. 2.5.1. Differences in estimates for historic mean sea-level changes mainly result from the uncertainties related to the local vertical motions. Therefore, although data is available for over 1750 stations worldwide and sometimes going back as far as 1700 (for Amsterdam), there are a lot of different interpretations of absolute mean sea-level changes.
Nowadays the vertical movement of the land can be quite accurately recorded using satellite data, Global Positioning System (GPS) receivers and altimeters based on absolute gravity measurements.
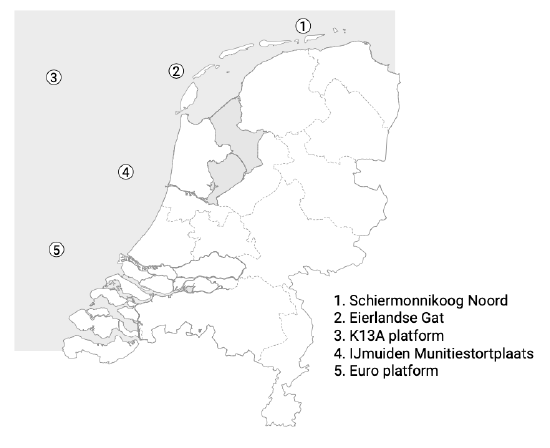
The wave information from buoys, poles, radar or other instruments is important to coastal engineers to gain an understanding of the longer term wave climate (years) or the short term (storms and individual waves) characteristics of the waves in a certain region. As an example of information available for a certain engineering project, Fig. 3.5 shows the permanent (viz. 85 %) wave measuring locations in the Dutch North Sea that have provided directional wave data for over three decades (more information: https://www.rijkswaterstaat.nl/water...ving/waterdata & https://waterinfo.rws.nl, in Dutch).
In order to obtain wave information closer to the coast or at specific location wave models can be used which use the measured wave information at the buoy location as boundary conditions. The buoys are located at relatively deep water so that the waves are not influenced by the (changing) bed. The elevation data – sampled a few times per second – is translated to a radio signal and then transmitted to a post processing centre where data analysis and derivation of wave parameters takes place.
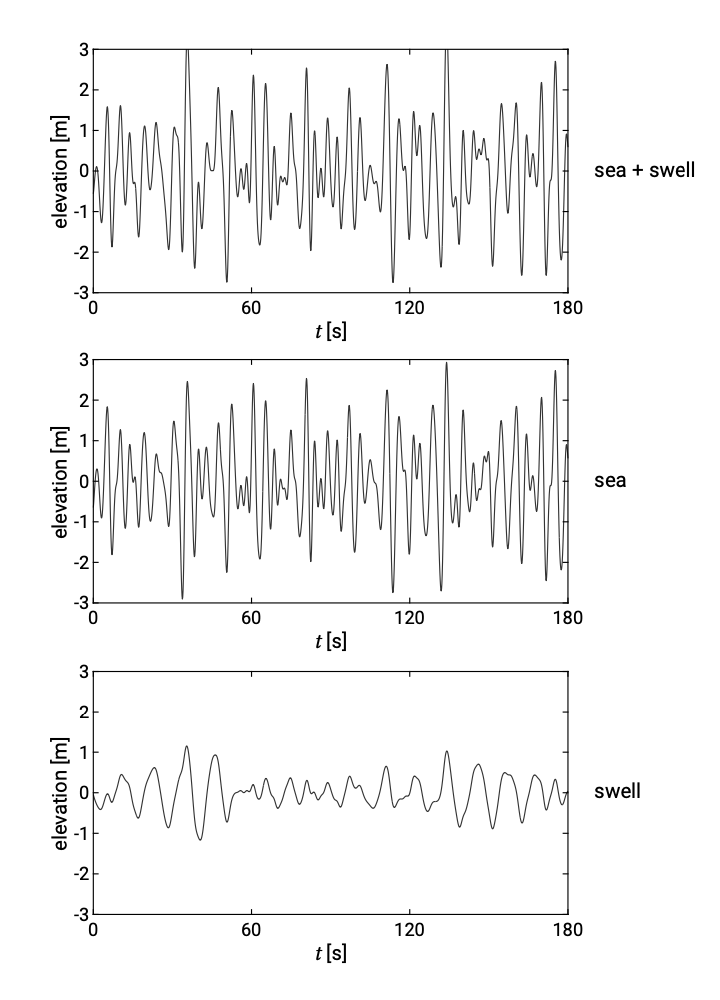
For the Dutch coast usually a combination of sea and swell is present in the record. The swell can be recognised as the longer modulation in the record which becomes clear when the two signals are separated in the shorter and irregular sea and longer swell. A typical deep water wave record from such a platform is given in Fig. 3.6. For most of the Dutch measuring locations, this type of elevation data is available since 1979. It can be used to arrive at short-term statistics and long-term wave climates. In the following section the techniques to do that will be explained.
1. The local vertical land motions due to post glacial rebound, tectonic effects, ground water- or oil-extraction can be of the same order as the average global or absolute rise which over the last century is estimated at between 1 mm to 2 mm per year (IPCC, 2001, 2007)