2.5.1: Geological sea-level changes
- Page ID
- 16273
\( \newcommand{\vecs}[1]{\overset { \scriptstyle \rightharpoonup} {\mathbf{#1}} } \)
\( \newcommand{\vecd}[1]{\overset{-\!-\!\rightharpoonup}{\vphantom{a}\smash {#1}}} \)
\( \newcommand{\id}{\mathrm{id}}\) \( \newcommand{\Span}{\mathrm{span}}\)
( \newcommand{\kernel}{\mathrm{null}\,}\) \( \newcommand{\range}{\mathrm{range}\,}\)
\( \newcommand{\RealPart}{\mathrm{Re}}\) \( \newcommand{\ImaginaryPart}{\mathrm{Im}}\)
\( \newcommand{\Argument}{\mathrm{Arg}}\) \( \newcommand{\norm}[1]{\| #1 \|}\)
\( \newcommand{\inner}[2]{\langle #1, #2 \rangle}\)
\( \newcommand{\Span}{\mathrm{span}}\)
\( \newcommand{\id}{\mathrm{id}}\)
\( \newcommand{\Span}{\mathrm{span}}\)
\( \newcommand{\kernel}{\mathrm{null}\,}\)
\( \newcommand{\range}{\mathrm{range}\,}\)
\( \newcommand{\RealPart}{\mathrm{Re}}\)
\( \newcommand{\ImaginaryPart}{\mathrm{Im}}\)
\( \newcommand{\Argument}{\mathrm{Arg}}\)
\( \newcommand{\norm}[1]{\| #1 \|}\)
\( \newcommand{\inner}[2]{\langle #1, #2 \rangle}\)
\( \newcommand{\Span}{\mathrm{span}}\) \( \newcommand{\AA}{\unicode[.8,0]{x212B}}\)
\( \newcommand{\vectorA}[1]{\vec{#1}} % arrow\)
\( \newcommand{\vectorAt}[1]{\vec{\text{#1}}} % arrow\)
\( \newcommand{\vectorB}[1]{\overset { \scriptstyle \rightharpoonup} {\mathbf{#1}} } \)
\( \newcommand{\vectorC}[1]{\textbf{#1}} \)
\( \newcommand{\vectorD}[1]{\overrightarrow{#1}} \)
\( \newcommand{\vectorDt}[1]{\overrightarrow{\text{#1}}} \)
\( \newcommand{\vectE}[1]{\overset{-\!-\!\rightharpoonup}{\vphantom{a}\smash{\mathbf {#1}}}} \)
\( \newcommand{\vecs}[1]{\overset { \scriptstyle \rightharpoonup} {\mathbf{#1}} } \)
\( \newcommand{\vecd}[1]{\overset{-\!-\!\rightharpoonup}{\vphantom{a}\smash {#1}}} \)
\(\newcommand{\avec}{\mathbf a}\) \(\newcommand{\bvec}{\mathbf b}\) \(\newcommand{\cvec}{\mathbf c}\) \(\newcommand{\dvec}{\mathbf d}\) \(\newcommand{\dtil}{\widetilde{\mathbf d}}\) \(\newcommand{\evec}{\mathbf e}\) \(\newcommand{\fvec}{\mathbf f}\) \(\newcommand{\nvec}{\mathbf n}\) \(\newcommand{\pvec}{\mathbf p}\) \(\newcommand{\qvec}{\mathbf q}\) \(\newcommand{\svec}{\mathbf s}\) \(\newcommand{\tvec}{\mathbf t}\) \(\newcommand{\uvec}{\mathbf u}\) \(\newcommand{\vvec}{\mathbf v}\) \(\newcommand{\wvec}{\mathbf w}\) \(\newcommand{\xvec}{\mathbf x}\) \(\newcommand{\yvec}{\mathbf y}\) \(\newcommand{\zvec}{\mathbf z}\) \(\newcommand{\rvec}{\mathbf r}\) \(\newcommand{\mvec}{\mathbf m}\) \(\newcommand{\zerovec}{\mathbf 0}\) \(\newcommand{\onevec}{\mathbf 1}\) \(\newcommand{\real}{\mathbb R}\) \(\newcommand{\twovec}[2]{\left[\begin{array}{r}#1 \\ #2 \end{array}\right]}\) \(\newcommand{\ctwovec}[2]{\left[\begin{array}{c}#1 \\ #2 \end{array}\right]}\) \(\newcommand{\threevec}[3]{\left[\begin{array}{r}#1 \\ #2 \\ #3 \end{array}\right]}\) \(\newcommand{\cthreevec}[3]{\left[\begin{array}{c}#1 \\ #2 \\ #3 \end{array}\right]}\) \(\newcommand{\fourvec}[4]{\left[\begin{array}{r}#1 \\ #2 \\ #3 \\ #4 \end{array}\right]}\) \(\newcommand{\cfourvec}[4]{\left[\begin{array}{c}#1 \\ #2 \\ #3 \\ #4 \end{array}\right]}\) \(\newcommand{\fivevec}[5]{\left[\begin{array}{r}#1 \\ #2 \\ #3 \\ #4 \\ #5 \\ \end{array}\right]}\) \(\newcommand{\cfivevec}[5]{\left[\begin{array}{c}#1 \\ #2 \\ #3 \\ #4 \\ #5 \\ \end{array}\right]}\) \(\newcommand{\mattwo}[4]{\left[\begin{array}{rr}#1 \amp #2 \\ #3 \amp #4 \\ \end{array}\right]}\) \(\newcommand{\laspan}[1]{\text{Span}\{#1\}}\) \(\newcommand{\bcal}{\cal B}\) \(\newcommand{\ccal}{\cal C}\) \(\newcommand{\scal}{\cal S}\) \(\newcommand{\wcal}{\cal W}\) \(\newcommand{\ecal}{\cal E}\) \(\newcommand{\coords}[2]{\left\{#1\right\}_{#2}}\) \(\newcommand{\gray}[1]{\color{gray}{#1}}\) \(\newcommand{\lgray}[1]{\color{lightgray}{#1}}\) \(\newcommand{\rank}{\operatorname{rank}}\) \(\newcommand{\row}{\text{Row}}\) \(\newcommand{\col}{\text{Col}}\) \(\renewcommand{\row}{\text{Row}}\) \(\newcommand{\nul}{\text{Nul}}\) \(\newcommand{\var}{\text{Var}}\) \(\newcommand{\corr}{\text{corr}}\) \(\newcommand{\len}[1]{\left|#1\right|}\) \(\newcommand{\bbar}{\overline{\bvec}}\) \(\newcommand{\bhat}{\widehat{\bvec}}\) \(\newcommand{\bperp}{\bvec^\perp}\) \(\newcommand{\xhat}{\widehat{\xvec}}\) \(\newcommand{\vhat}{\widehat{\vvec}}\) \(\newcommand{\uhat}{\widehat{\uvec}}\) \(\newcommand{\what}{\widehat{\wvec}}\) \(\newcommand{\Sighat}{\widehat{\Sigma}}\) \(\newcommand{\lt}{<}\) \(\newcommand{\gt}{>}\) \(\newcommand{\amp}{&}\) \(\definecolor{fillinmathshade}{gray}{0.9}\)Local mean sea level is defined as the height of the sea with respect to a land benchmark, with fluctuations caused by waves and tides smoothed out. Locally perceived changes in mean sea level (also called relative sea-level changes) can be the result of either vertical movements of the land or an absolute (relative to the earth-centre) movement of the sea level (Fig. 2.17). The absolute sea-level changes are called eustatic changes and can be of the same order of magnitude as the vertical land movements.
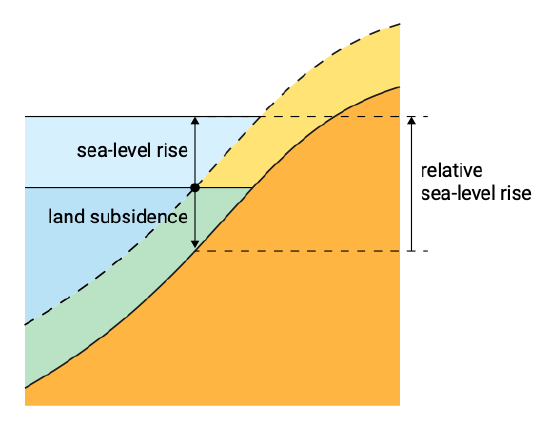
Eustatic sea-level changes are commonly defined as absolute vertical movements of the mean sea level (the oceanic geoid2) caused by:
- Changes in the volume of the ocean water through:
- Changes in the amount of water as a result of glaciations and deglaciations i.e. the advance and retreat of ice sheets and glaciers (glacio-eustasy);
- Changes in expansion of water (so-called steric changes due to temperature or salinity changes);
- Changesinthevolumeoftheoceanbasinsthroughduetotheveryslowprocess of tectonic plate divergence (tectono-eustasy), marine sedimentation or hydro-isostasy (see below);
- Changes in the distribution of water due to changes in the earth’s gravitational field and hence in the shape of the oceanic geoid (geoidal eustasy).
Of the listed items, the most important cause of long-term variations in eustatic sea level is changes in the amount of ocean water due to glaciations and deglaciations. This has happened often during earth’s history under the influence of global temperature change, and it is still happening. In the Quaternary, interglacial and glacial climates alternated at the higher latitudes of the Northern Hemisphere. During the cold periods the development of enormous ice sheets and glaciers resulted in an important lowering of the ocean level (more than 100 m) and large parts of the continental shelf became dry land or coastal swamp. The melting down of the ice sheets during the warmer periods resulted in the restoration of ocean level.
The last bulleted item should also be explained. Eustatic changes have long been believed to be worldwide and simultaneous. For that reason eustatic sea-level rise was also called global sea-level rise. It was only discovered in the early 1970s that the oceanic geoid is not uniform and constant. It has relief and is constantly deforming under the influence of gravitational and rotational changes as a result of amongst others the formation and melting of ice sheets. The changing shape of the geoid influences the worldwide distribution of water and therefore eustatic sea levels. This explained why eustatic sea-level changes during the last 6000 years, as reported by several authors before this effect was taken into account, were rather divergent.
Eustatic sea-level changes result in deformations of the earth’s crust, which is known as isostatic deformation (uplift or subsidence). The isostatic uplift or subsidence of the earth’s surface can take two forms:
- Glacio-isostasy is the loading and unloading by ice. It is related to the fact that the weight of the ice sheet depresses the underlying land. When the ice melts away the land areas previously covered by ice (above about 40°N) slowly rise. Adjacent areas that were never covered with ice tend to sink. This is known as isostatic rebound and subsidence.
- Hydro-isostasy is the loading and unloading by ocean water. It refers to the fact that melted water creates an additional load on the ocean floor. To attain isostatic equilibrium, the ocean floor is slowly depressed in response to sea-level changes. Simultaneously, the continents are flexed upward at their margins. This ‘continental levering’ of the continents may be restored when the water is tied up again in continental ice sheets.
Isostatic subsidence and rebound of the lithosphere not only impact relative sea-levels but also absolute sea levels via changes in the volume of the ocean basins.
As a result of both geoidal eustasy and isostasy, the world-wide distribution of sea-level change is spatially non-uniform. Clark et al. (1978) were amongst the first to model the spatially non-uniform deformation of the geoid and the earth’s surface in the last 6000 years as a result of viscoelastic isostatic responses to water and ice loads. They distinguished various geographic regions based on differences in Relative Sea Level (RSL) curves in response to the retreat of Northern Hemisphere ice sheets.
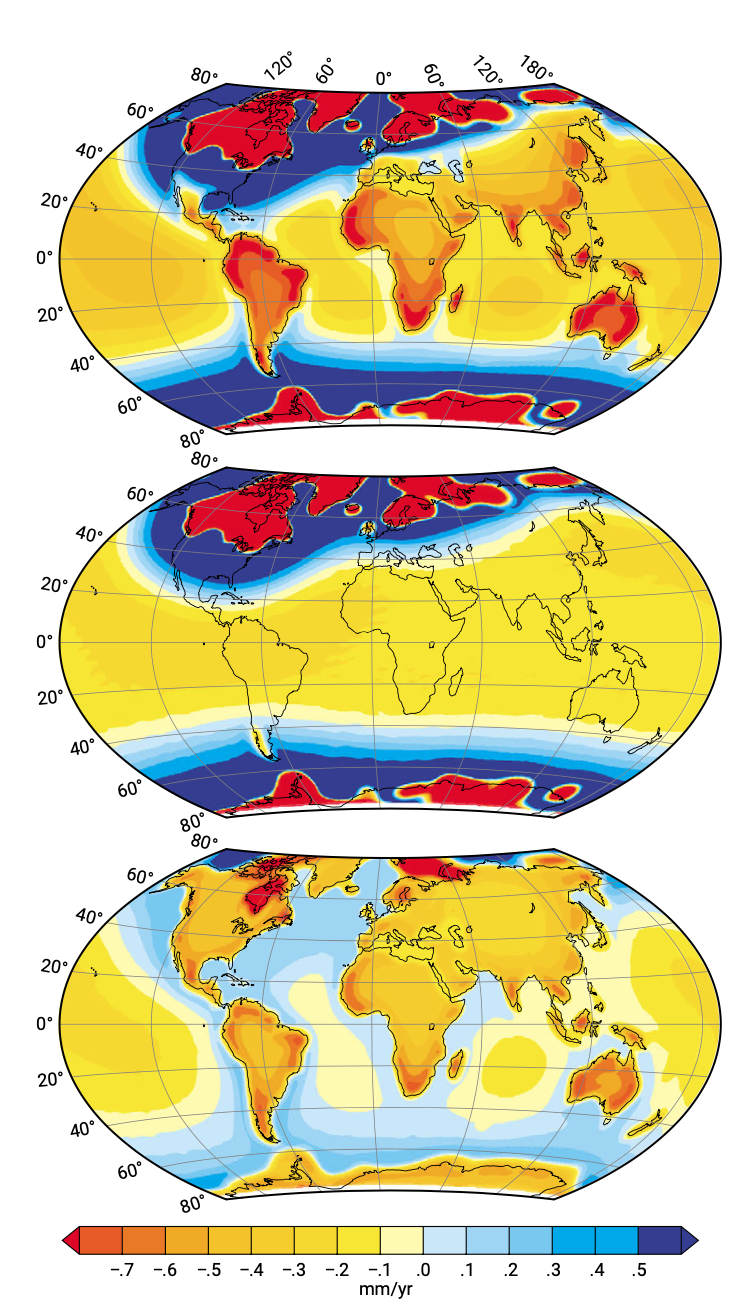
Figure 2.18 shows the results of more recent model predictions of the present-day rate of world-wide sea-level change in response to early Holocene deglaciation (Mitrovica & Milne, 2002). The sea-level change as predicted by Mitrovica and Milne (2002) is due to isostatic adjustments to changes in ice and ocean loading (including interactions with the earth’s gravitational field) assuming that Holocene deglaciation was complete 5000 years ago. Hence, the patterns reflect on-going sea-level adjustments during a time in which no meltwater is being added into the oceans. The saturated red zones are previously glaciated areas that experience ongoing rebound due to glacial unloading and thus RSL fall. The saturated blue zones experience RSL rise due to isostatic subsidence. Further notice the sea-level fall in equatorial basins. Continental levering is evident in the thin bands of offshore sea-level rise and onshore sea-level fall along coastlines in the far field from the late Pleistocene ice sheets; due to the additional water load on oceanic regions only, the continents are flexed upward at their margins and downward offshore. The above also implies that sea-level curves will differ between oceanic islands and continental margins.
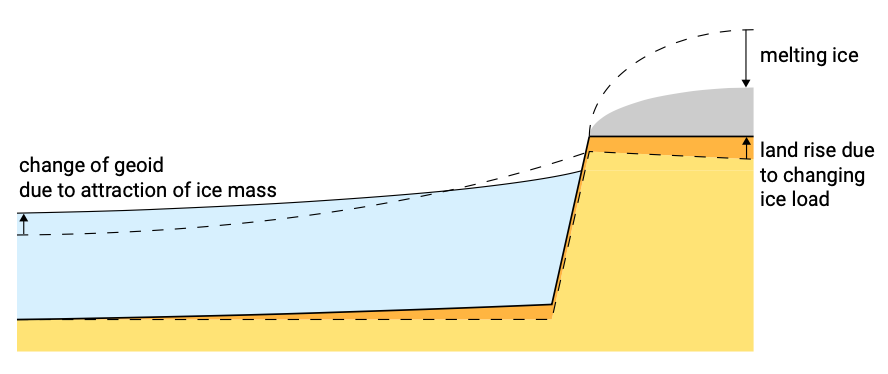
The processes underlying the spatially non-uniform sea-level change are illustrated in more detail in Fig. 2.19 (see also Tamisiea et al., 2003). The right hand panel clearly shows that there may be a sea-level fall in the vicinity of a melted (or melting) ice sheet or glacier (cf. the saturated red areas in Fig. 2.18). This spatial non-uniformity has implications also for future sea-level change in response to projected climatic change. If for instance the Greenland ice sheet were to melt significantly in the next centuries, the sea-level change around the Netherlands for instance could just as well be zero.
In addition to eustatic and isostatic effects, there are other factors that locally and regionally influence the relative sea-level changes, for instance:
- Regional subsidence can occur due to compaction of sediments and withdrawal of subsurface fluids such as groundwater, oil, and natural gas;
- Tectonic activity can cause upward or downward movements of the shore. Areas with important tectonic movements are for instance the earthquake zones in the western and southwestern Pacific and in the Mediterranean. In these areas shorelines can be uplifted, submerged or tilted by these (sudden) earth movements. In addition, most deltas are situated in slowly subsiding sedimentary basins (tectonic subsidence between 2 and 10 cm per century).
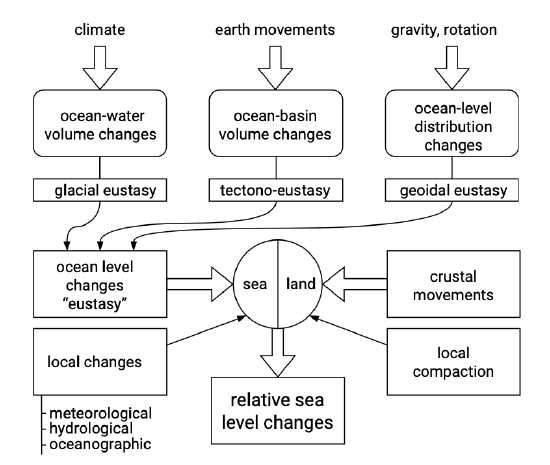
All factors contributing to the locally perceived, relative sea-level changes are summarised in Fig. 2.20.
Summarizing, curves of relative sea-level rise versus time can show large local and regional variations. This is especially true during the second half of the Holocene, the last say 6000 years, when the land icecaps had already nearly vanished.
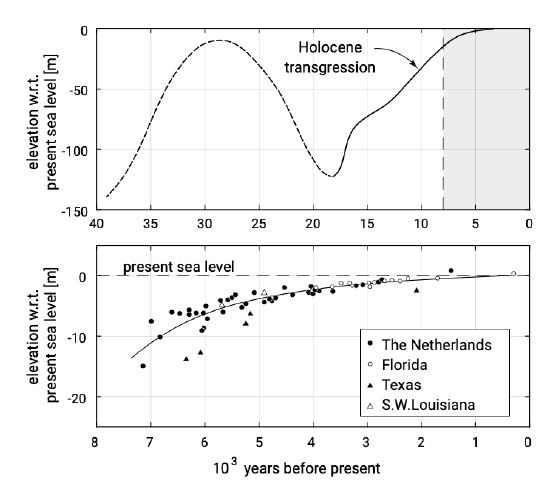
In Fig. 2.21 indications of Holocene sea-level changes are given for a number of relatively stable areas, i.e. without major subsidence or uplift (although in the Netherlands the bottom is slowly subsiding).
During the 20th century, the average rate of global sea-level rise was about 1.5 \(mm/yr\) to 2.0 \(mm/yr\). Satellite measurements taken over the first decade of the 21st century indicated that the rate of sea-level rise had gone up to 3.1 mm/yr. Apparently, the present-day rates of increase are in the order of magnitude of millimetres per year which is significantly larger than the recorded rates over the past few thousands of years (see Fig. 2.21). These accelerated rates of sea-level rise have been interpreted as evidence that atmospheric warming since the industrial revolution has led to thermal expansion of the oceans, melting of mountain glaciers and icecaps (Gornitz & Lebedeff, 1987) and loss of ice from the Greenland and West Antarctic ice sheets.
2. The geoid is a surface of equal gravitational attraction and is roughly equal to the mean sea-level surface (if dynamic effects are ignored).


