14.1: Thunderstorm Characteristics
- Page ID
- 9617
\( \newcommand{\vecs}[1]{\overset { \scriptstyle \rightharpoonup} {\mathbf{#1}} } \)
\( \newcommand{\vecd}[1]{\overset{-\!-\!\rightharpoonup}{\vphantom{a}\smash {#1}}} \)
\( \newcommand{\dsum}{\displaystyle\sum\limits} \)
\( \newcommand{\dint}{\displaystyle\int\limits} \)
\( \newcommand{\dlim}{\displaystyle\lim\limits} \)
\( \newcommand{\id}{\mathrm{id}}\) \( \newcommand{\Span}{\mathrm{span}}\)
( \newcommand{\kernel}{\mathrm{null}\,}\) \( \newcommand{\range}{\mathrm{range}\,}\)
\( \newcommand{\RealPart}{\mathrm{Re}}\) \( \newcommand{\ImaginaryPart}{\mathrm{Im}}\)
\( \newcommand{\Argument}{\mathrm{Arg}}\) \( \newcommand{\norm}[1]{\| #1 \|}\)
\( \newcommand{\inner}[2]{\langle #1, #2 \rangle}\)
\( \newcommand{\Span}{\mathrm{span}}\)
\( \newcommand{\id}{\mathrm{id}}\)
\( \newcommand{\Span}{\mathrm{span}}\)
\( \newcommand{\kernel}{\mathrm{null}\,}\)
\( \newcommand{\range}{\mathrm{range}\,}\)
\( \newcommand{\RealPart}{\mathrm{Re}}\)
\( \newcommand{\ImaginaryPart}{\mathrm{Im}}\)
\( \newcommand{\Argument}{\mathrm{Arg}}\)
\( \newcommand{\norm}[1]{\| #1 \|}\)
\( \newcommand{\inner}[2]{\langle #1, #2 \rangle}\)
\( \newcommand{\Span}{\mathrm{span}}\) \( \newcommand{\AA}{\unicode[.8,0]{x212B}}\)
\( \newcommand{\vectorA}[1]{\vec{#1}} % arrow\)
\( \newcommand{\vectorAt}[1]{\vec{\text{#1}}} % arrow\)
\( \newcommand{\vectorB}[1]{\overset { \scriptstyle \rightharpoonup} {\mathbf{#1}} } \)
\( \newcommand{\vectorC}[1]{\textbf{#1}} \)
\( \newcommand{\vectorD}[1]{\overrightarrow{#1}} \)
\( \newcommand{\vectorDt}[1]{\overrightarrow{\text{#1}}} \)
\( \newcommand{\vectE}[1]{\overset{-\!-\!\rightharpoonup}{\vphantom{a}\smash{\mathbf {#1}}}} \)
\( \newcommand{\vecs}[1]{\overset { \scriptstyle \rightharpoonup} {\mathbf{#1}} } \)
\(\newcommand{\longvect}{\overrightarrow}\)
\( \newcommand{\vecd}[1]{\overset{-\!-\!\rightharpoonup}{\vphantom{a}\smash {#1}}} \)
\(\newcommand{\avec}{\mathbf a}\) \(\newcommand{\bvec}{\mathbf b}\) \(\newcommand{\cvec}{\mathbf c}\) \(\newcommand{\dvec}{\mathbf d}\) \(\newcommand{\dtil}{\widetilde{\mathbf d}}\) \(\newcommand{\evec}{\mathbf e}\) \(\newcommand{\fvec}{\mathbf f}\) \(\newcommand{\nvec}{\mathbf n}\) \(\newcommand{\pvec}{\mathbf p}\) \(\newcommand{\qvec}{\mathbf q}\) \(\newcommand{\svec}{\mathbf s}\) \(\newcommand{\tvec}{\mathbf t}\) \(\newcommand{\uvec}{\mathbf u}\) \(\newcommand{\vvec}{\mathbf v}\) \(\newcommand{\wvec}{\mathbf w}\) \(\newcommand{\xvec}{\mathbf x}\) \(\newcommand{\yvec}{\mathbf y}\) \(\newcommand{\zvec}{\mathbf z}\) \(\newcommand{\rvec}{\mathbf r}\) \(\newcommand{\mvec}{\mathbf m}\) \(\newcommand{\zerovec}{\mathbf 0}\) \(\newcommand{\onevec}{\mathbf 1}\) \(\newcommand{\real}{\mathbb R}\) \(\newcommand{\twovec}[2]{\left[\begin{array}{r}#1 \\ #2 \end{array}\right]}\) \(\newcommand{\ctwovec}[2]{\left[\begin{array}{c}#1 \\ #2 \end{array}\right]}\) \(\newcommand{\threevec}[3]{\left[\begin{array}{r}#1 \\ #2 \\ #3 \end{array}\right]}\) \(\newcommand{\cthreevec}[3]{\left[\begin{array}{c}#1 \\ #2 \\ #3 \end{array}\right]}\) \(\newcommand{\fourvec}[4]{\left[\begin{array}{r}#1 \\ #2 \\ #3 \\ #4 \end{array}\right]}\) \(\newcommand{\cfourvec}[4]{\left[\begin{array}{c}#1 \\ #2 \\ #3 \\ #4 \end{array}\right]}\) \(\newcommand{\fivevec}[5]{\left[\begin{array}{r}#1 \\ #2 \\ #3 \\ #4 \\ #5 \\ \end{array}\right]}\) \(\newcommand{\cfivevec}[5]{\left[\begin{array}{c}#1 \\ #2 \\ #3 \\ #4 \\ #5 \\ \end{array}\right]}\) \(\newcommand{\mattwo}[4]{\left[\begin{array}{rr}#1 \amp #2 \\ #3 \amp #4 \\ \end{array}\right]}\) \(\newcommand{\laspan}[1]{\text{Span}\{#1\}}\) \(\newcommand{\bcal}{\cal B}\) \(\newcommand{\ccal}{\cal C}\) \(\newcommand{\scal}{\cal S}\) \(\newcommand{\wcal}{\cal W}\) \(\newcommand{\ecal}{\cal E}\) \(\newcommand{\coords}[2]{\left\{#1\right\}_{#2}}\) \(\newcommand{\gray}[1]{\color{gray}{#1}}\) \(\newcommand{\lgray}[1]{\color{lightgray}{#1}}\) \(\newcommand{\rank}{\operatorname{rank}}\) \(\newcommand{\row}{\text{Row}}\) \(\newcommand{\col}{\text{Col}}\) \(\renewcommand{\row}{\text{Row}}\) \(\newcommand{\nul}{\text{Nul}}\) \(\newcommand{\var}{\text{Var}}\) \(\newcommand{\corr}{\text{corr}}\) \(\newcommand{\len}[1]{\left|#1\right|}\) \(\newcommand{\bbar}{\overline{\bvec}}\) \(\newcommand{\bhat}{\widehat{\bvec}}\) \(\newcommand{\bperp}{\bvec^\perp}\) \(\newcommand{\xhat}{\widehat{\xvec}}\) \(\newcommand{\vhat}{\widehat{\vvec}}\) \(\newcommand{\uhat}{\widehat{\uvec}}\) \(\newcommand{\what}{\widehat{\wvec}}\) \(\newcommand{\Sighat}{\widehat{\Sigma}}\) \(\newcommand{\lt}{<}\) \(\newcommand{\gt}{>}\) \(\newcommand{\amp}{&}\) \(\definecolor{fillinmathshade}{gray}{0.9}\)Thunderstorms are convective clouds with large vertical extent, often with tops near the tropopause and bases near the top of the boundary layer. Their official name is cumulonimbus (see the Clouds Chapter), for which the abbreviation is Cb. On weather maps the symbol  represents thunderstorms, with a dot •, asterisk *, or triangle ∆ drawn just above the top of the symbol to indicate rain, snow, or hail, respectively. For severe thunderstorms, the symbol is
14.1.1. Appearance
A mature thunderstorm cloud looks like a mushroom or anvil with a relatively large-diameter flat top. The simplest thunderstorm (see Figs. 14.1 & 14.2) has a nearly vertical stem of diameter roughly equal to its depth (of order 10 to 15 km). The large top is called the anvil, anvil cloud, or thunderhead, and has the official name incus (Latin for anvil). The anvil extends furthest in a direction as blown by the upper-tropospheric winds.
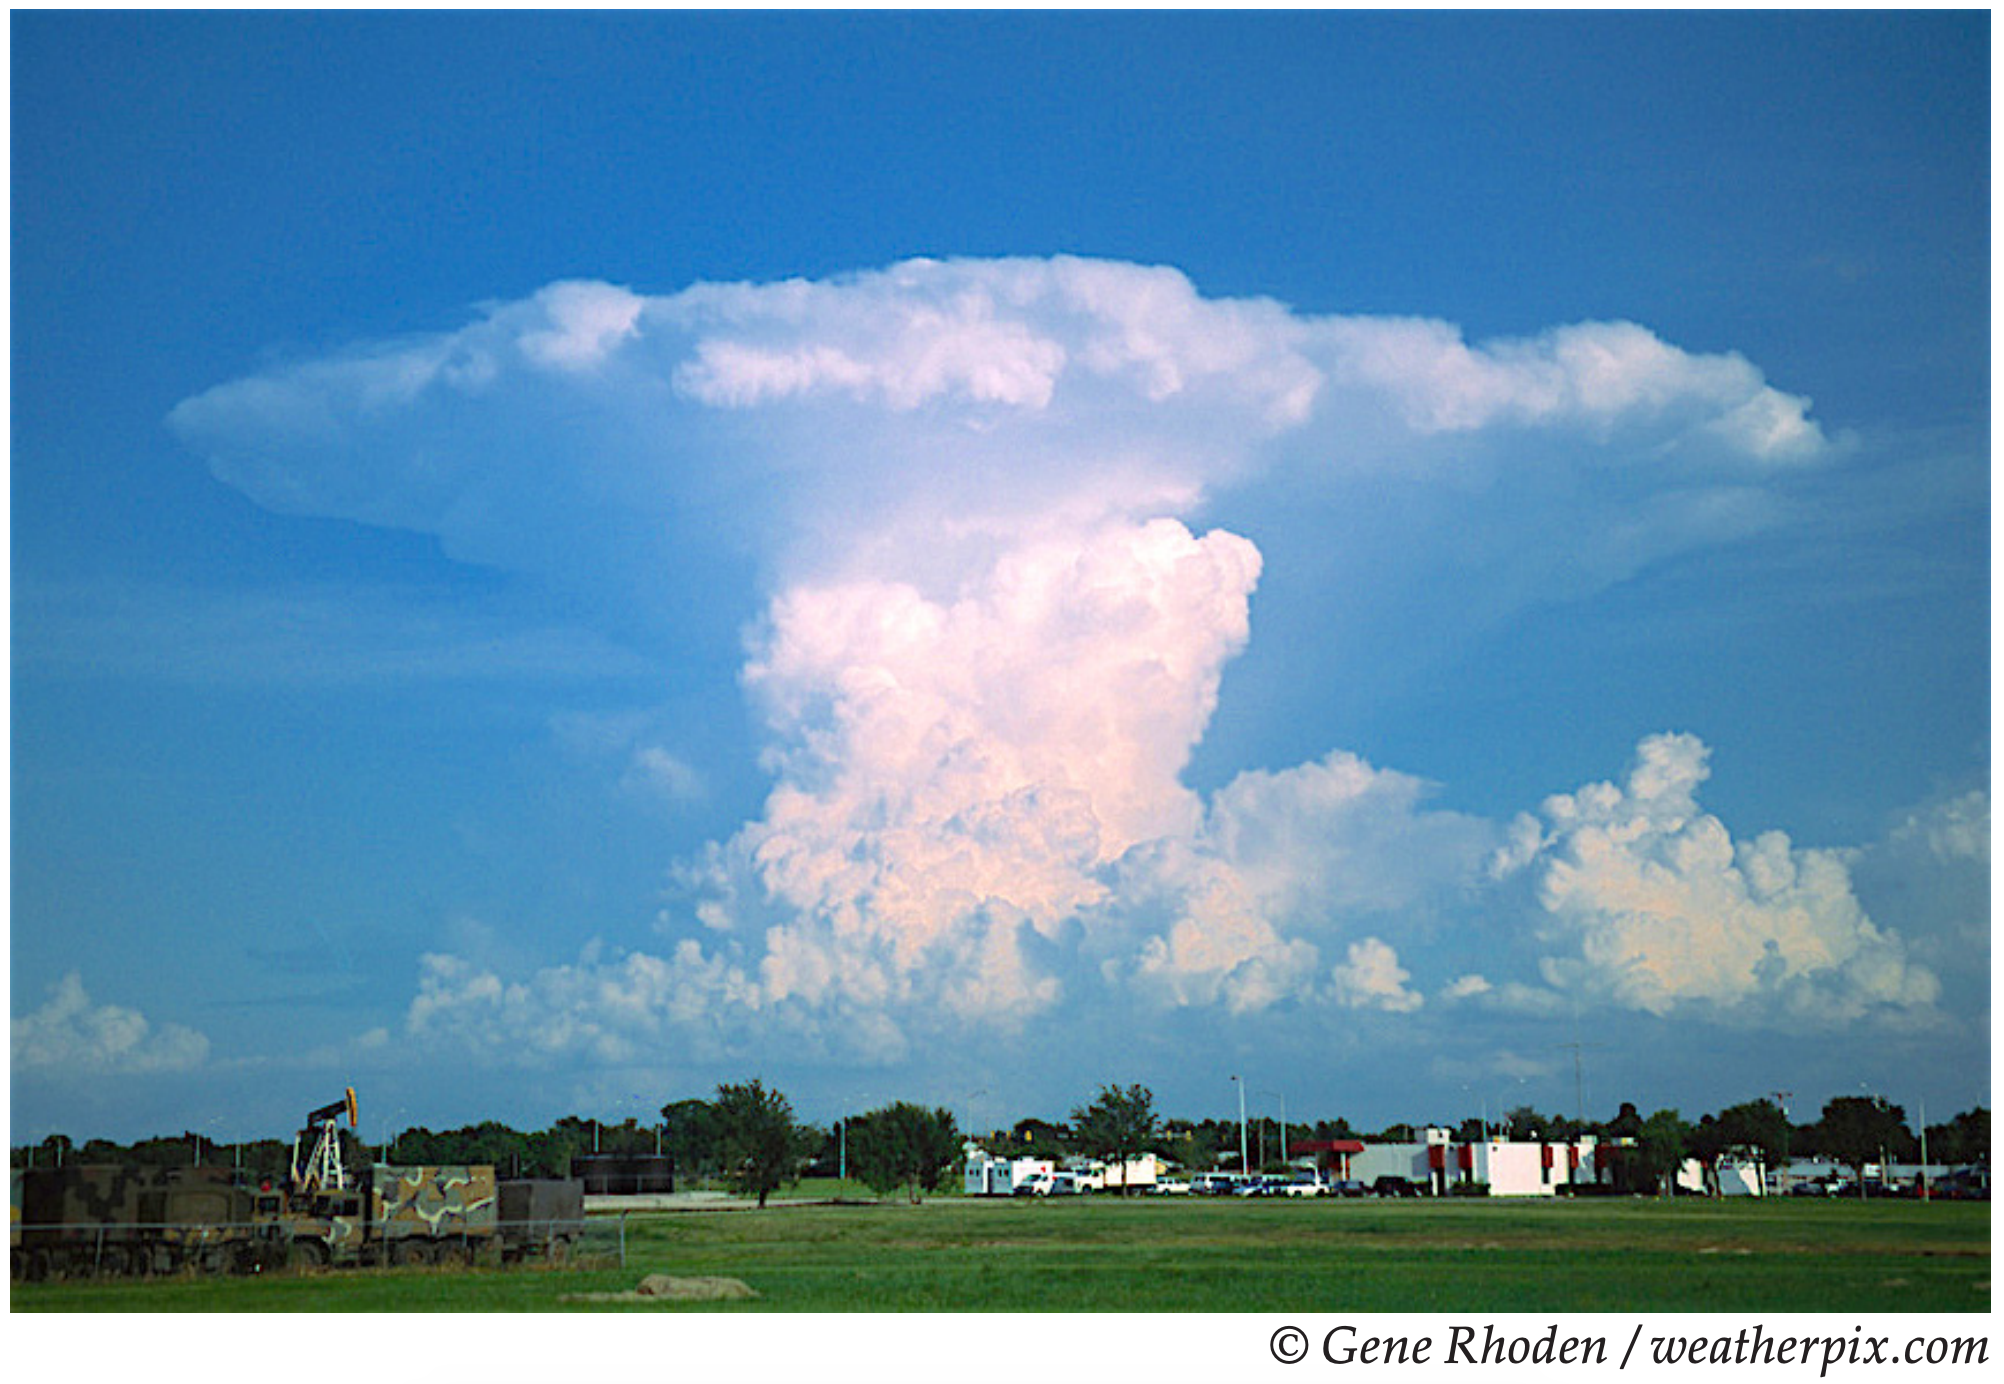
If the thunderstorm top is just starting to spread out into an anvil and does not yet have a fibrous or streaky appearance, then you identify the cloud as cumulonimbus calvus (see the Clouds Chapter). For a storm with a larger anvil that looks strongly glaciated (i.e., has a fibrous appearance associated with ice-crystal clouds), then you would call the cloud a cumulonimbus capillatus.
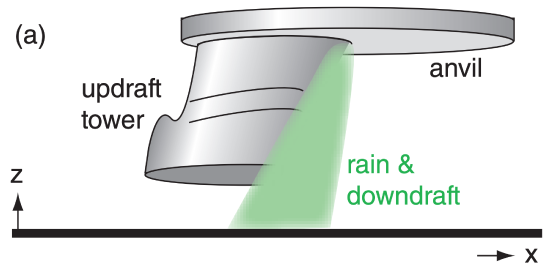
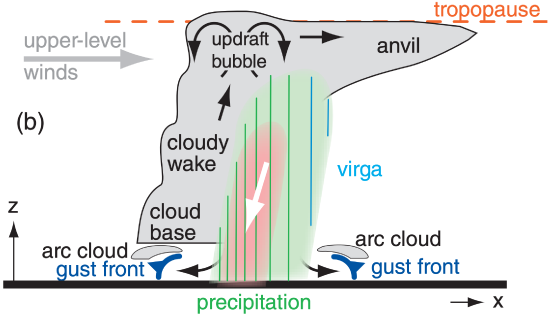
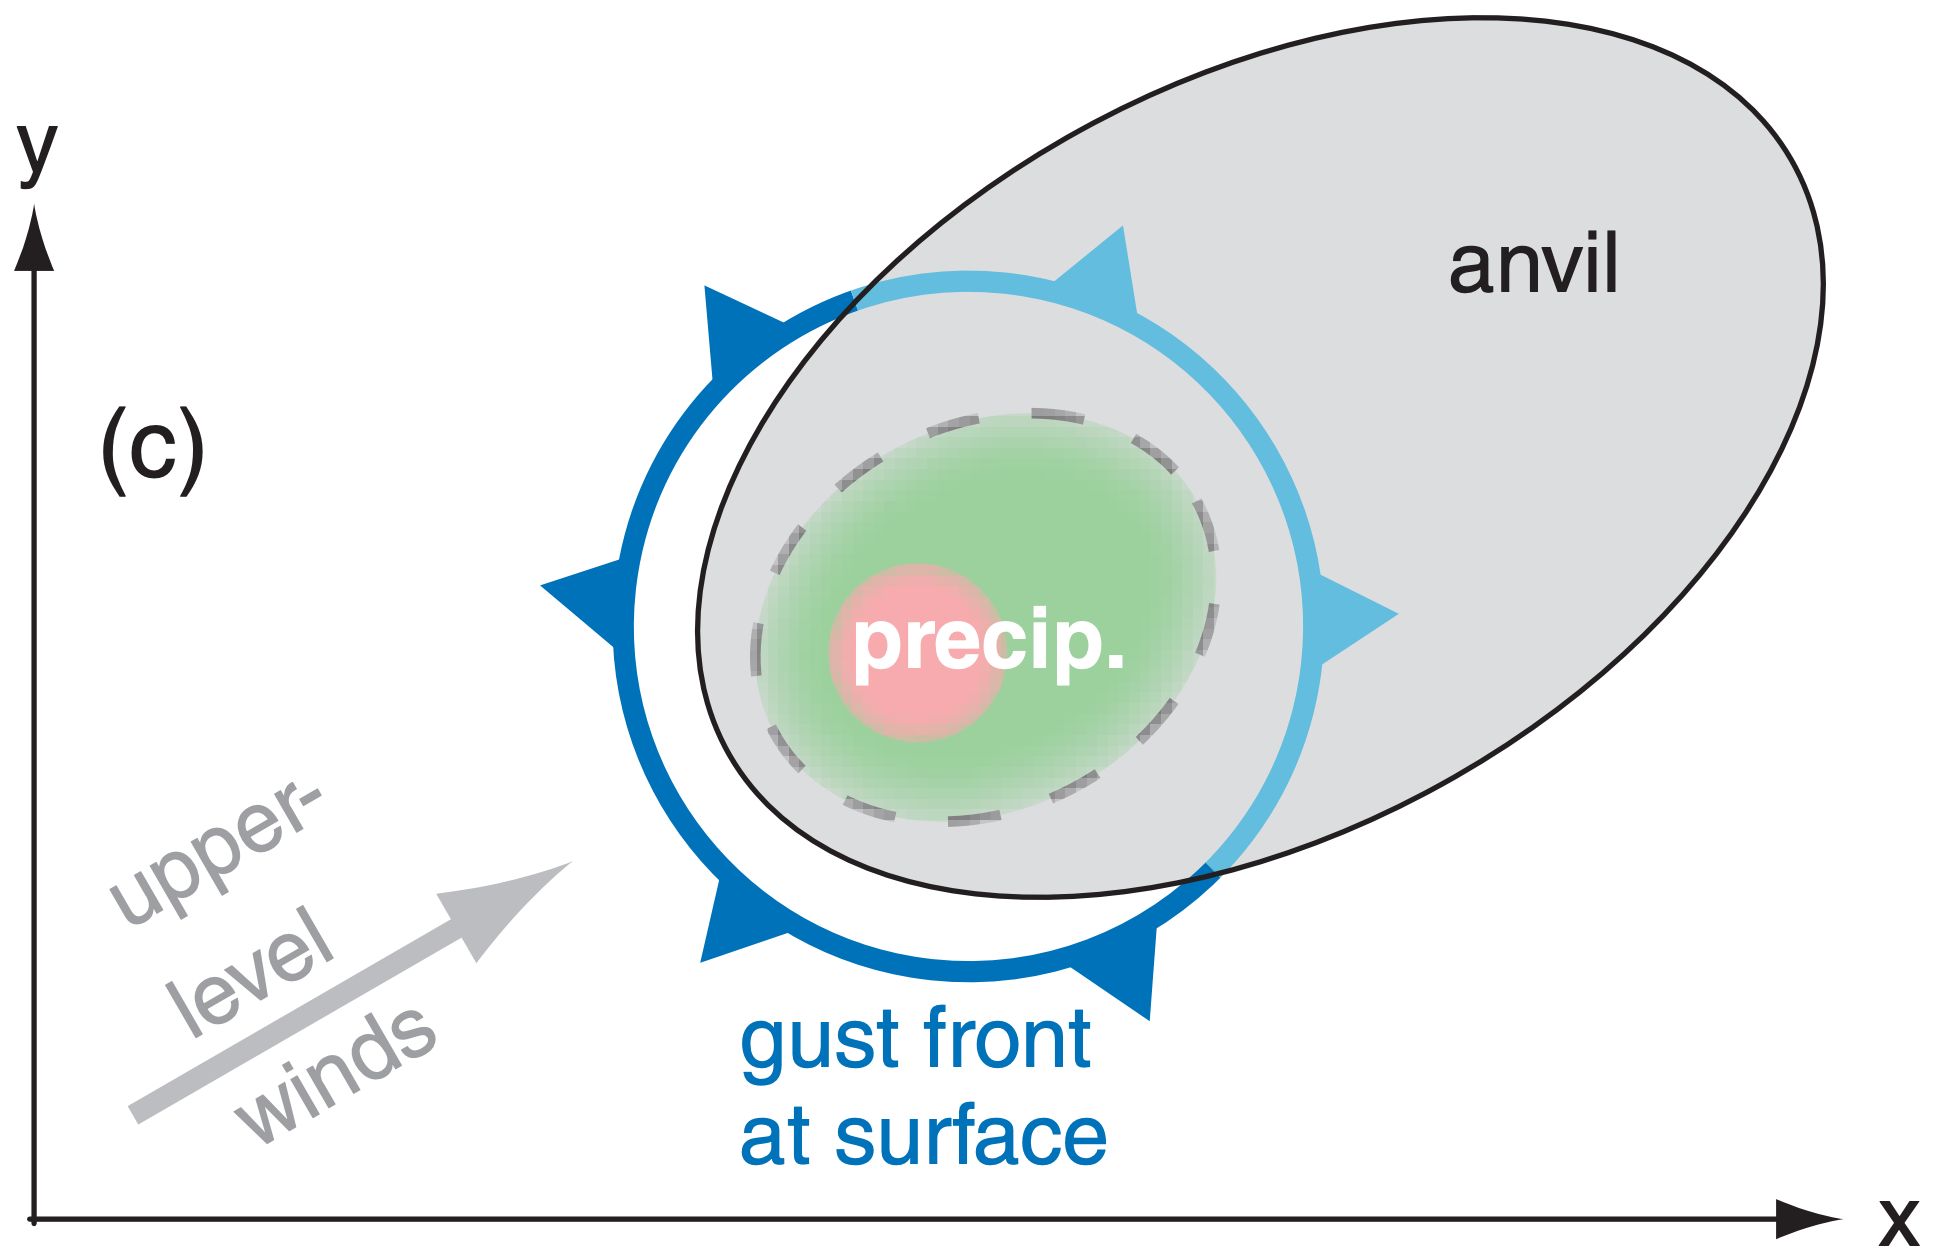
Within the stem of a mature thunderstorm is the cloudy main updraft tower topped by an updraft bubble (Fig. 14.2b). When this rising air hits the tropopause, it spreads to make the anvil. Also in the stem is a downdraft with precipitation. When the downdraft air hits the ground it spreads out, the leading edge of which is called the gust front. When viewed from the ground under the storm, the main updraft often has a darker cloud base, while the rainy region often looks not as dark and does not have a well-defined cloud base.
Not all cumulonimbus clouds have lightning and thunder. Such storms are technically not thunderstorms. However, in this book we will use the word thunderstorm to mean any cumulonimbus cloud, regardless of whether it has lightning.
More complex thunderstorms can have one or more updraft and downdraft regions. The most severe, long-lasting, less-frequent thunderstorms are supercell thunderstorms (Figs. 14.3 & 14.4).
14.1.2. Clouds Associated with Thunderstorms
Sometimes you can see other clouds attached to thunderstorms, such as a funnel, wall, mammatus, arc, shelf, flanking line, scud, pileus, dome, and beaver tail (Fig. 14.4). Not all thunderstorms have all these associated clouds.
Arc clouds (official name arcus, Fig. 14.2b) or shelf clouds form near the ground in boundarylayer air that is forced upward by undercutting cold air flowing out from the thunderstorm. These cloud bands mark the leading edge of gust-front outflow from the rear-flank downdraft (Fig. 14.4), usually associated with the flanking line. Often the undersides of arc clouds are dark and turbulent-looking, while their tops are smooth. Not all gust fronts have arc clouds, particularly if the displaced air is dry. See the Thunderstorm Hazards chapter.
The beaver tail (Fig. 14.4) is a smooth, flat, narrow, low-altitude cloud that extends along the boundary between the inflow of warm moist air to the thunderstorm and the cold air from the rain-induced forward flank downdraft (FFD).
A dome of overshooting clouds sometimes forms above the anvil top, above the region of strongest updraft. This is caused by the inertia of the upward moving air in the main updraft, which overshoots above its neutrally buoyant equilibrium level (EL). Storms that have overshooting tops are often more violent and turbulent.
The flanking line is a band of cumuliform clouds that increase from the medium-size cumulus mediocris (Cu med) furthest from the storm to the taller cumulus congestus (Cu con) close to the main updraft. Cumulus congestus are also informally called towering cumulus (TCu). The flanking line forms along and above the gust front, which marks the leading edge of colder outflow air from the rear-flank downdraft (RFD).
If humid layers of environmental air exist above rapidly rising cumulus towers, then pileus clouds can form as the environmental air is pushed up and out of the way of the rising cumulus clouds. Pileus are often very short lived because the rising cloud tower that caused it often keeps rising through the pileus and obliterates it.
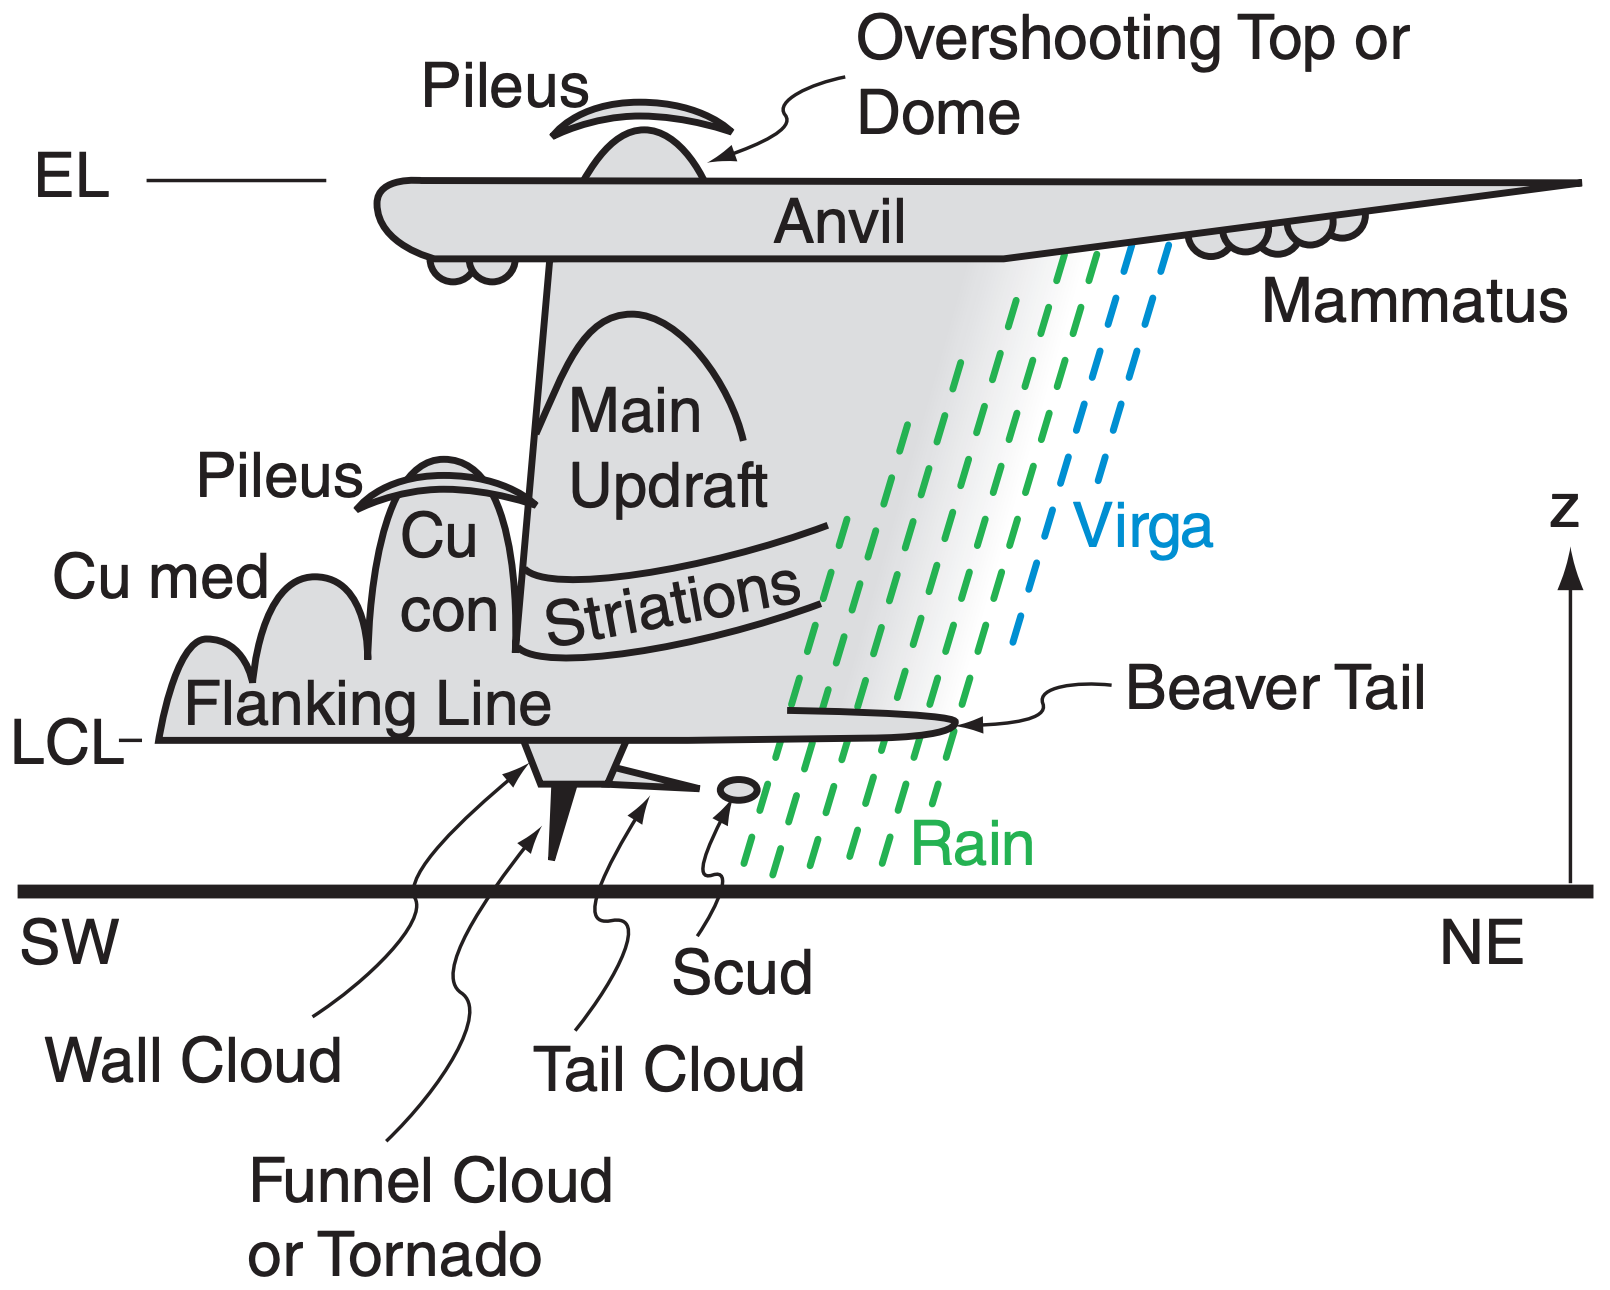
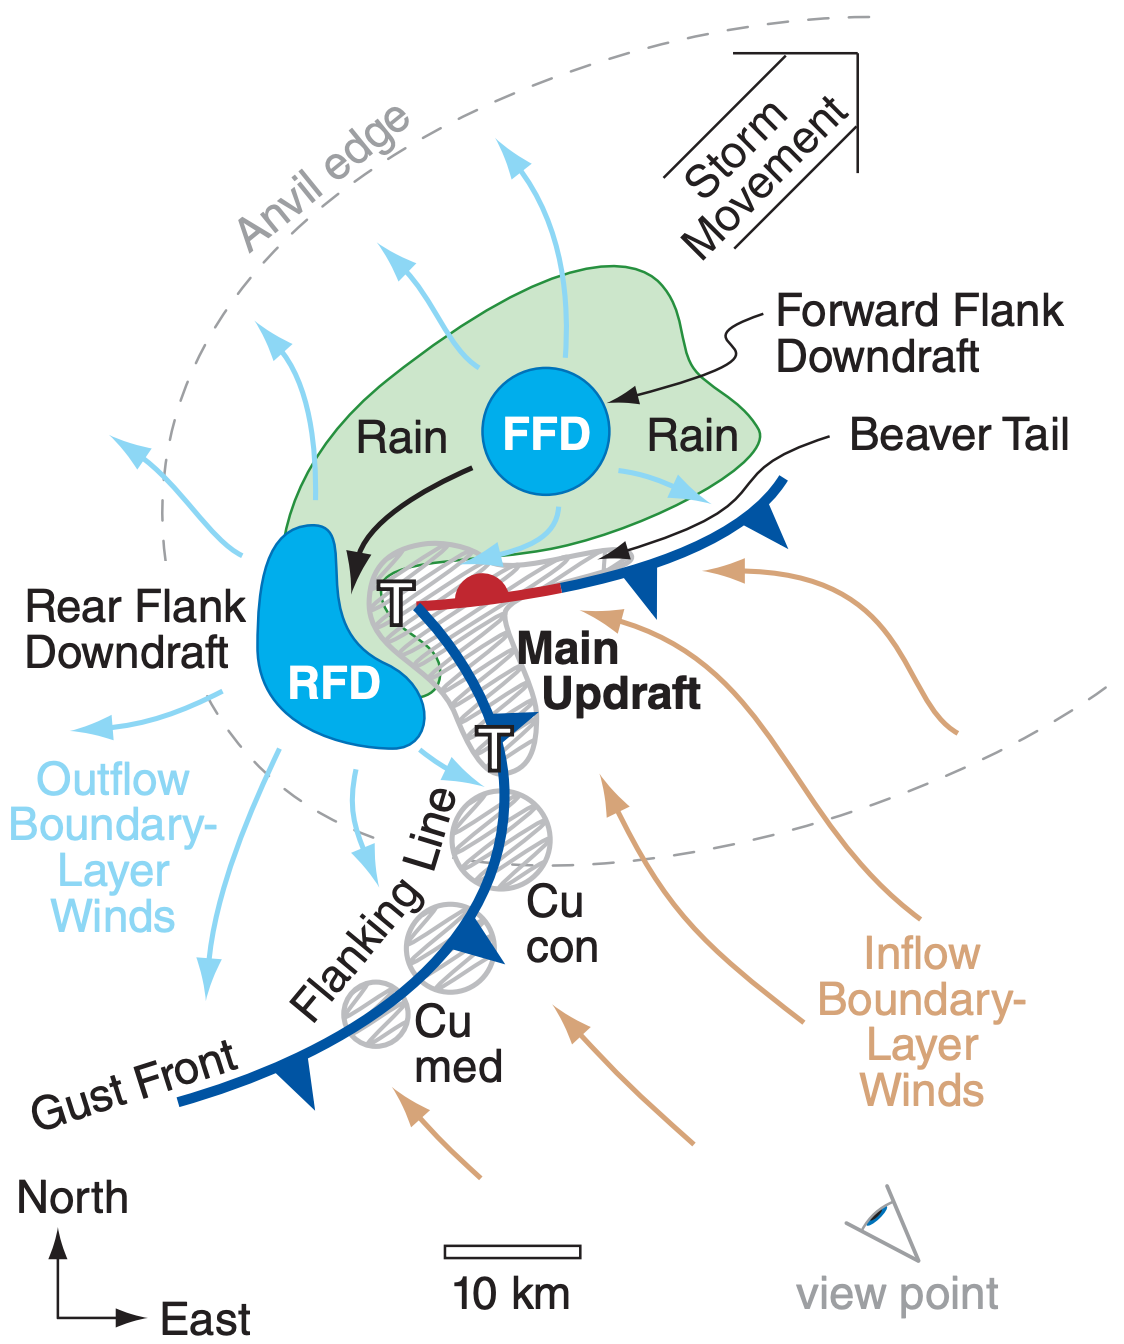
The most violent thunderstorms are called supercell storms (Figs. 14.3 & 14.4), and usually have a quasi-steady rotating updraft (called a mesocyclone). The main thunderstorm updraft in supercells sometimes has curved, helical cloud striations (grooves or ridges) on its outside similar to threads of a screw (Fig. 14.4a). Supercells can produce intense tornadoes (violently rotating columns of air), which can appear out of the bottom of an isolated cylindrical lowering of the cloud base called a wall cloud. The portion of the tornado made visible by cloud droplets is called the funnel cloud, which is the name given to tornadoes not touching the ground. Tornadoes are covered in the next chapter. Most thunderstorms are not supercell storms, and most supercell storms do not have tornadoes.
Attached to the base of the wall cloud is sometimes a short, horizontal cloud called a tail cloud, which points towards the forward flank precipitation area. Ragged cloud fragments called scud (cumulus fractus) often form near the tip of the tail cloud and are drawn quickly into the tail and the wall cloud by strong winds.
The wall cloud and tornado are usually near the boundary between cold downdraft air and the low-level warm moist inflow air, under a somewhat rain-free cloud base. In mesocyclone storms, you can see the wall cloud rotate by eye, while rotation of the larger-diameter supercell is slower and is apparent only in time-lapse movies. Non-rotating wall clouds also occur with non-rotating thunderstorms (i.e., non-supercell storms).
The rain portion of a thunderstorm is often downwind of the main updraft, in the forward portion of the storm. Cloud edges and boundaries are often not distinguishable in the rain region. Although thunderstorms are rare in cold weather, when they occur they can cause very heavy snowfall instead of rain. Further downwind of the heavy rain area is a region of virga, where the precipitation (rain or snow) evaporates before reaching the ground.
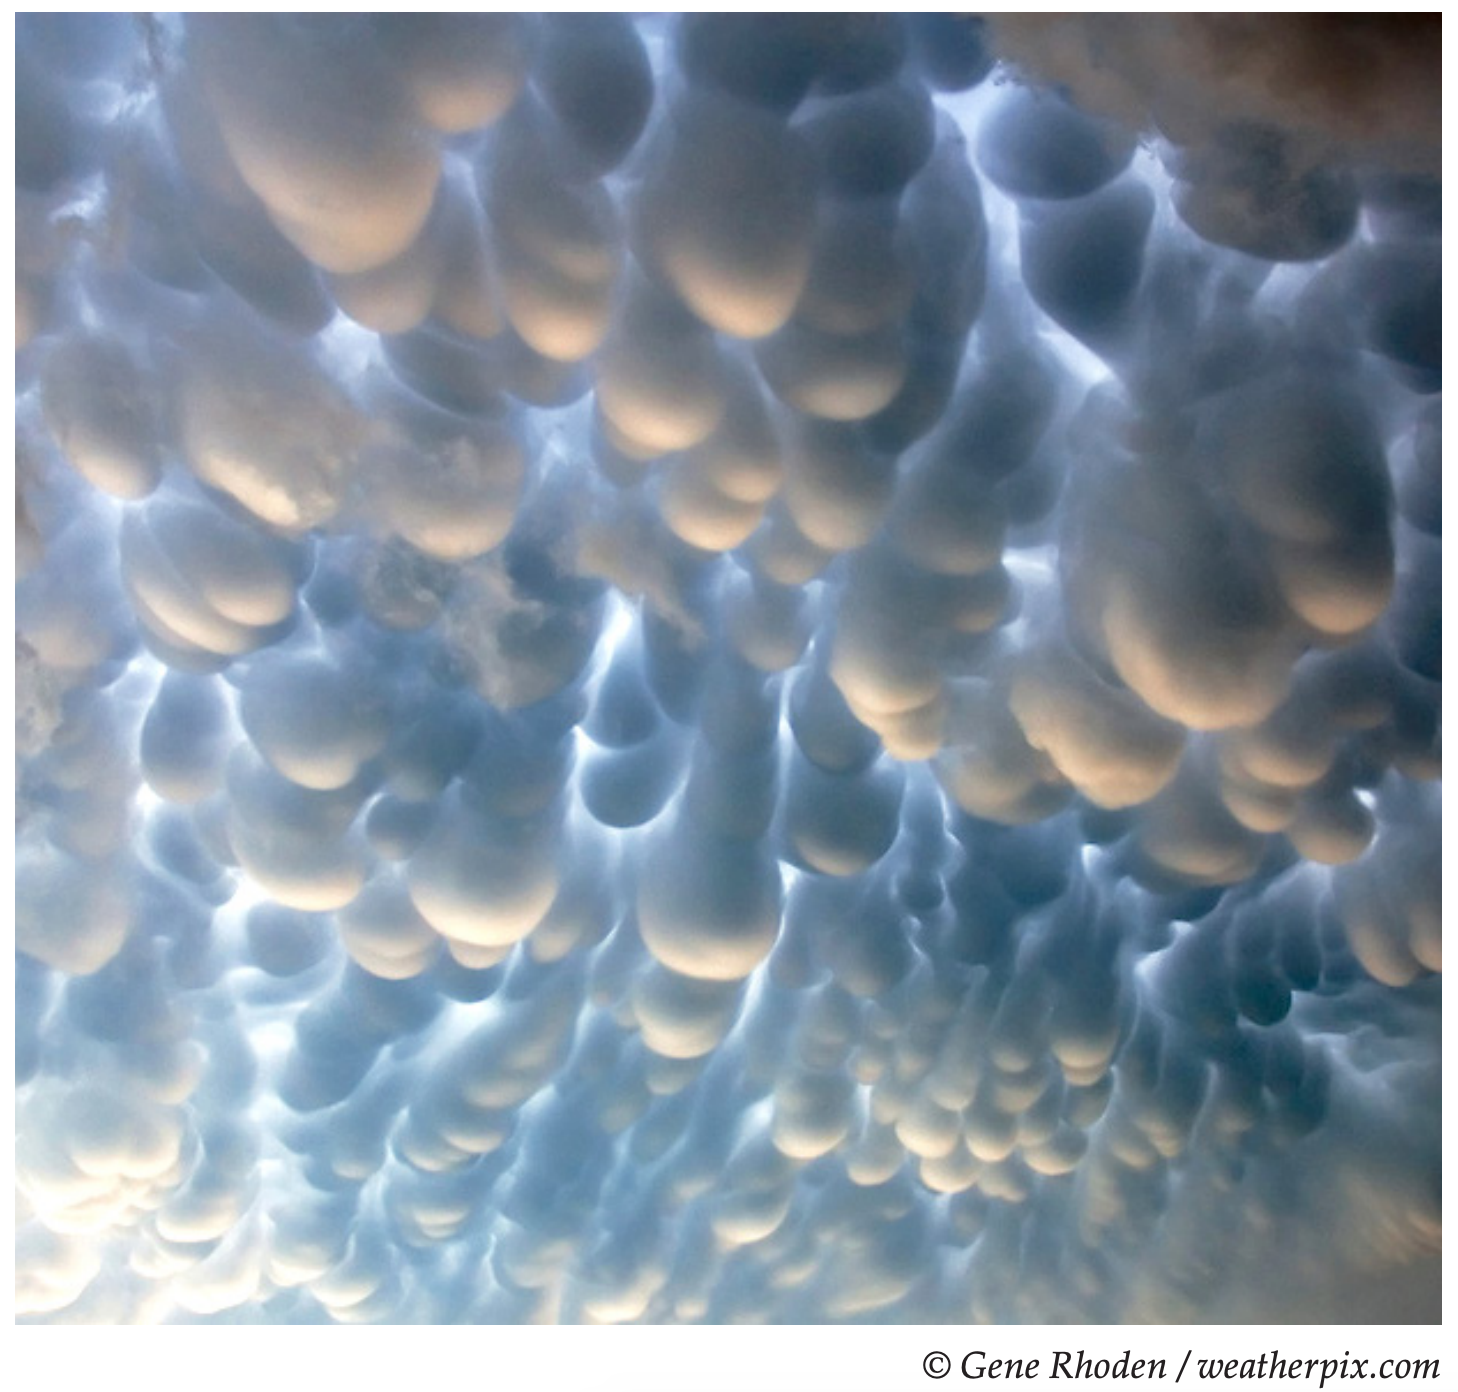
Mammatus clouds look like sacks or protuberances hanging from the bottom of layered clouds, and are sometimes found on the underside of thunderstorm anvils (Fig. 14.5). No correlation exists between the presence of mammatus clouds and the intensity of thunderstorms (i.e., hail, tornadoes, etc.). Not all thunderstorms have mammatus clouds.
Mammatus forms because static instability in the anvil-base air drives convective overturning. The colder, droplet-laden cloudy air is sinking from the anvil cloud as mammatus lobes. Between each lobe is a return circulation of upward-moving warmer drier non-cloudy air from just under cloud base. Mammatus likelihood is greatest when the air just under the anvil is very warm and dry.
Two processes have been suggested for causing this static instability. One is infrared radiation: cloud droplets are better emitters of IR radiation than dry air, which causes the cloudy lobes to cool faster than the drier air below anvil base. The other process is cloud-base detrainment instability, which works as follows. Sinking air in the mammatus lobes are laden with cloud droplets or ice crystals. As some of the sinking air mixes out of the lobe (detrains) into the surrounding environment, evaporation of some of the water from the detrained air helps keep the mammatus clouds cooler than their environment, due to the latent heat of vaporization.
In an environment with weak wind shear, the anvil cloud in weak thunderstorms can be symmetrical, looking like a mushroom cap (Fig. 14.1). However, for larger, longer lasting thunderstorms in the presence of strong winds aloft, the ice crystals brought up by the main updraft will spread out asymmetrically (Fig. 14.2) in an anvil that can be 100 km wide (crosswind) and 300 km long (downwind).
If you want to chase and photograph isolated storms in N. America, the best place to be is well to the side of the storm’s path. As most storms move northeast in N. America, this corresponds to your being southeast of the thunderstorm. This location is relatively safe with good views of the storm and the tornado (see “A SCI. PERSPECTIVE • Be Safe”).
For non-chasers overtaken by a storm, the sequence of events they see is: cirrus anvil clouds, mammatus clouds (if any), gust front (& arc cloud, if any), rain, hail (if any), tornado (if any), and rapid clearing with sometimes a rainbow during daytime.
Sample Application
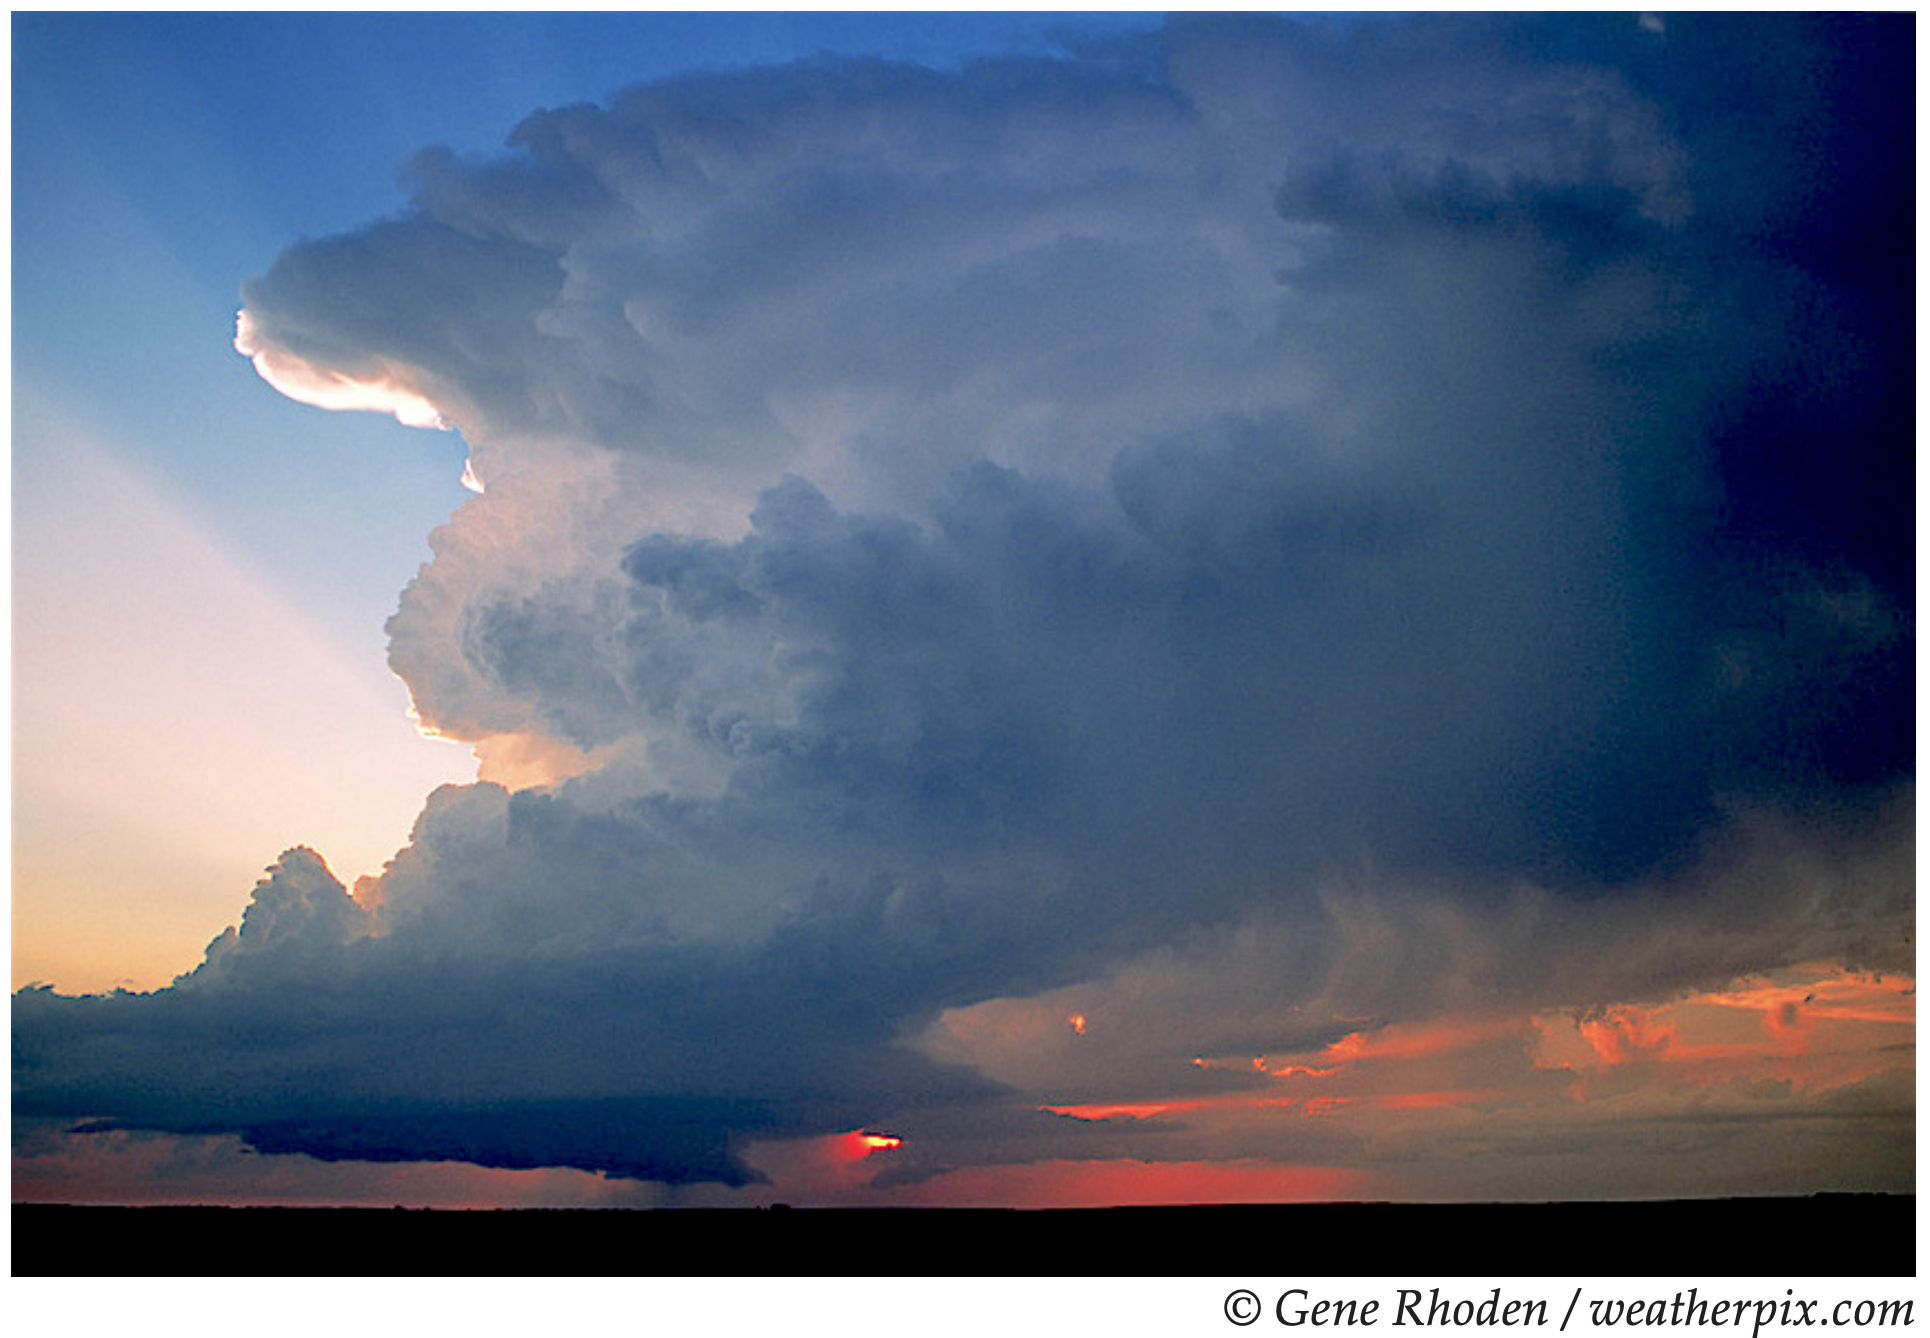
Identify the thunderstorm features, components, and associated clouds that are in Fig. 14.3.
Find the Answer
Given: Photo 14.3, reproduced here.
Find: Cloud features.
Method: Compare photo 14.3 to diagram 14.4a.
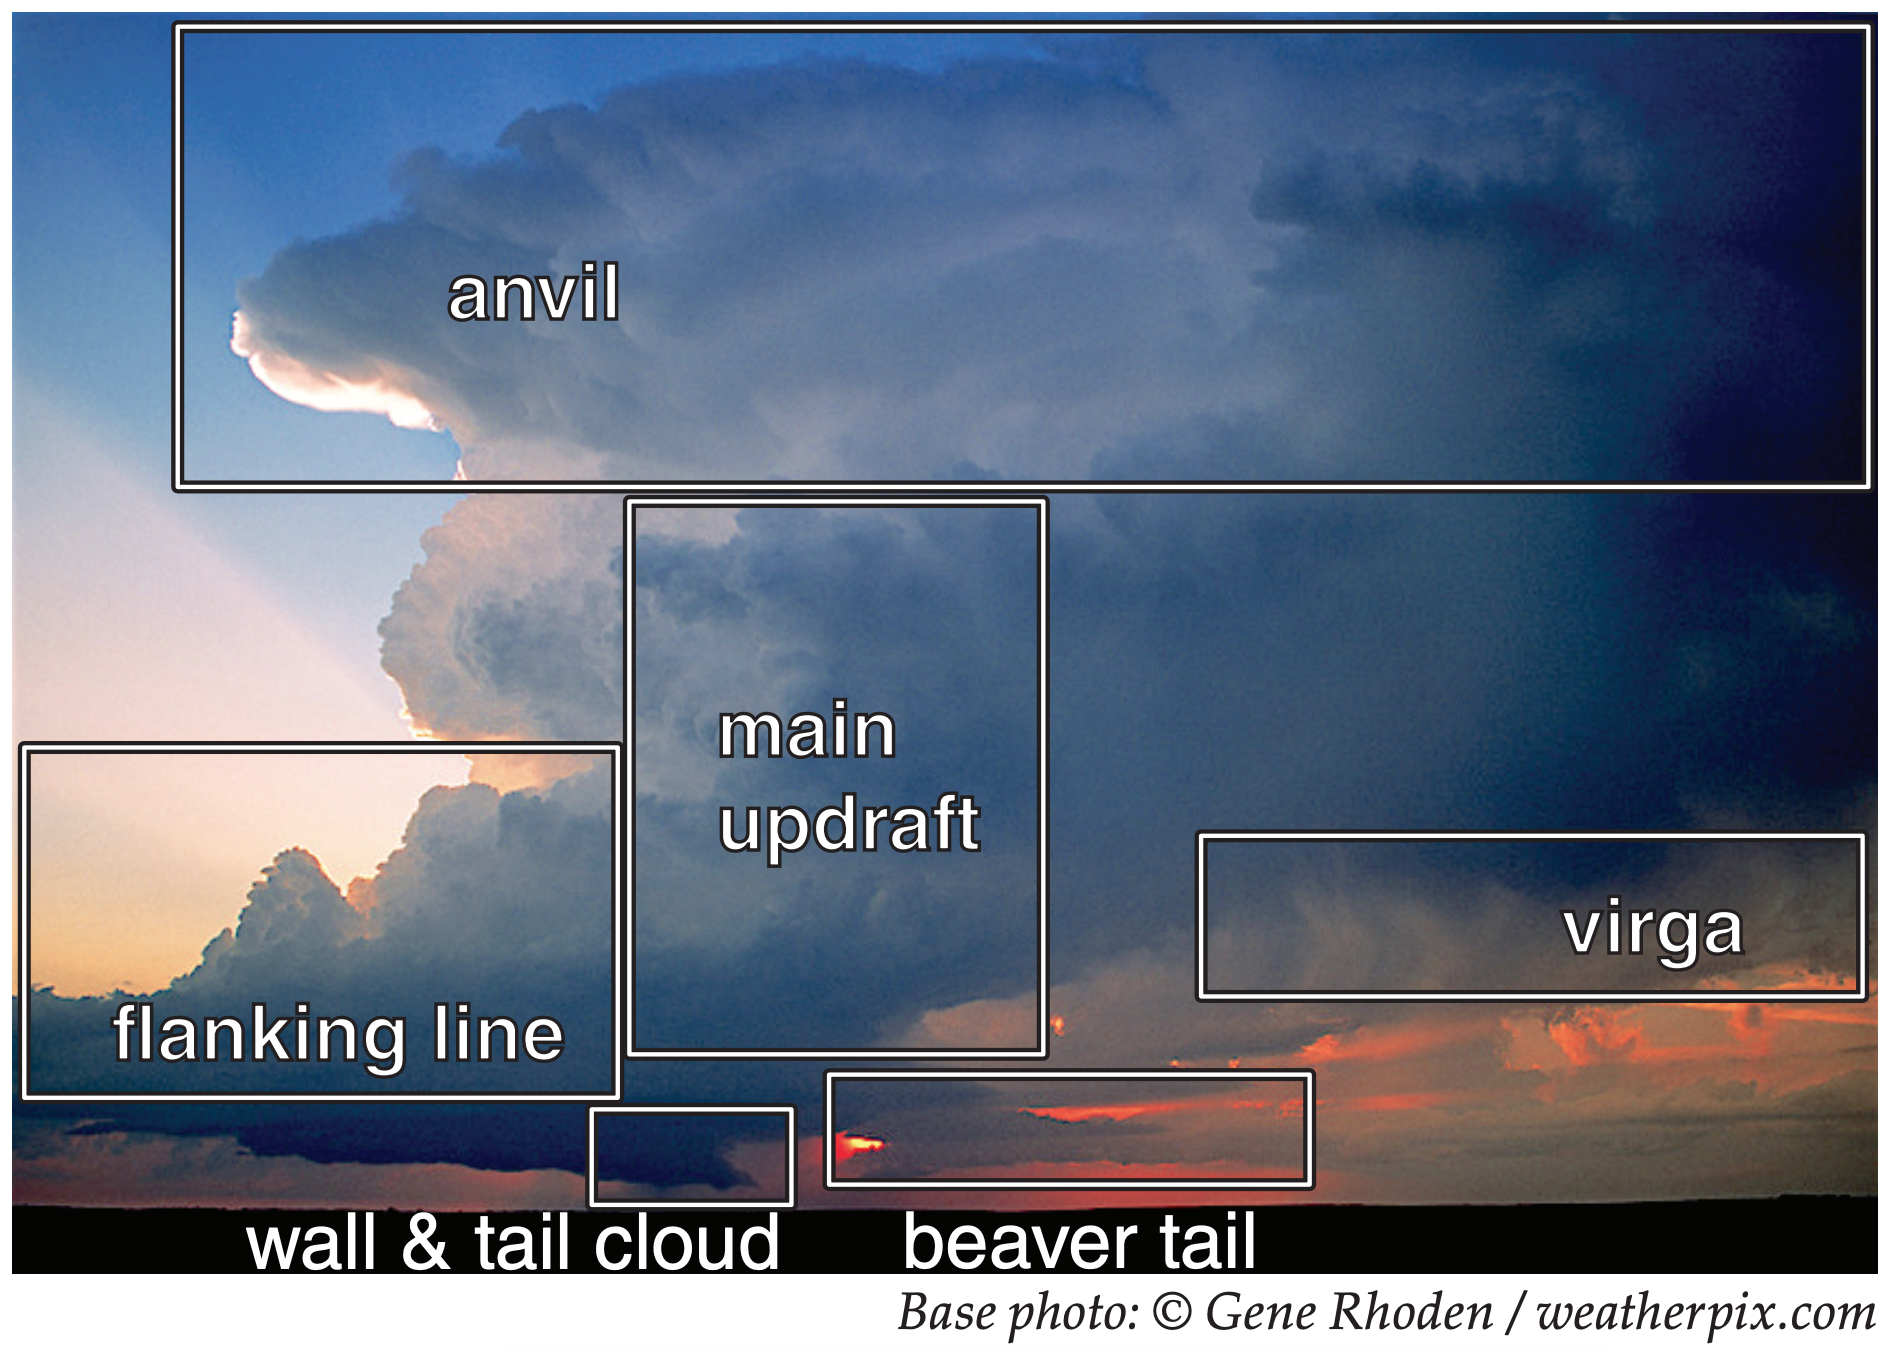
Exposition: This cloud is a supercell thunderstorm, because it looks more like the cloud sketched in Fig. 14.4a than the simple single-cell air-mass thunderstorm in Fig. 14.2. The main updraft is tilted from lower left to upper right, a sign of wind shear in the environment. If a tornado exists under the wall cloud, it is too small to see in this figure. Given the orientation of the cloud features (similar to those in Fig 14.4a), the photographer was probably looking toward the northwest, and the thunderstorm is moving toward the northeast (to the right in this figure).
14.1.3. Cells & Evolution
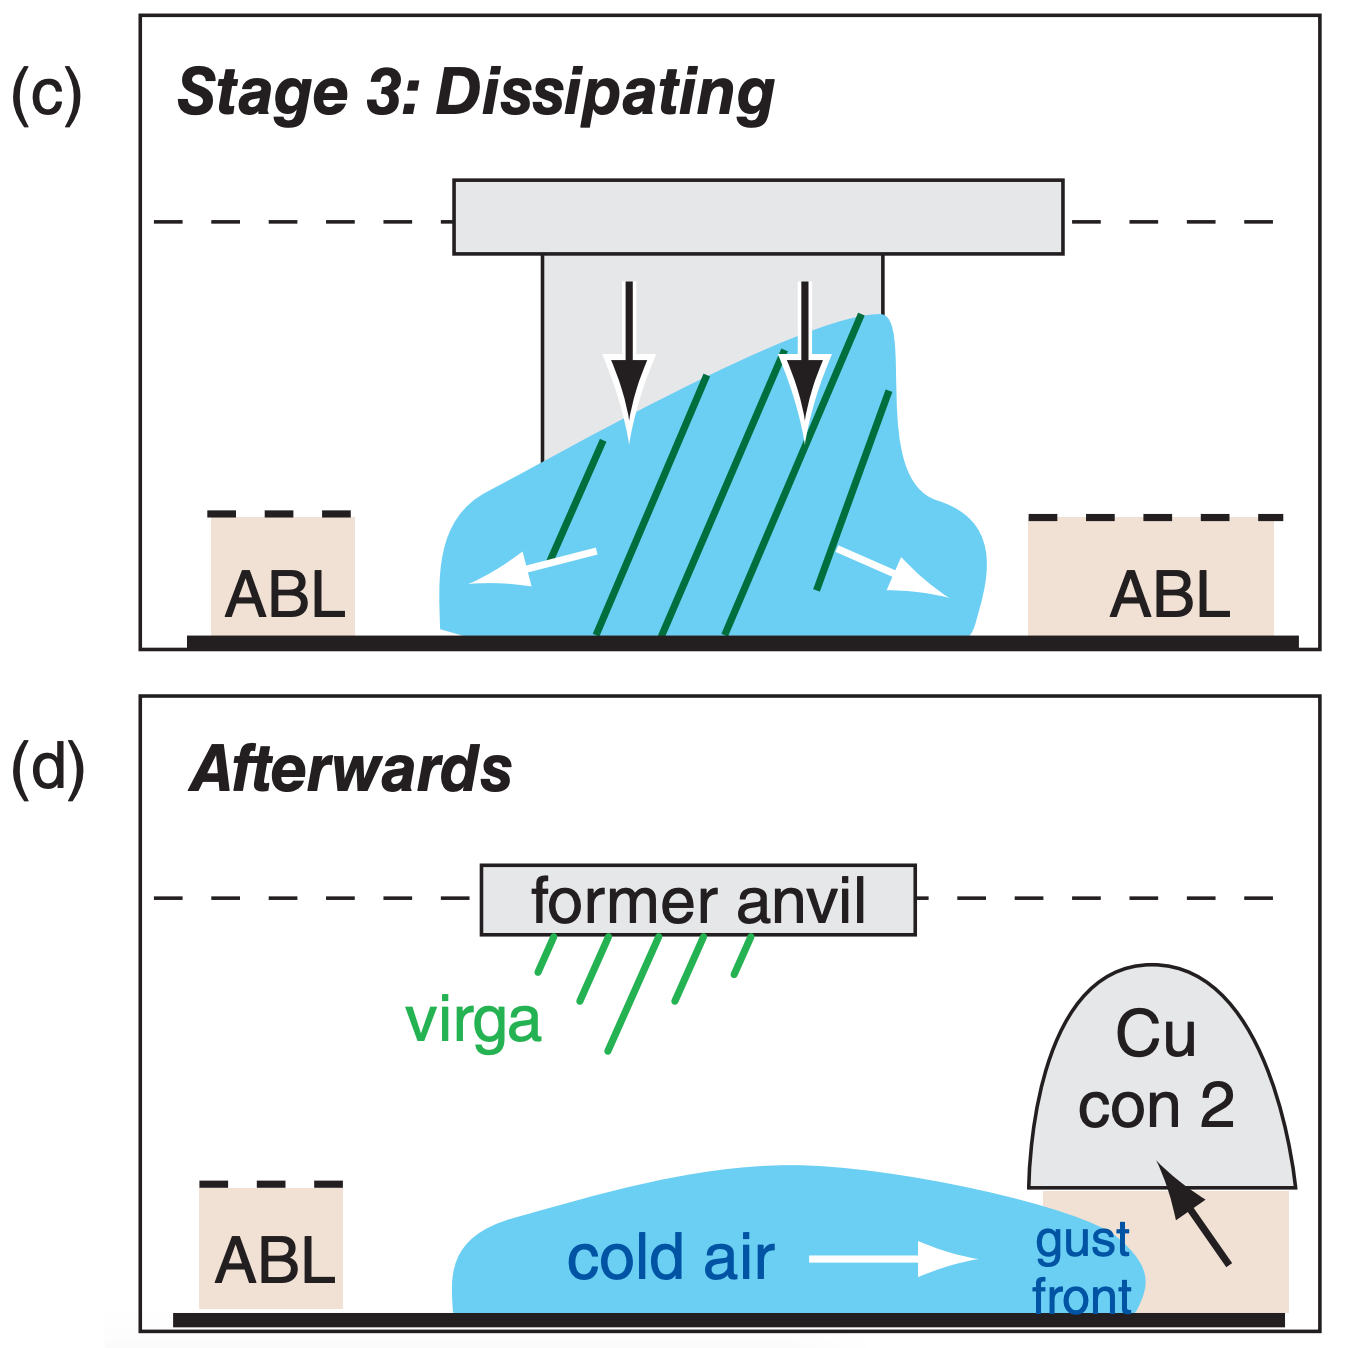
The fundamental structural unit of a thunderstorm is a thunderstorm Byers-Braham cell, which is of order 10 km in diameter and 10 km thickness (i.e., its aspect ratio = depth/width = 1 ). Its evolution has three stages: (1) towering-cumulus; (2) mature; and (3) dissipation, as sketched in Fig. 14.6. Each individual cell lasts about 30 to 60 min.
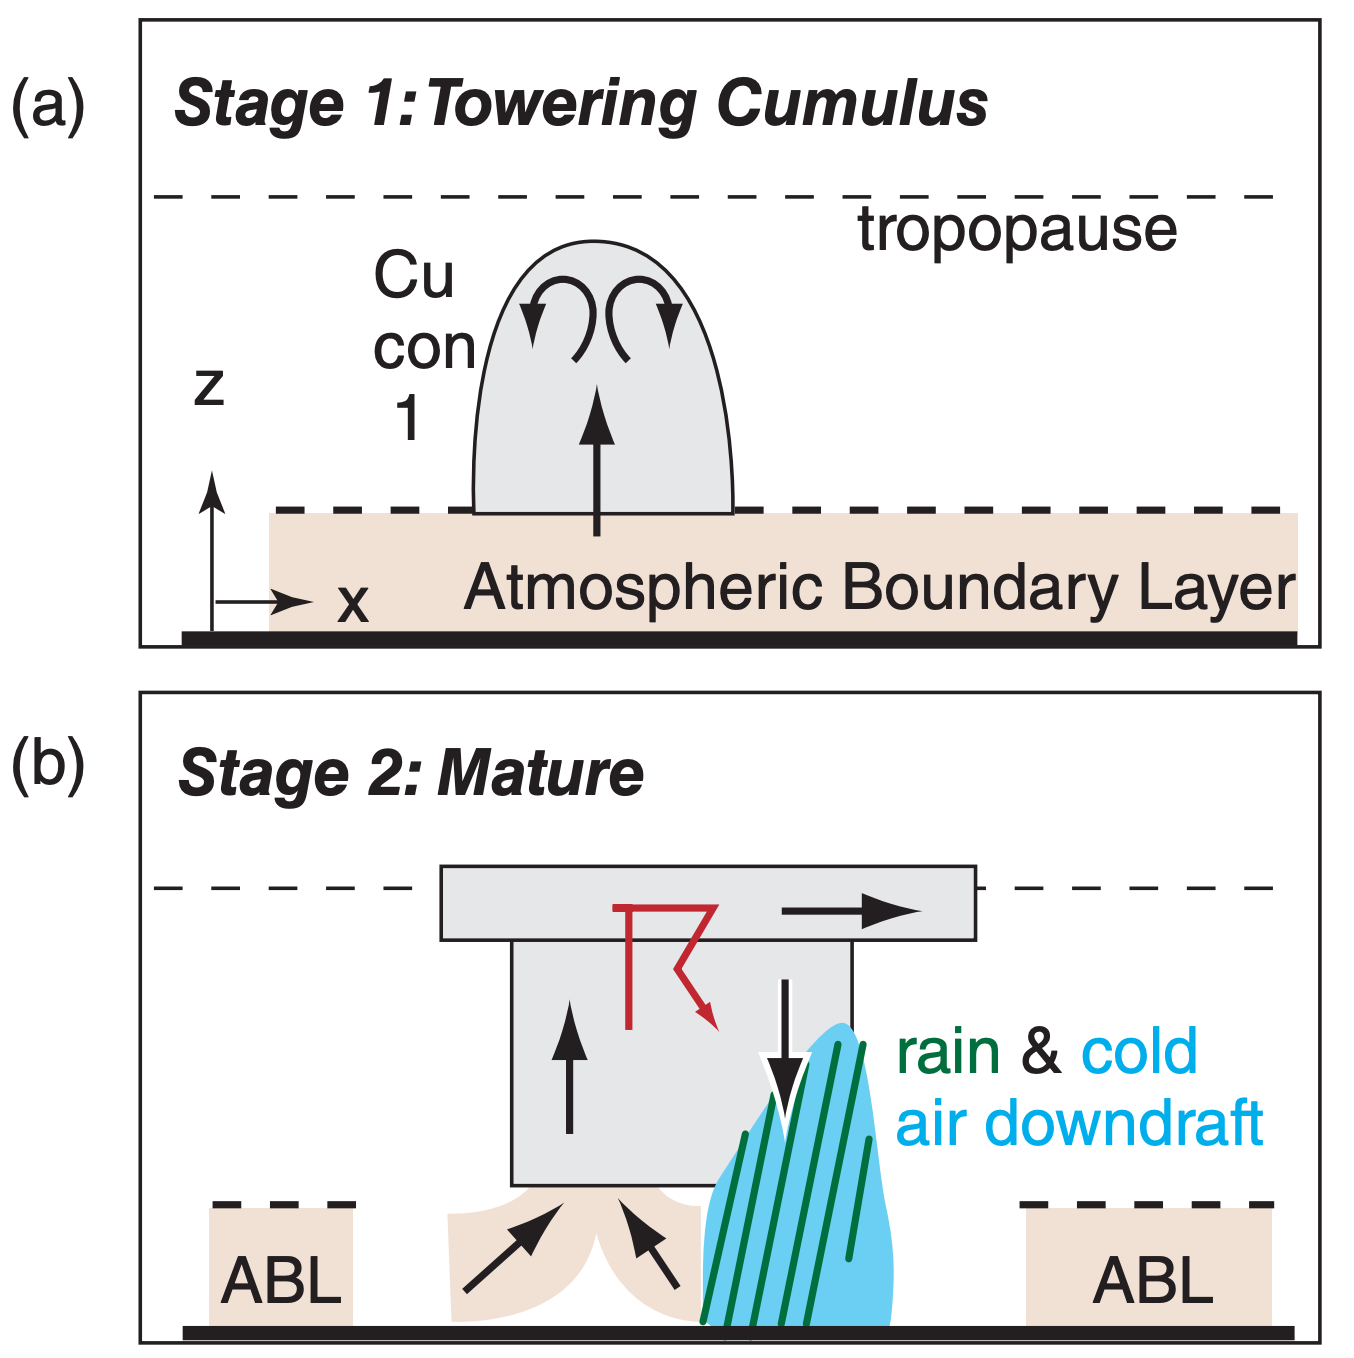
The towering cumulus stage consists of only updraft in a rapidly growing cumulus congestus tower. It has no anvil, no downdrafts, and no precipitation. It is drawing warm humid boundary-layer air into the base of the storm, to serve as fuel. As this air rises the water vapor condenses and releases latent heat, which adds buoyancy to power the storm.
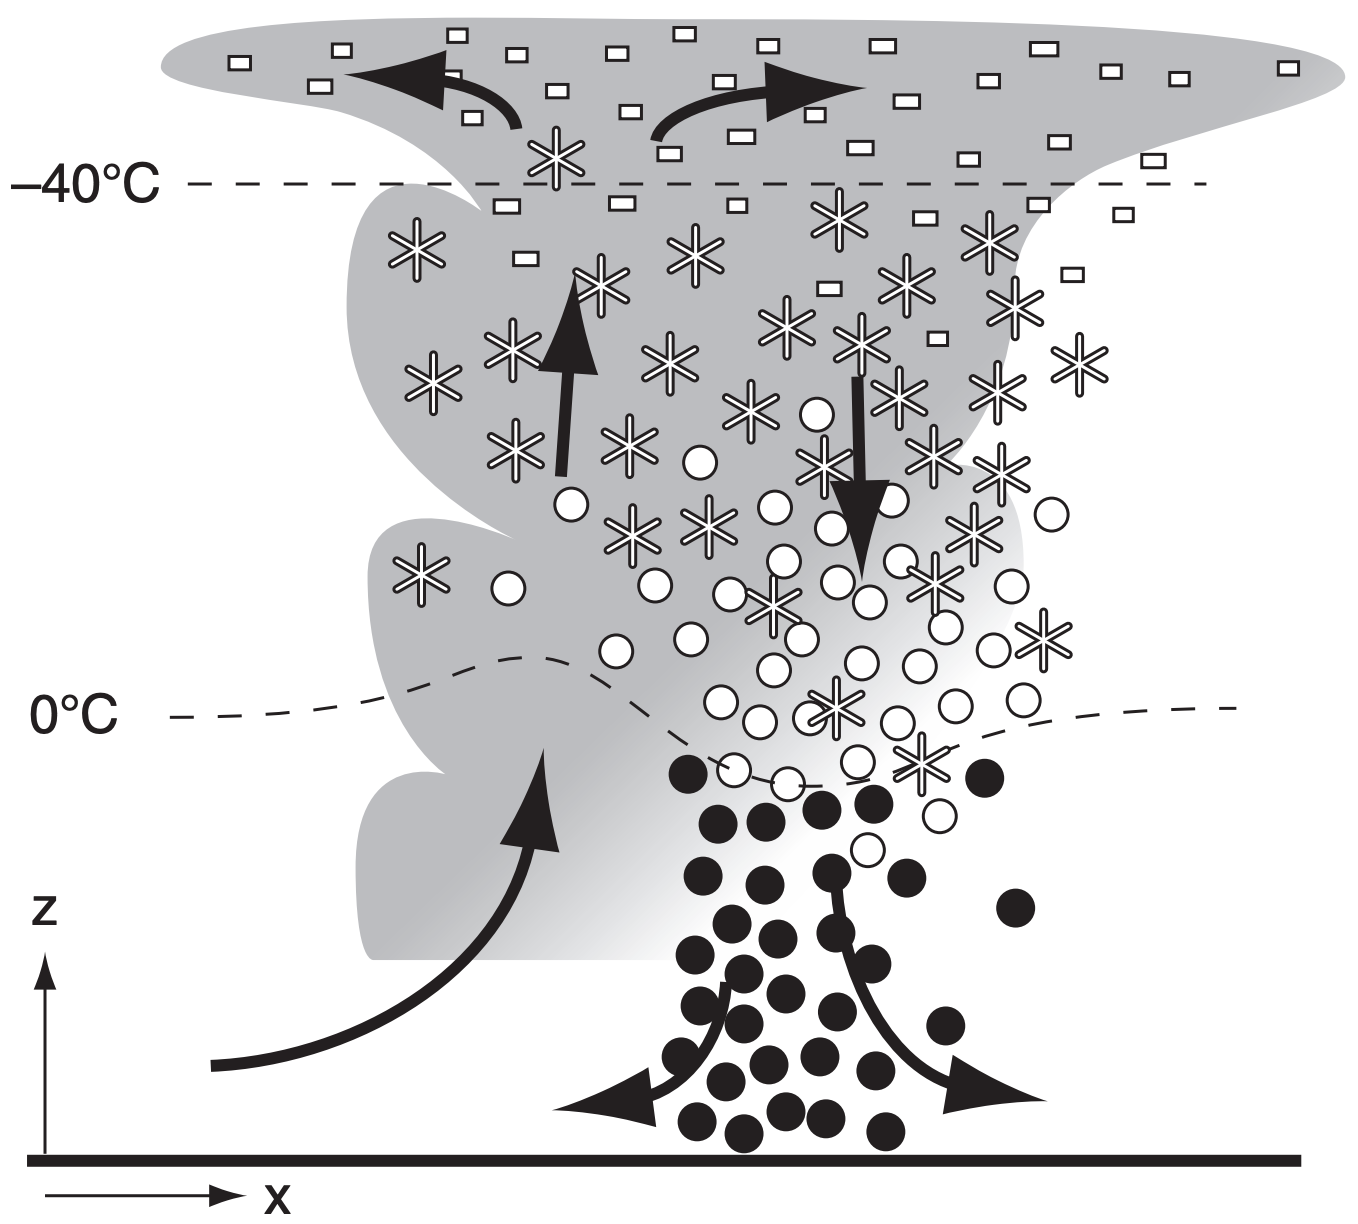
In the mature stage (Fig. 14.7), the thunderstorm has an anvil, both updrafts and downdrafts, and heavy precipitation of large-size drops. This often is the most violent time during the storm, with possible lightning, strong turbulence and winds. The precipitation brings cooler air downward as a downburst, which hits the ground and spreads out. In the absence of wind shear, two factors conspire to limit the lifetime of the storm (Fig. 14.6): (1) the storm runs out of fuel as it consumes nearby boundary-layer air; and (2) the colder outflow air chokes off access to adjacent warm boundary-layer air.
In the dissipating stage, the storm consists of downdrafts, precipitation, and a large glaciated (containing ice crystals) anvil. The storm rains itself out, and the precipitation rate diminishes. The violent aspects of the storm are also diminishing. With no updraft, it is not bringing in more fuel for the storm, and thus the storm dies.
The last frame in Fig. 14.6 shows the anvil-debris stage, which is not one of the official stages listed in severe-weather references. In this stage all that remains of the former thunderstorm is the anvil and associated virga, which contains many ice crystals that fall and evaporate slowly. No precipitation reaches the ground. The anvil remnant is not very turbulent, and drifts downwind as a thick cirrostratus or altostratus cloud as it gradually disappears.
Meanwhile, the cold outflow air spreading on the ground from the former storm might encounter fresh boundary-layer air, which it lifts along its leading edge (gust front) to possibly trigger a new thunderstorm (labeled “Cu con 2” in the last frame of Fig. 14.6). This process is called storm propagation, where the first storm (the “mother”) triggers a daughter storm. This daughter storm can go through the full thunderstorm life cycle if conditions are right, and trigger a granddaughter storm, and so forth.
Some thunderstorms contain many cells that are in different stages of their evolution. Other storms have special characteristics that allow the cell to be maintained for much longer than an hour. The types of thunderstorms are described next.
In any scientific or engineering work, determine the possible hazards to you and others before you undertake any action. If you are unable to increase the safety, then consider alternative actions that are safer. If no action is relatively safe, then cancel that project.
For example, chasing thunderstorms can be very hazardous. Weather conditions (heavy rainfall, poor visibility, strong winds, hail, lightning, and tornadoes) can be hazardous. Also, you could have poor road conditions and a limited ability to maneuver to get out of harm’s way in many places.
Your safety and the safety of other drivers and pedestrians must always be your first concern when storm chasing. Some storm-chase guidelines are provided in a series of “A SCIENTIFIC PERSPECTIVE” boxes later in this and the next chapters.
(continues in later pages)
14.1.4. Thunderstorm Types & Organization
Types of thunderstorm organization include:
- basic storms
- weakly-forced (also called airmass storms)
- multicell
- orographic
- mesoscale convective systems (MCS)
- squall line
- bow echo
- mesoscale convective complex (MCC)
- mesoscale convective vortex (MCV)
- supercells
- classic (CL)
- low-precipitation (LP)
- high-precipitation (HP)
14.1.4.1. Basic Storms
Weakly-forced (Airmass) Thunderstorms. (See Figs. 14.1, 14.2 & 14.7.) Satellite images of airmass thunderstorms show that several often exist at the same time. Sometimes these weakly-forced storms are scattered within the airmass analogous to mushrooms in a meadow. Each storm might be triggered by a thermal of rising warm air (heated at the Earth’s surface) that happens to be buoyant enough to rise out of the top of the boundary layer. Other times these storms form at airmass boundaries. Each storm often has a Byers-Braham cell evolution very similar to Fig. 14.6. It can form in the middle of a warm humid airmass in late afternoon.
The lifetime of airmass thunderstorms are about the same as that of an individual cell (30 to 60 minutes), but they can spawn daughter storms as sketched in Fig. 14.6. Each can produce a short-duration (15 minutes) rain shower of moderate to heavy intensity that covers an area of roughly 5 - 10 km radius. Weakly-forced thunderstorms that produce short-duration severe weather (heavy precipitation, strong winds, lightning, etc.) during the mature stage are called pulse storms.
Multicell Thunderstorms. Most thunderstorms in North America are multicell storms (Fig. 14.8). Within a single cloud mass that by eye looks like a thunderstorm, a weather radar can detect many (2 to 5) separate cells (Fig. 14.9) by their precipitation cores and their winds. In a multicell storm, the different cells are often in different stages of their life cycle. Given weak to moderate wind shear in the environment, the downburst and gust front from one of the mature cells (cell 2 in Fig. 14.8) can trigger new adjacent cells (namely, cells 3 and 4).
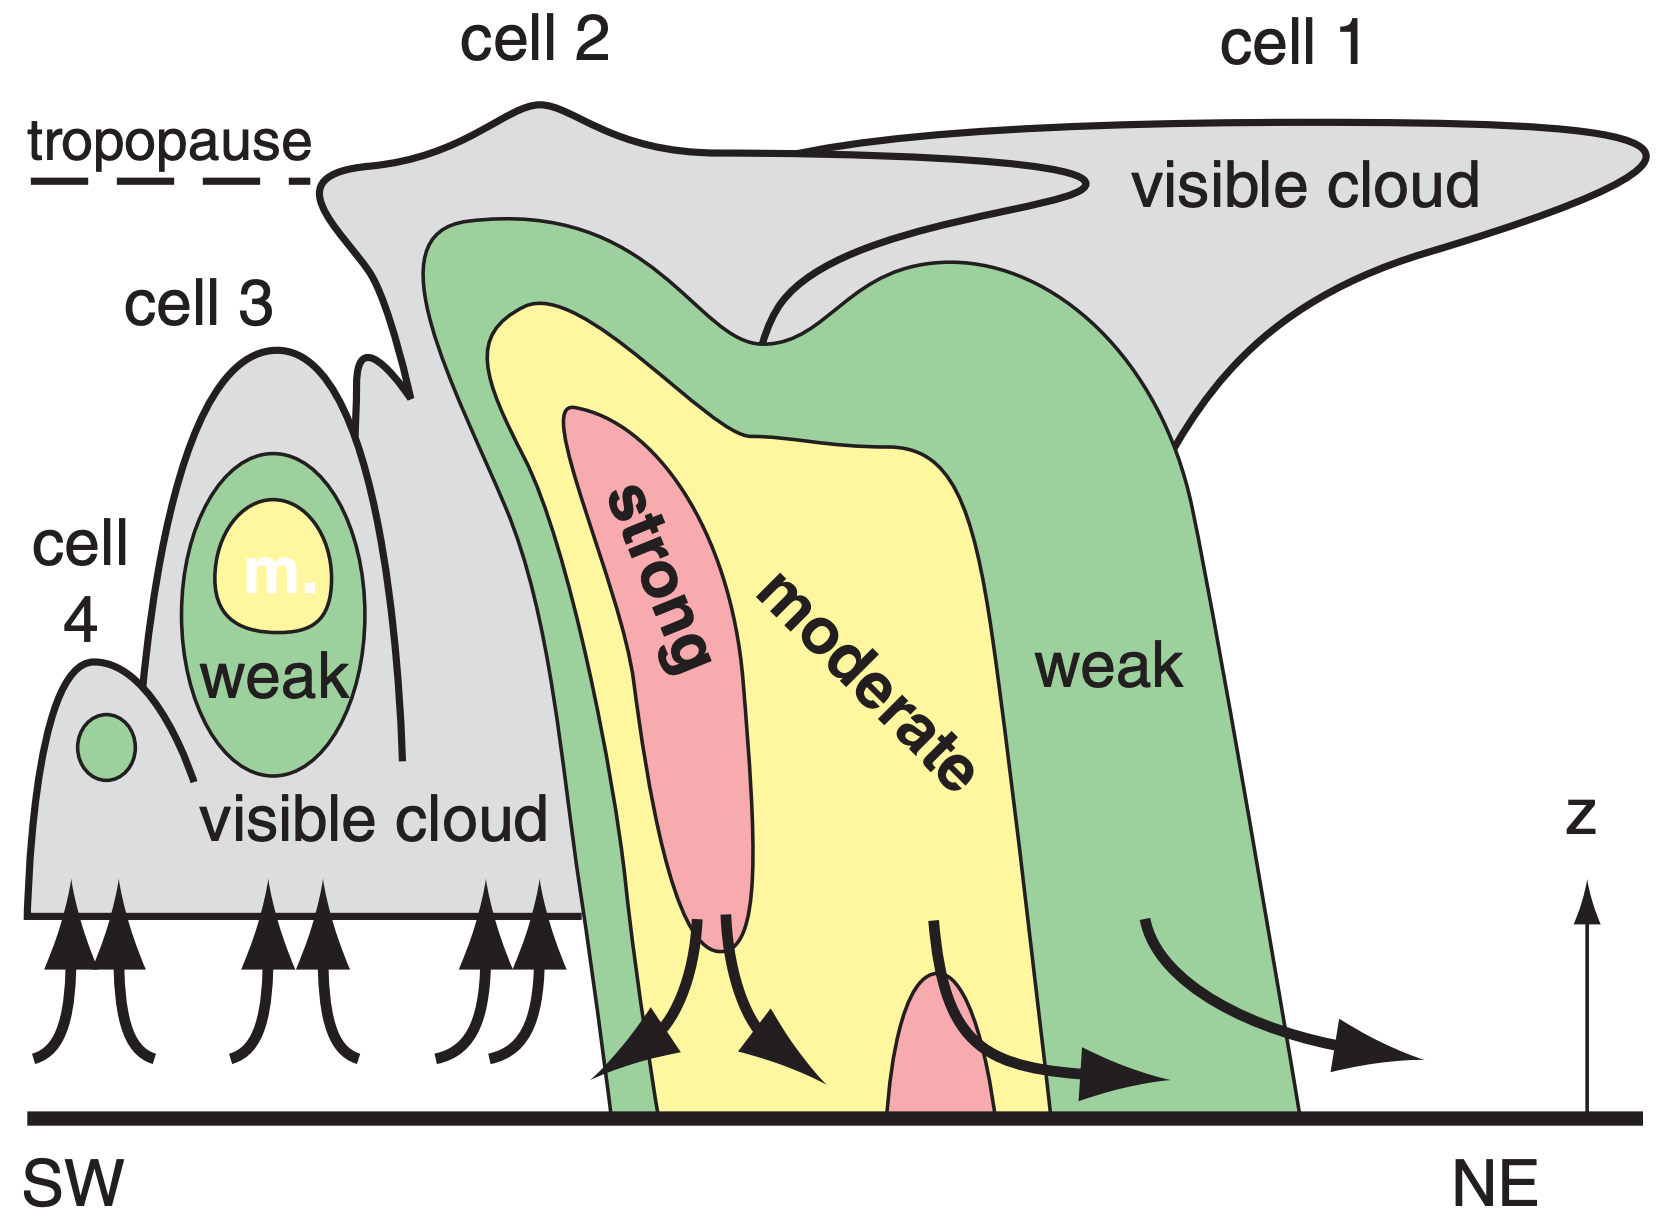
In central North America where warm humid boundary-layer winds often blow from the southeast in the pre-storm environment, new cells often form on the south flank of the storm (closest to the fuel supply), while the northeastward-moving mature cells decay as their fuel supply is diminished (Fig. 14.10). The resulting multicell thunderstorm appears to move to the right of the steering-level winds (normal or average winds in the bottom 6 km of the troposphere), even though individual cells within the storm move in the direction of the normal steering-level winds (Fig. 14.10).
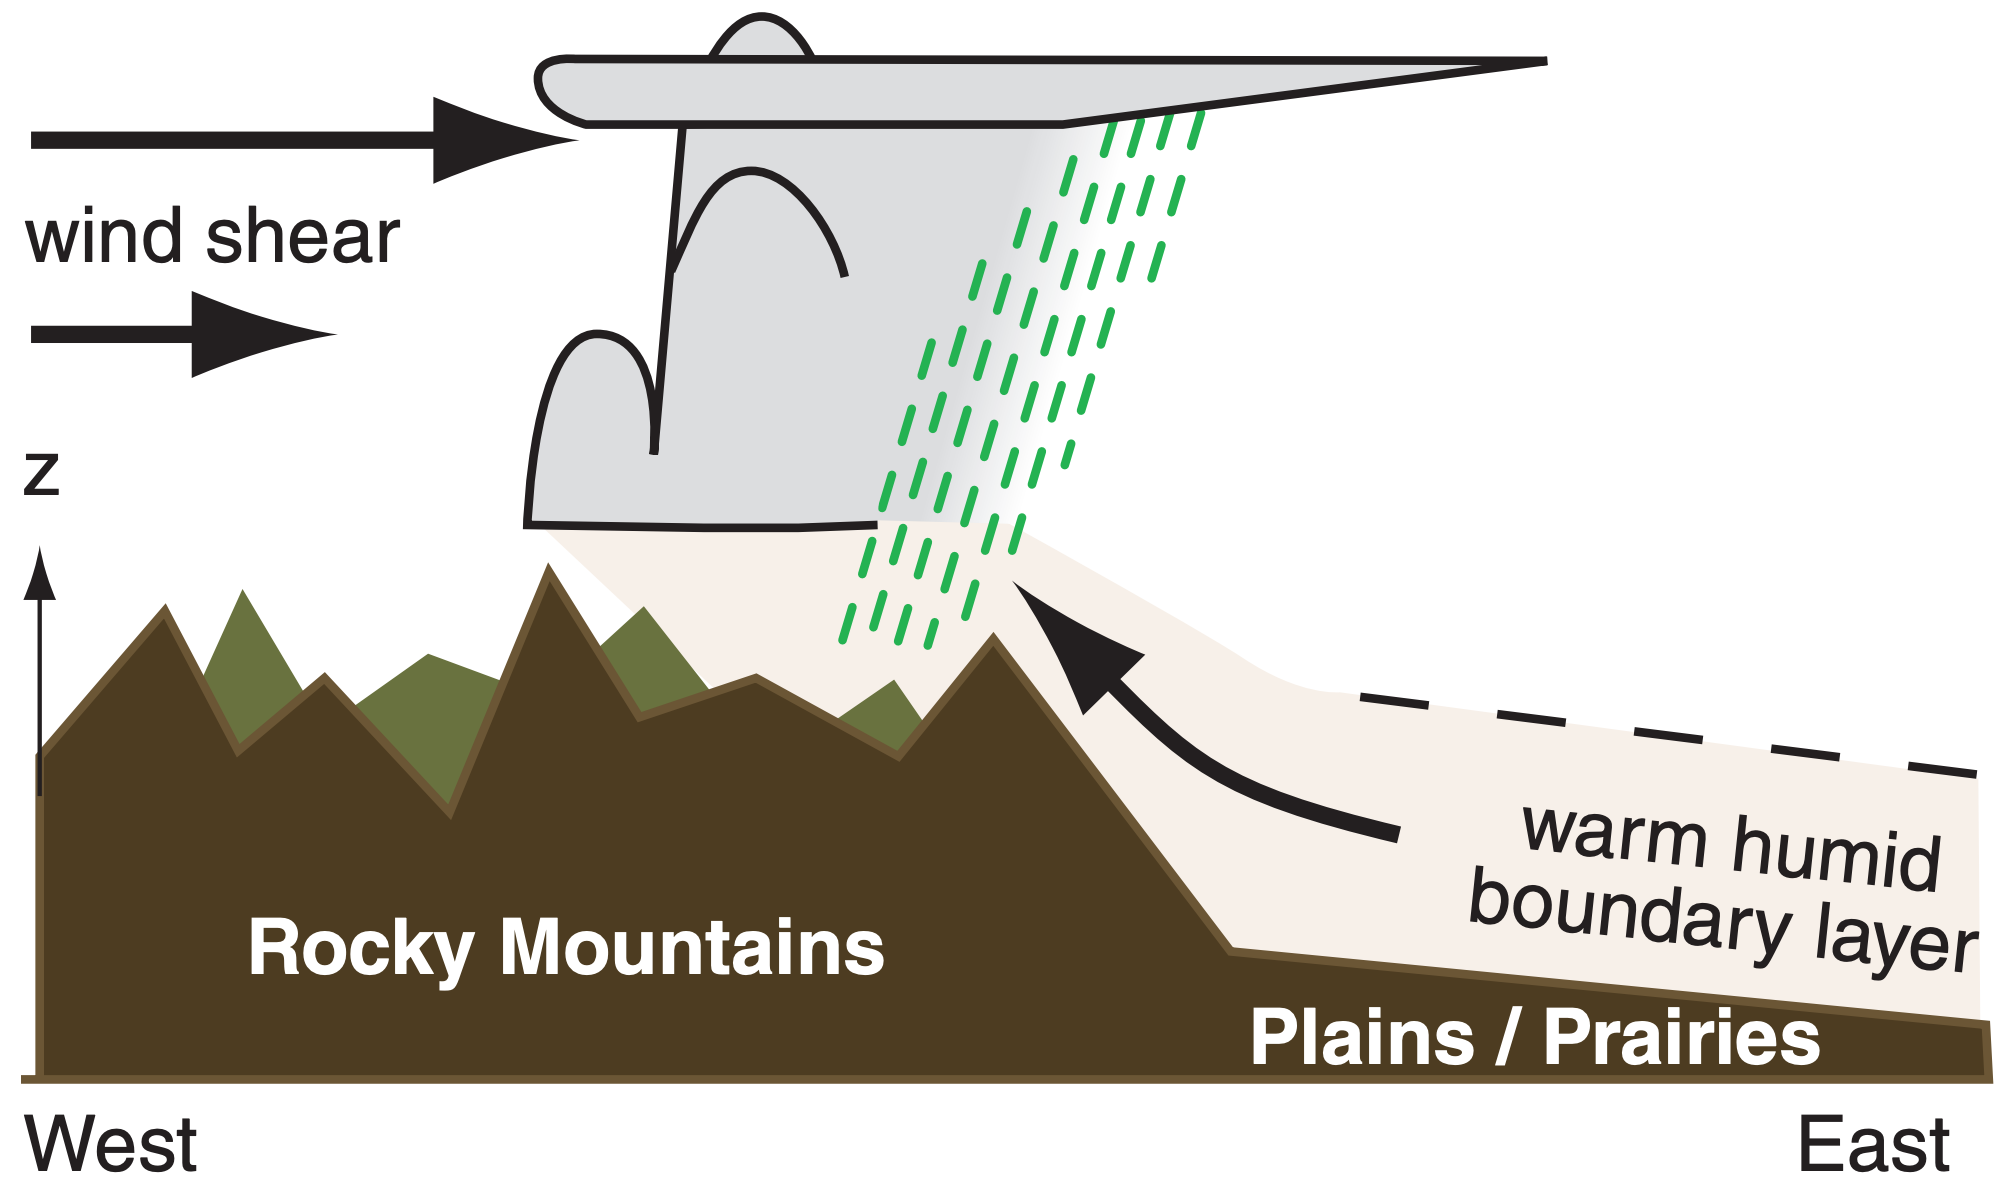
Orographic Thunderstorms. Single or multicell storms triggered by mountains or hills are called orographic thunderstorms. With the proper environmental wind shear (Fig. 14.11), low-altitude upslope winds can continuously supply humid boundary-layer air. If the upper-level winds are from the opposite direction (e.g., from the west in Fig. 14.11), then these storms can remain stationary over a mountain watershed for many hours, funneling heavy rains into canyons, and causing devastating flash floods. One example is the Big Thompson Canyon flood in the Colorado Rockies, which killed 139 people in 1976 (see the Exposition in the Thunderstorm Hazards chapter).
Sometimes if winds are right, thunderstorms are triggered over the mountains, but then are blown away to other locations. For example, orographic thunderstorms triggered over Colorado and Wyoming in late afternoon can move eastward during the evening, to hit the USA Midwest (e.g., Wisconsin) between midnight and sunrise.
14.1.4.2. Mesoscale Convective Systems
Another type of multicell-storm organization is a mesoscale convective system (MCS). This often has a narrow line of thunderstorms with heavy precipitation, followed by additional scattered thunderstorm cells (Figs. 14.12 & 14.13). The anvils from all these thunderstorms often merge into a single, large stratiform cloud shield that trails behind. This trailing stratiform region has widespread light to moderate precipitation that contributes about 1/3 of the total MCS rainfall.

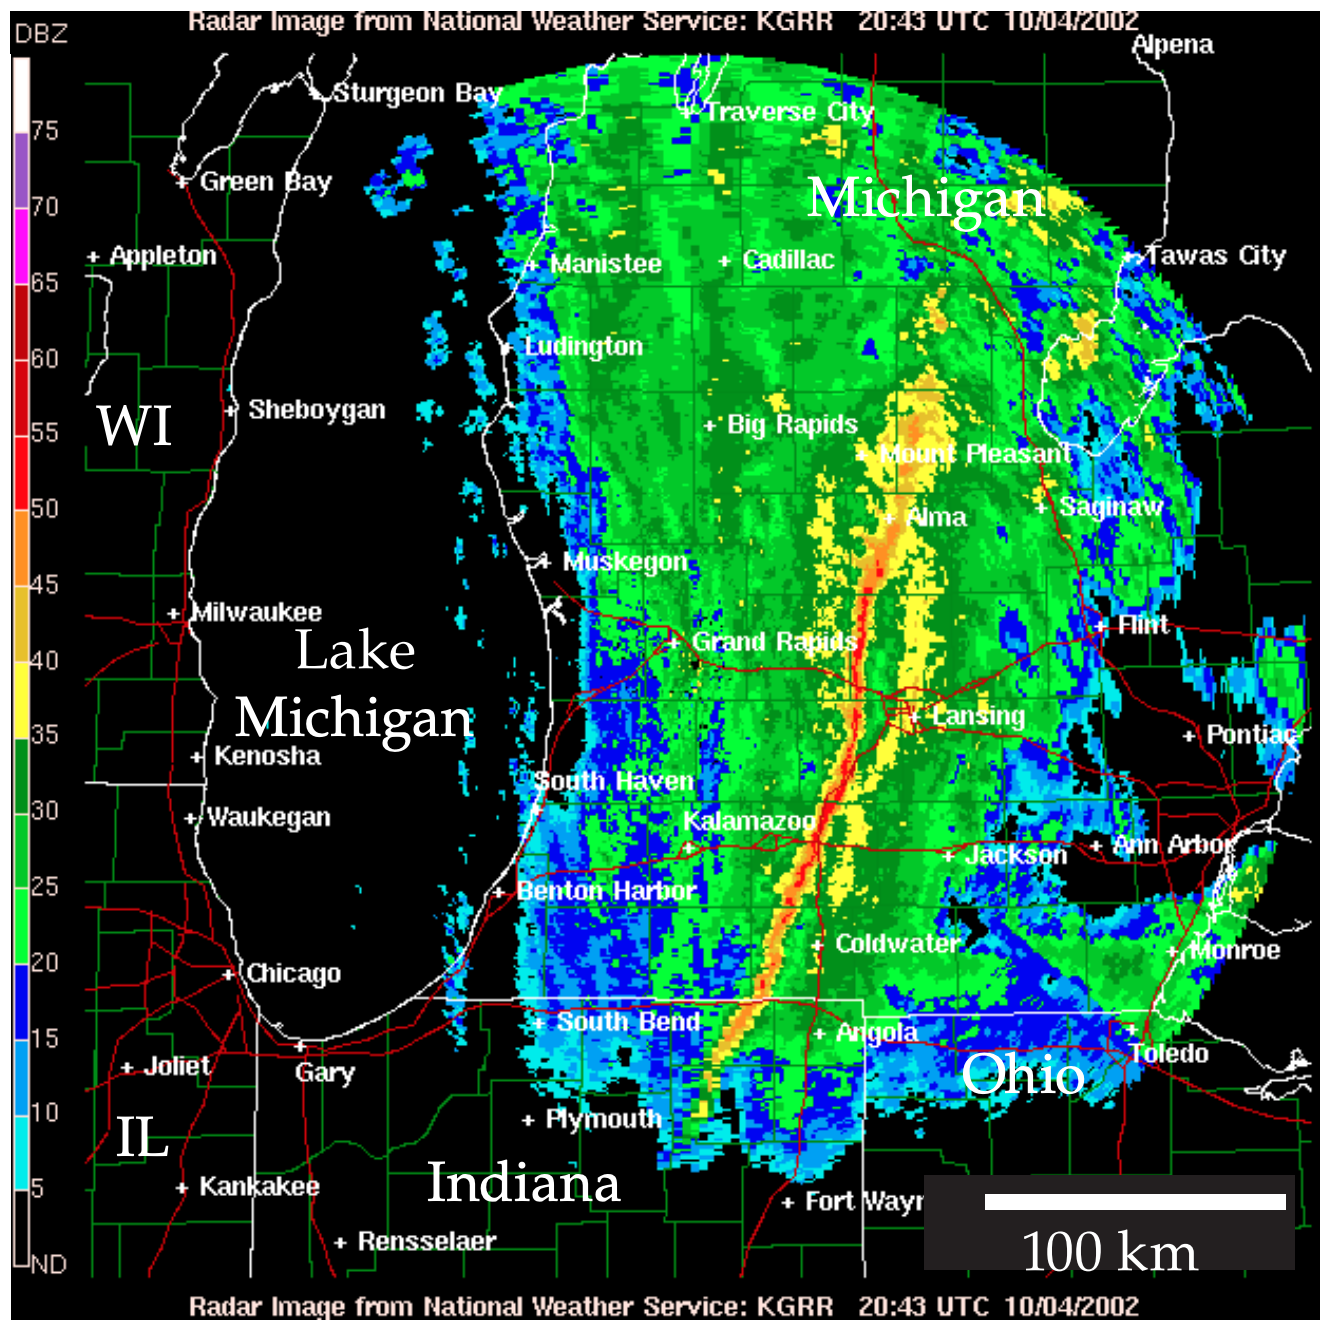
These systems can be triggered by the terrain (many form just east of the Rocky Mountains), by synoptic systems (such as cold fronts), or by the gust fronts from a smaller number of thunderstorms. To survive, they need large convective instability and large wind shear over a deep layer of the environment. MCSs are responsible for 30 to 70% of precipitation over central N. America during the warm season. Some MCSs reach their peak intensity about midnight.
Ice crystals falling from the trailing stratiform clouds melt or partially sublimate, and the resulting rain then continues to partially evaporate on the way down. This produces a broad region of chilled air (due to latent heats of melting, sublimation, and evaporation) that descends to the ground and accumulates as a cold-air pool at the surface. The extra weight of the cold air produces a mesoscale high pressure (meso-high) at the surface in this region (Fig. 14.14).
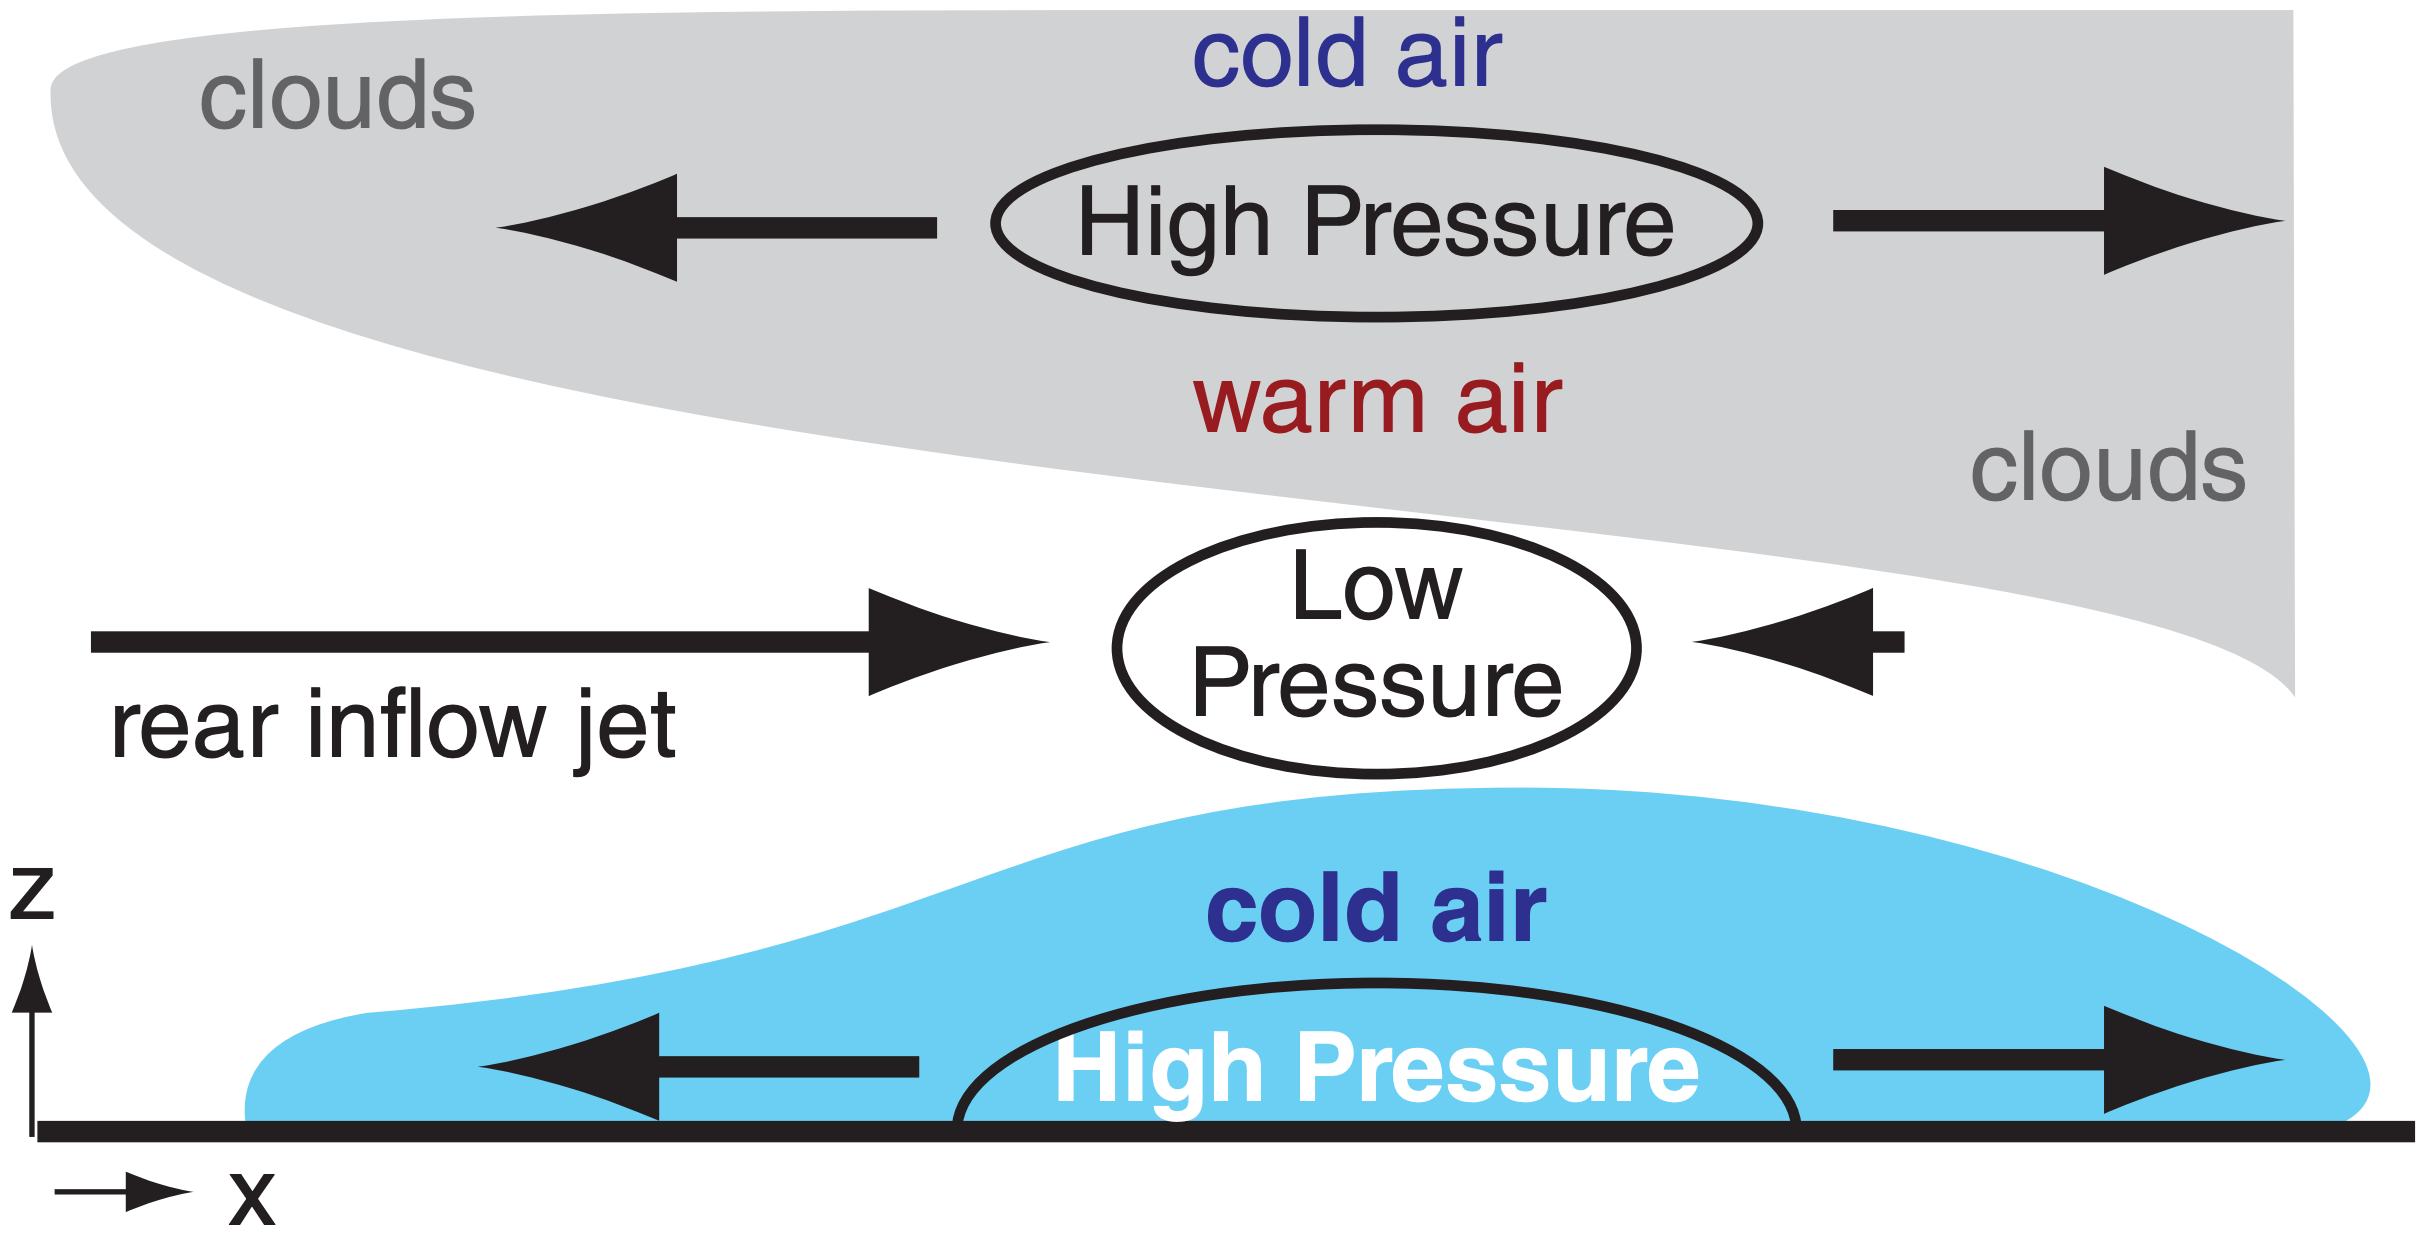
Meanwhile, warm humid boundary-layer air ahead of the MCS is drawn into the storm by the combined effects of buoyancy and wind shear. This air rises within the embedded thunderstorm cells, and releases latent heat as the water vapor condenses. The resulting heating produces a layer of relatively warm air at mid and upper levels in the MCS (Fig. 14.14). The top of the anvil is cooled by IR radiation to space.
The resulting sandwich of relatively warmer and cooler layers causes a mesoscale low-pressure region (a meso-low) at mid altitudes (Fig. 14.14) and high pressure aloft (see Sample Application). The horizontal pressure-gradient force at mid altitudes causes air to converge horizontally. The thunderstorm updraft partially blocks mid-altitude inflow from the front of the storm, so the majority of inflow is from the rear. This is called a rear inflow jet (RIJ).
As the RIJ approaches the core of the MCS, it passes through the precipitation falling from above, and is cooled. This cooling allows the RIJ to descend as it blows toward the front of the storm, causing damaging straight-line winds at the ground. Large damaging straight-line wind events are called derechos (see a later INFO Box).
Sample Application
Plot MCS thermodynamics:
(a) Assume a standard atmosphere in the environment outside the MCS, and calculate Pstd.atm. vs. z.
(b) Inside the MCS, assume the temperature TMCS differs from the Tstd.atm. by:
–12 K for 9 < z ≤ 11 km due to rad. cooling at anvil top;
+8 K for 4 ≤ z ≤ 9 km due to latent heating in cloud;
–12 K for 0 ≤ z ≤ 2 km in the cold pool of air;
0 K elsewhere. Use Psfc = 101.8 kPa in the MCS.
Plot ∆T = TMCS – Tstd.atm. vs. z .
(c) Calculate PMCS vs. z in the MCS.
(d)Plot pressure difference ∆P=PMCS –Pstd.atm. vs. z
Find the Answer
Given: T and P data listed above within MCS, and std. atm. in the environment outside the MCS.
Find & plot: ∆T (K) vs. z (km); and ∆P (kPa) vs. z (km)
Method:
(a) In a spreadsheet, use standard-atmosphere eq. (1.16) to find Tstd.atm. vs. z, assuming H = z.
For this standard atmosphere outside the MCS, use hypsometric eq. (1.26b) to find P vs. z by iterating upward in steps of ∆z = 250 m from P1 = Psfc = 101.325 kPa at z1 = 0. Assume Tv avg = Tavg = 0.5 ·(T1 + T2) in eq. (1.26b) for simplicity (since no humidity information was given in the problem). Thus (with a = 29.3 m·K–1):
\(\ \begin{align} P_{2}=P_{1} \cdot \exp \left[\left(z_{1}-z_{2}\right) /\left(a \cdot 0.5 \cdot\left(T_{1}+T_{2}\right)\right]\right.\tag{1.26b}\end{align}\)
(b) Plot ∆T vs. z, from data given in the problem.
(c) Find TMCS(z) = Tstd.atm.(z) + ∆T(z). Do the similar hypsometric P calculations as (a), but inside the MCS.
(d) Find ∆P = PMCS – Pstd.atm. from (c) and (a), and plot.
Spreadsheet segments:
| (a) | (b) | (c) | (d) | |||
| Std. Atmos | MCS | ∆P | ||||
| z (m) | T (K) | P (kPa) | ∆T (K) | T (K) | P (kPa) | (kPa) |
| 0 | 288.2 | 101.3 | –12 | 276.2 | 101.8 | 0.5 |
| 250 | 286.5 | 98.3 | –12 | 274.5 | 98.7 | 0.4 |
| 500 | 284.9 | 95.4 | –12 | 272.9 | 95.7 | 0.2 |
| 750 | 283.3 | 92.6 | –12 | 271.3 | 92.7 | 0.1 |
| . . . | . . . | . . . | . . . | . . . | . . . | . . . |
| 2000 | 275.2 | 79.5 | –12 | 263.2 | 79.0 | –0.5 |
| 2250 | 273.5 | 77.1 | 0 | 273.5 | 76.6 | –0.5 |
| . . . | . . . | . . . | . . . | . . . | . . . | . . . |
| 3750 | 263.8 | 63.7 | 0 | 263.8 | 63.3 | –0.4 |
| 4000 | 262.2 | 61.7 | 8 | 270.2 | 61.3 | –0.4 |
| . . . | . . . | . . . | . . . | . . . | . . . | . . . |
| 9000 | 229.7 | 30.8 | 8 | 237.7 | 31.3 | 0.5 |
| 9250 | 228.0 | 29.6 | –12 | 214.0 | 30.1 | 0.5 |
| . . . | . . . | . . . | . . . | . . . | . . . | . . . |
| 11000 | 216.7 | 22.7 | –12 | 204.7 | 22.7 | 0.0 |
| 11250 | 215.0 | 21.8 | 0 | 215.0 | 21.8 | 0.0 |
(Note: The actual spreadsheet carried more significant digits.)
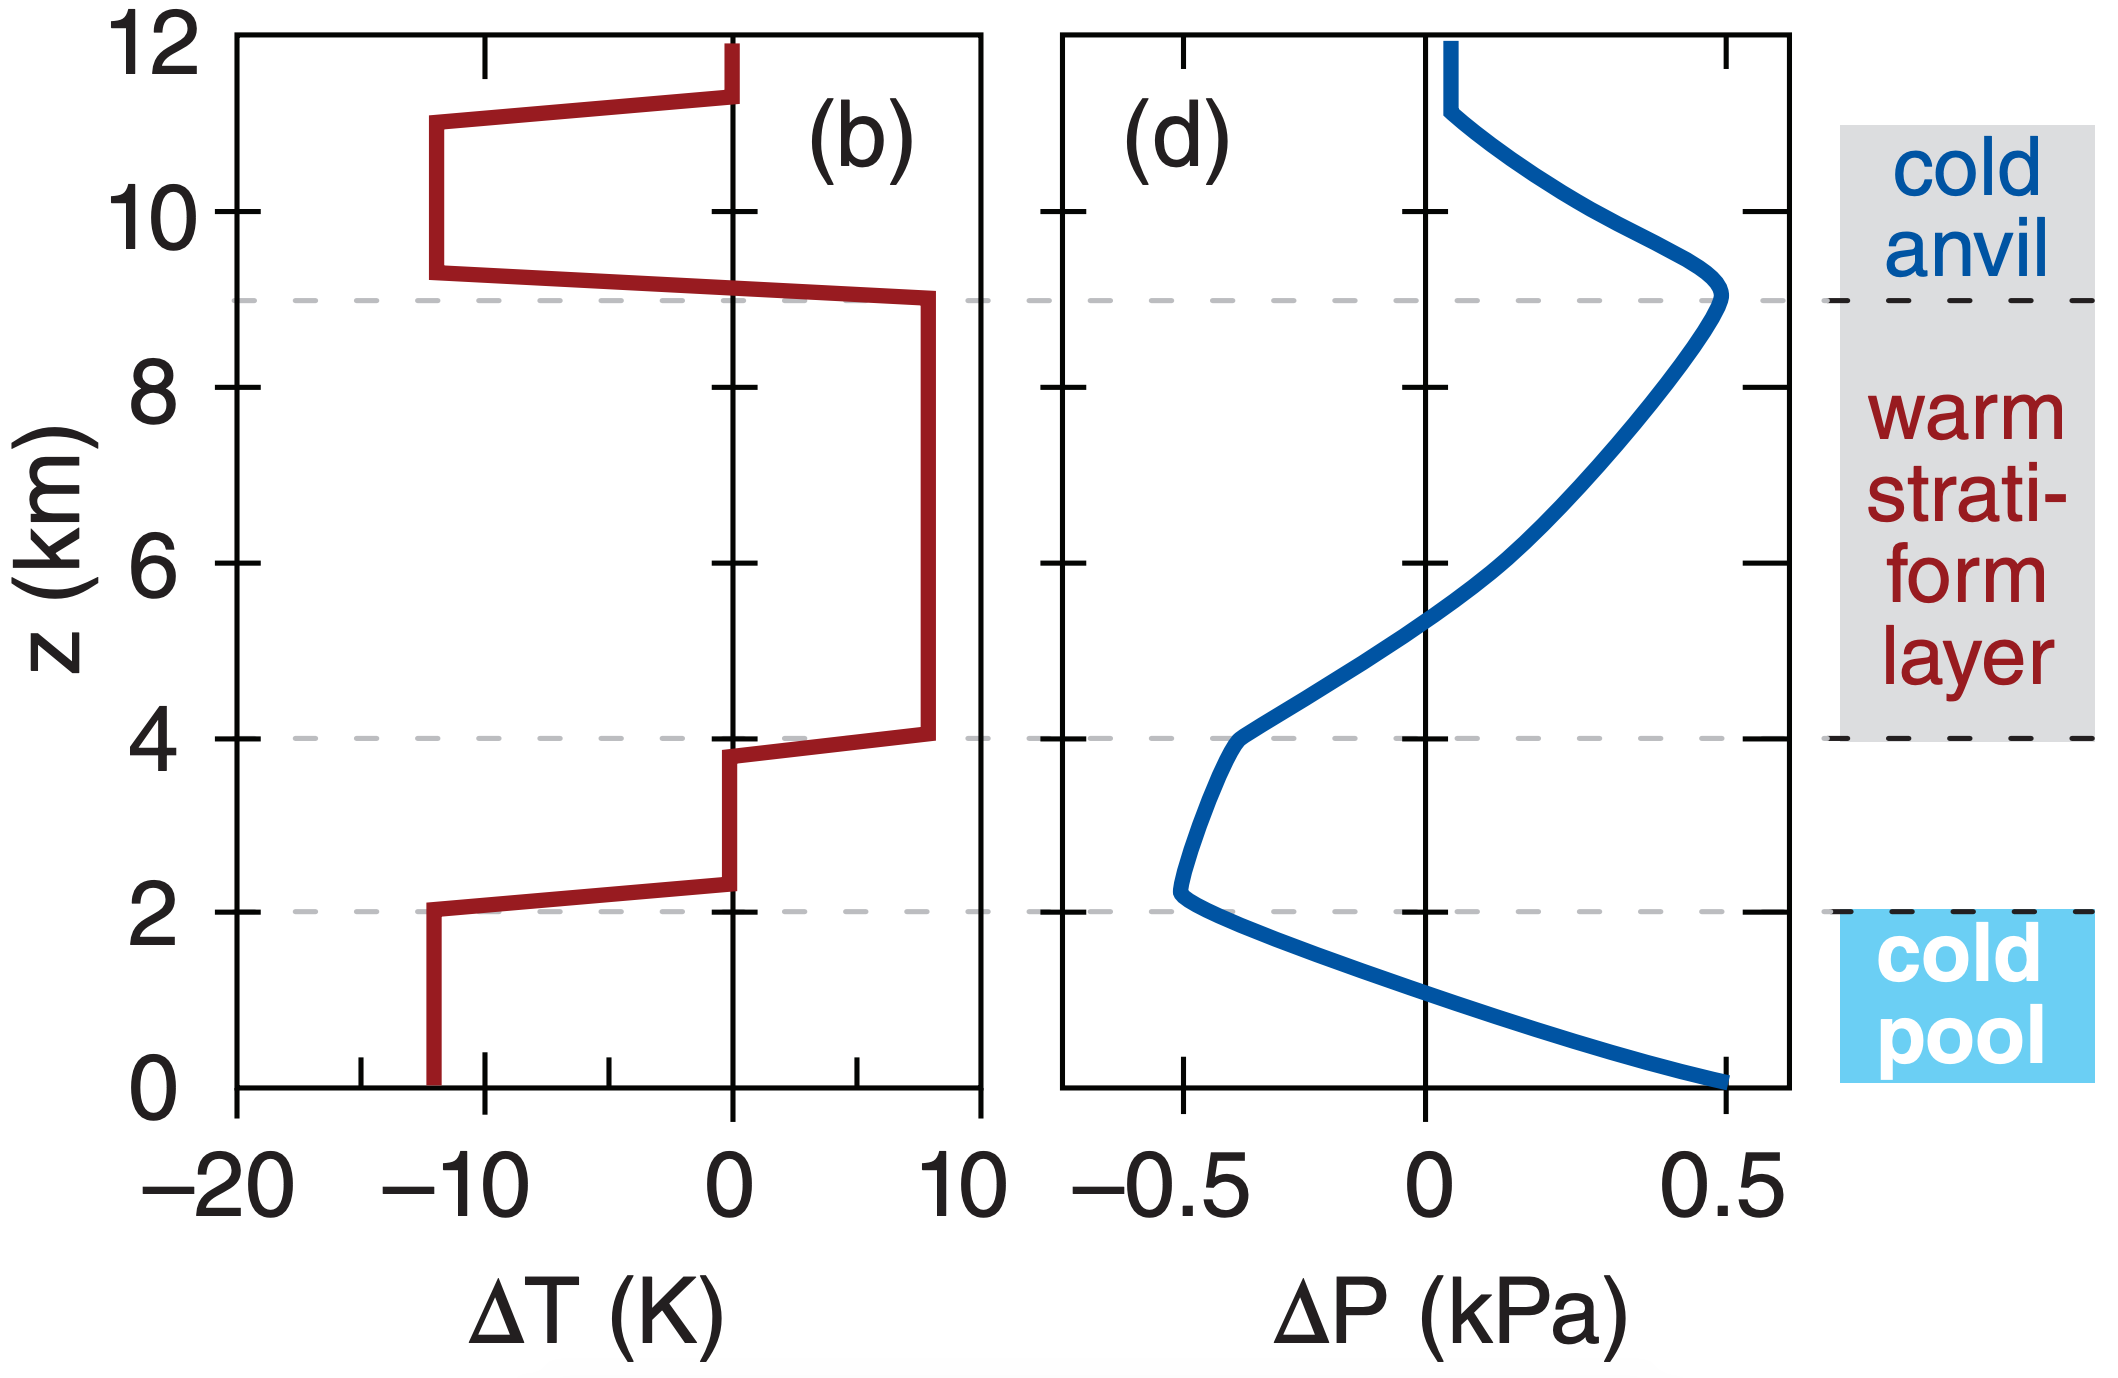
Check: Units OK. Standard atmosphere P agrees with Table 1-5. Graphs are reasonable.
Exposition: High pressure at the surface causes the cold-pool air to spread out, as sketched in Figs. 14.12 & 14.14. The lowest pressure is above the cold pool and below the warm stratiform clouds. This low pressure (relative to the environment) sucks in air as a rear inflow jet. The deep layer of warm stratiform clouds eventually causes high pressure aloft, causing the cloudy air to spread out in the anvil. The cold anvil top then brings the pressure back to ambient, so that above the anvil there are no pressure differences.
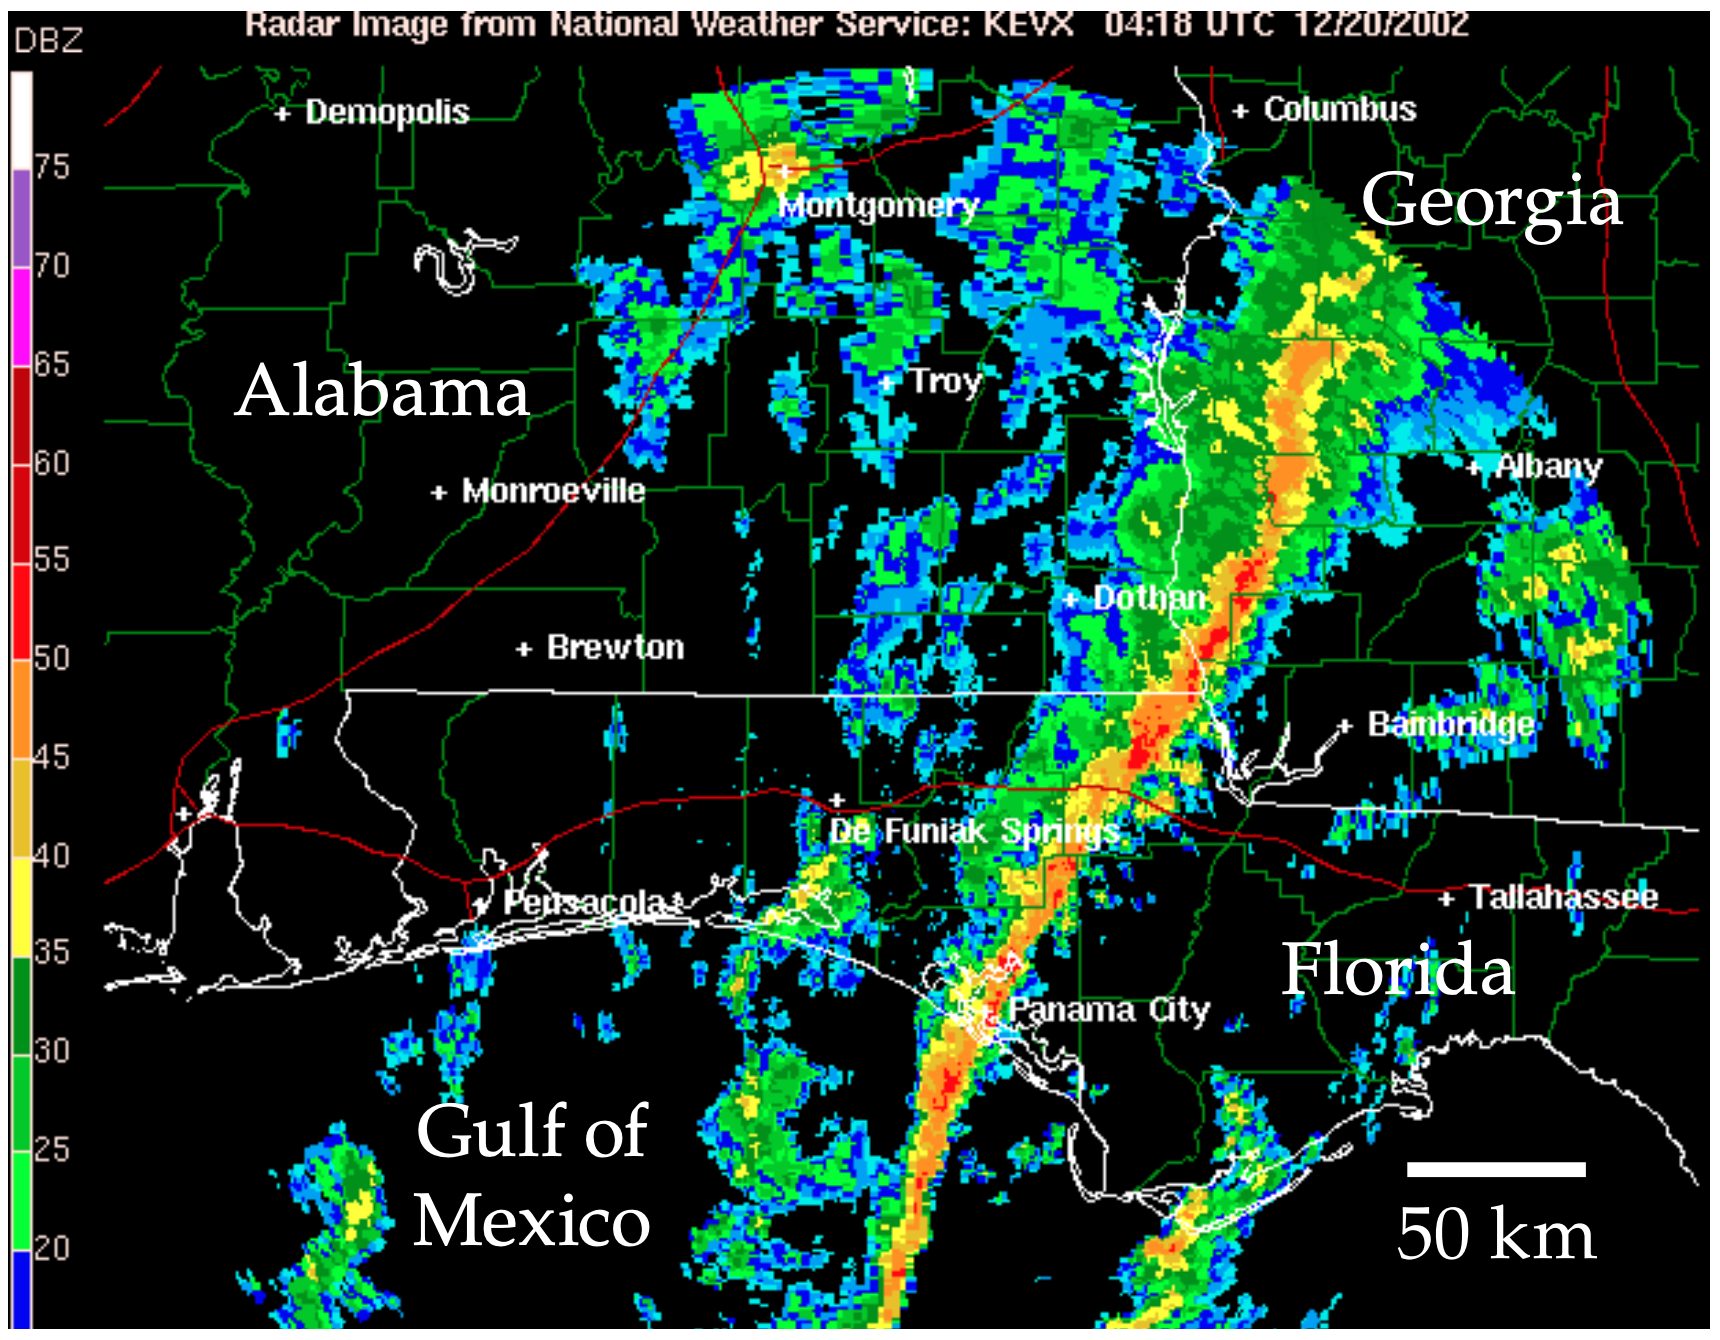
Squall Line. One type of MCS is a squall line, where a linear triggering mechanism such as a cold front, dry line or gust front causes many neighboring thunderstorms to merge into a long narrow line (Figs. 8.26 & 14.15). Squall lines can be many hundreds (even a thousand) kilometers long, but are usually only 15 to 400 km wide. They can persist for several hours to several days if continuously triggered by the advancing front. Heavy thunderstorm precipitation falls immediately behind the cold front at the surface, and sometimes has weaker stratiform precipitation behind it. Squall line storms can also have prodigious lightning, hail, damaging winds and tornadoes (although the tornadoes tend to be weaker than supercell-thunderstorm tornadoes).
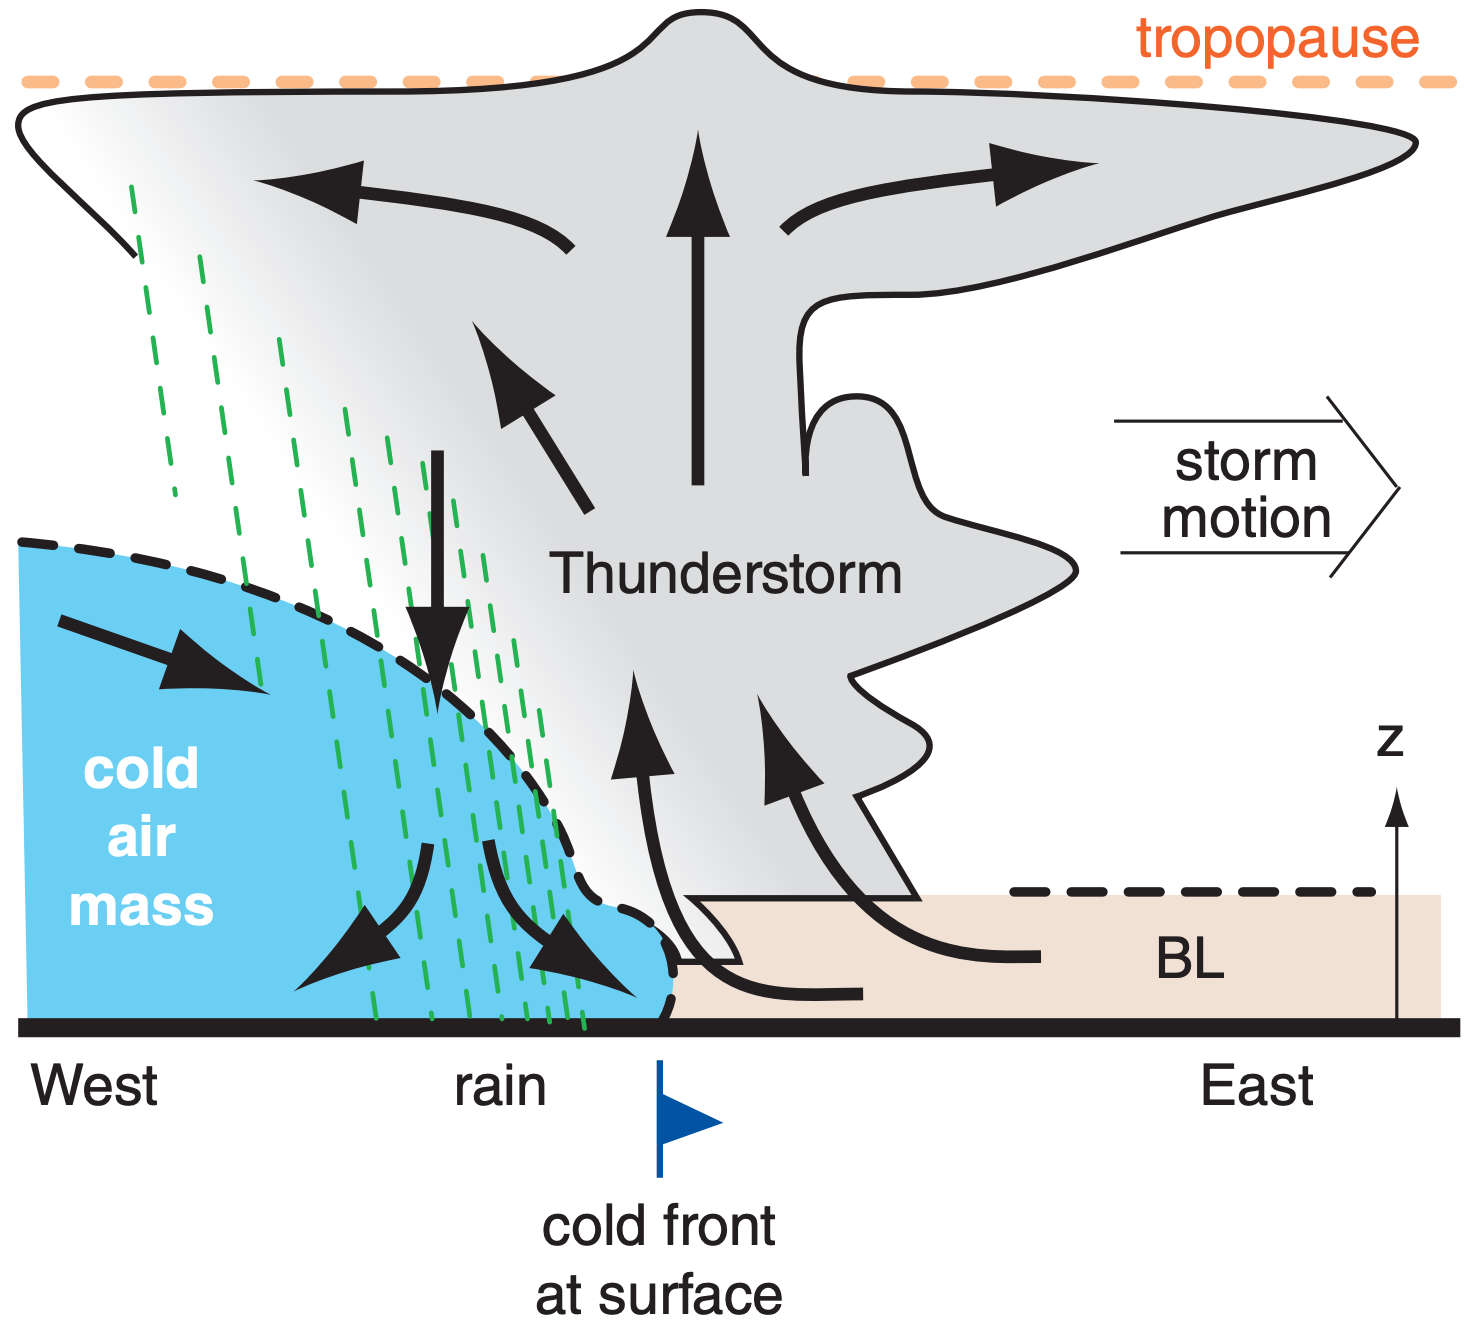
Fig. 14.16 illustrates flow characteristics in a vertical cross section perpendicular to the squall-line axis. Environmental wind shear along the advancing cold front allows the thunderstorms to persist in the mature stage for the lifetime of the squall line. Cold, dry air descends from the west in the cold air mass from behind the squall line. This cold descent is enhanced by cool downburst air in the precipitation region. Both effects help advance the leading edge of the cold front at the ground. Warm, humid boundary-layer air blowing from the east ahead of the front is lifted by the undercutting denser cold advancing air, thereby continuously feeding the main updraft that moves with the advancing front.
A well-defined arc or shelf cloud often exists along the leading edge of the cold front, associated with violent straight-line winds. If the gust front from the downburst advances eastward faster than the cold front, then a second line of thunderstorms may be triggered along the gust front in advance of the cold front or the squall line might separate from the front.
Bow Echo. For MCSs with strong buoyancy in the updraft air and moderate to strong wind shear in the bottom 2 to 3 km of the environment, the cold pool becomes deeper and colder, and rear-inflowjet (RIJ) wind speeds can become stronger. The RIJ pushes forward the center portion of the squall line, causing it to horizontally bend into a shape called a bow echo (Fig. 14.17). Bow-echo lines are 20 to 200 km long (i.e., smaller than most other MCSs) and are often more severe than normal MCSs.
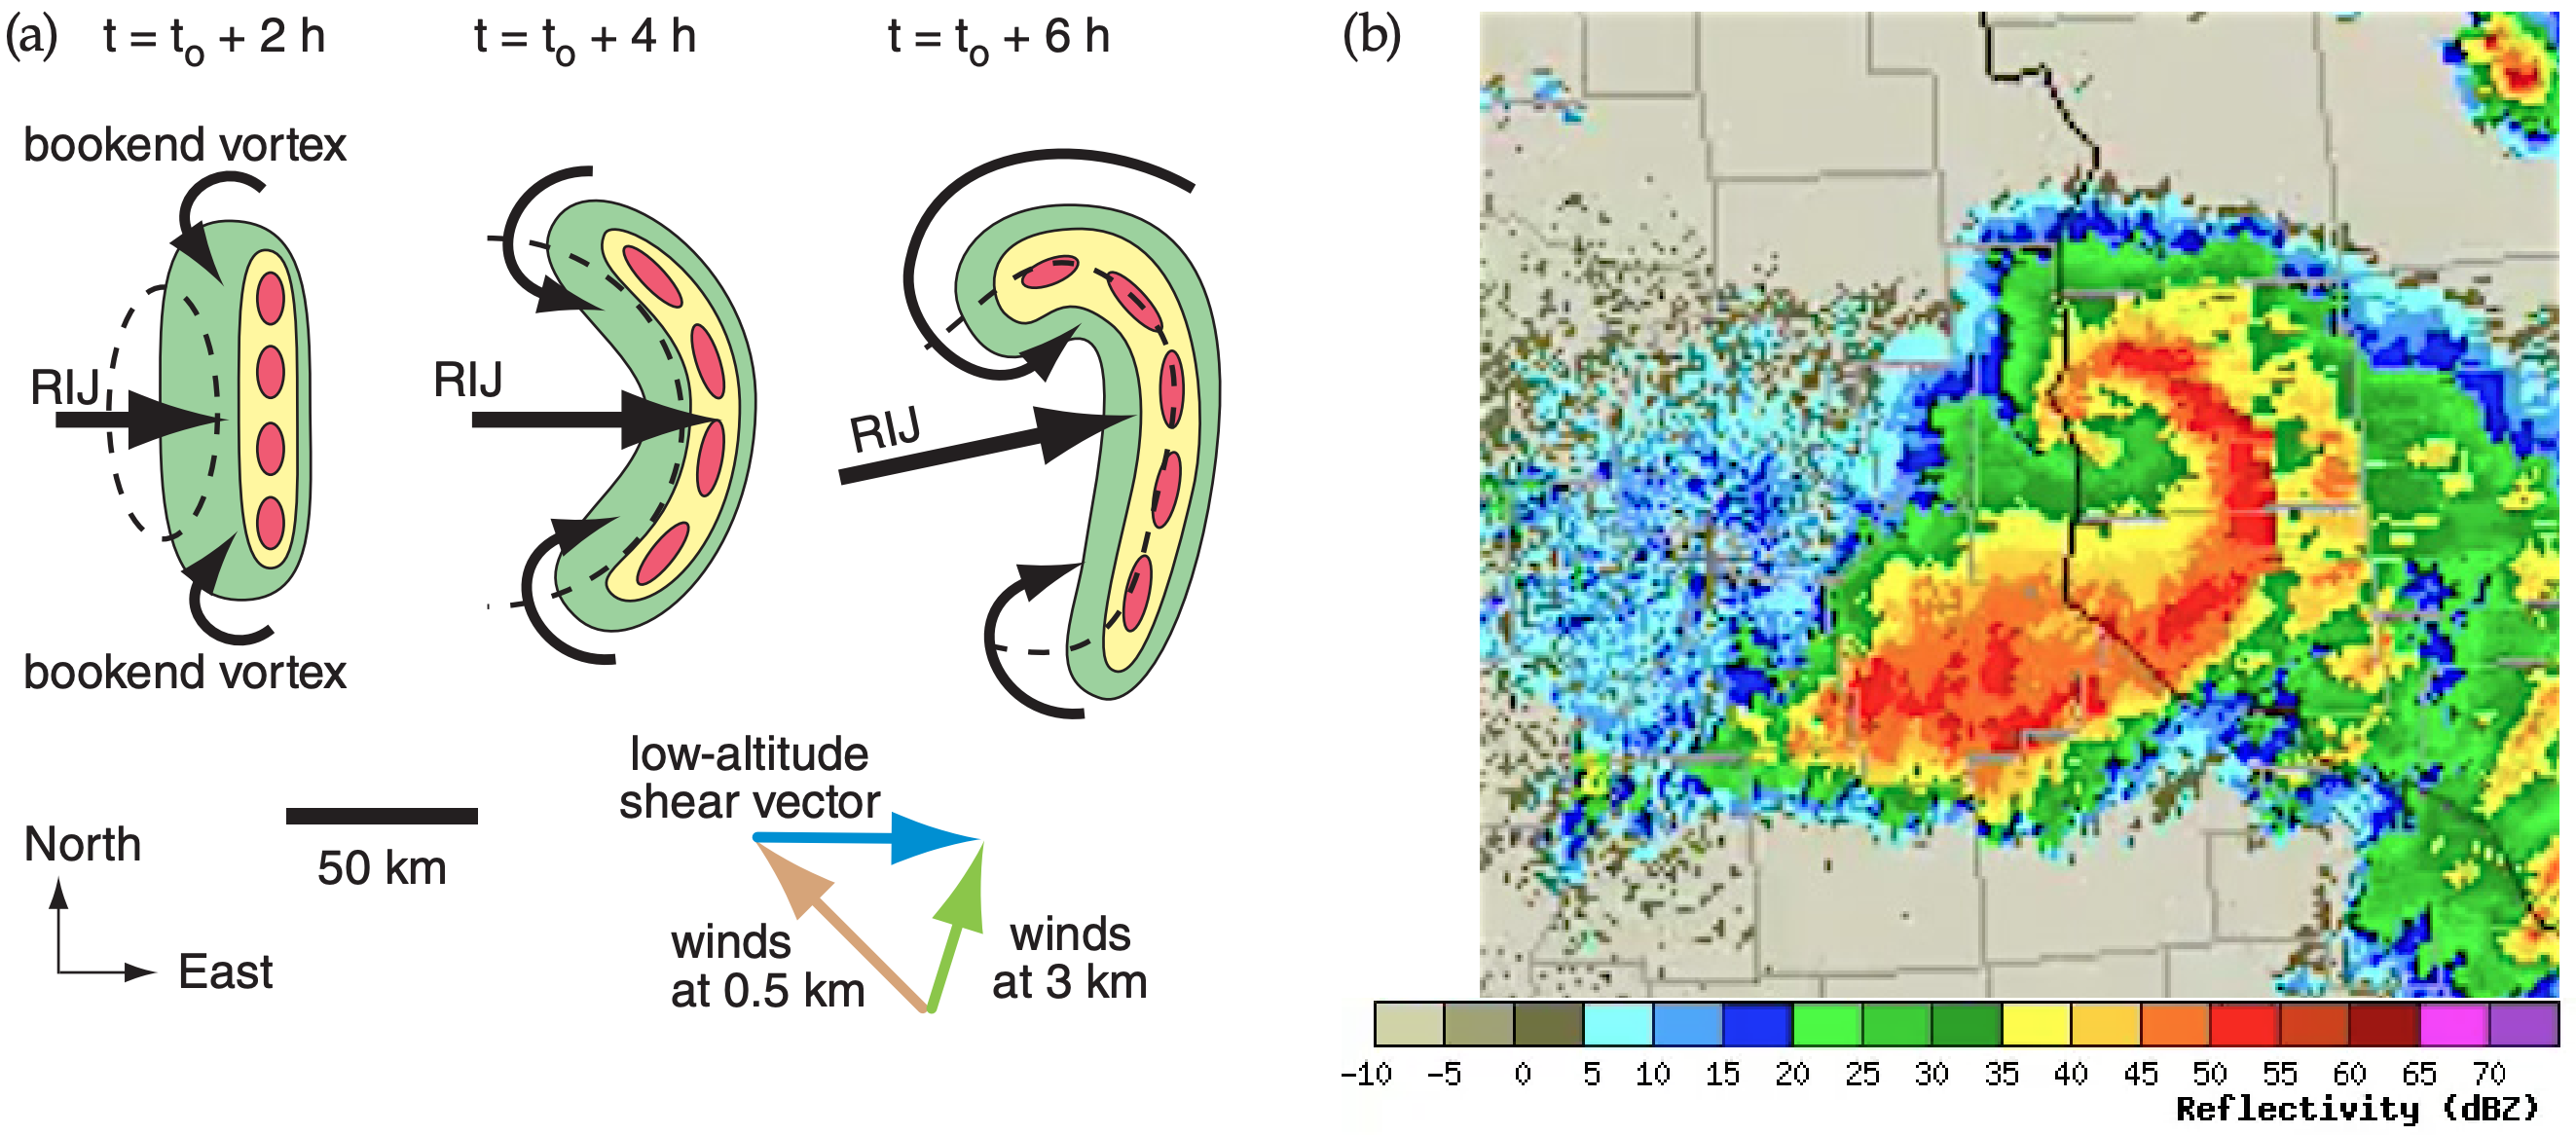
Vorticity caused by wind shear along the advancing cold pool causes counter-rotating vortices at each end of the bow-echo line. These are called line-end vortices or bookend vortices (Fig 14.17), which rotate like an eggbeater to accelerate the RIJ and focus it into a narrower stream. For bow echoes lasting longer than about 3 h, Coriolis force enhances the northern cyclonic vortex in the Northern Hemisphere and diminishes the southern anticyclonic vortex, causing the bow echo to become asymmetric later in its evolution.
Strong straight-line winds near the ground from a bow echo can damage buildings and trees similar to an EF2 tornado (see the “Tornado” section in the next chapter for a description of tornado damage scales). If a sequence of bow echoes causes wind damage along a 400 km path or greater and lasts about 3 hours or more, with wind speeds ≥ 26 m s–1 and gusts ≥ 33 m s–1, then the damaging wind event is called a derecho (see INFO Box 3 pages later).
Mesoscale Convective Complex (MCC). If the size of the MCS cloud shield of merged anvils is large (diameter ≥ 350 km), has an overall elliptical or circular shape, and lasts 6 to 12 h, then it is called a mesoscale convective complex (MCC). An additional requirement to be classified as an MCC is that the top of the cloud shield, as seen in IR-satellite images, must have a cold brightness temperature of ≤ –33°C. Within this cold cloud shield must be a smaller region (diameter ≥ 250 km) of higher, colder cloud top with brightness temperature ≤ –53°C.
MCCs can produce heavy rain over large areas, with the most intense rain usually happening first. MCCs are most often observed at night over a statically stable boundary layer, which means that the fuel for these storms often comes from the warm humid air stored in the residual boundary layer from the day before. They can be triggered by weak warm-frontal zones and weak mid-tropospheric short waves, and are often associated with low-level jets of wind.
Sample Application
Estimate the speed of the rear inflow jet (RIJ) wind that is drawn into the MCS mid-tropospheric low-pressure region, for the previous Sample Application. The MCS has horizontal radius of 175 km, and is located in Oklahoma (latitude 35°N) .
Find the Answer
Given: ∆P = –0.5 kPa at height z = 2 km, from previous Sample Application.
R = 175 km = radius of meso-low in mid-trop- osphere, latitude ϕ = 35°N
Find: MRIJ = ? m s–1
Assume the RIJ is geostrophic (MRIJ = Ug). To use eq.
(10.26a) for the geostrophic wind, we need: ∆P/∆y , ρ and fc .
Consider the region just south of the low center.
∆P/∆y = ( –0.5 kPa)/(175 km) = –0.00286 kPa·km–1
Assuming std. atmosphere. Use Table 1-5 at 2 km
ρ = 1.0 kg·m–3 .
Use eq. 10.16 to find the Coriolis parameter:
fc = (1.458x10⁻⁴ s–1)·sin(35°) = 0.836x10⁻⁴ s–1.
Combine these data in eq. (10.26a):
Ug= –[(1.0 kg·m–3)·(0.836x10–4 s–1)]–1·(–0.00286 Pa·m–1) = 34.2 m s–1
Thus,
MRIJ = Ug = 34.2 m s–1
Check: Units OK. Magnitude reasonable. Sign OK.
Exposition: This implies a RIJ from the west, in the region just south of the mid-tropospheric meso-low center. If this RIJ descends down to the surface due to the influence of precipitation cooling, it could cause damaging straight-line wind gusts that exceed the threshold to be classified as a derecho.
One caution: the geostrophic wind assumes steady state. In a rapidly intensifying MCS, steady-state might not be the best assumption. If the wind were accelerating, then it could have an ageostrophic component pointing towards the low center.
Mesoscale Convective Vortex (MCV). Between midnight and sunrise, as the static stability of the boundary layer increases, the thunderstorms within MCSs often weaken and die. Thunderstorms are more difficult to trigger then, because cold nocturnal boundary-layer air resists rising. Also, above the nocturnal layer is a thin residual layer that has only a small capacity to hold the fuel supply of warm humid air from the previous day’s mixed layer. As the MCS rains itself out, all that is left by the next morning are mid-level stratiform clouds.
However, the mid-tropospheric mesoscale lowpressure region (Fig. 14.14) in the MCS has existed for about half a day by this time, and has developed cyclonic rotation around it due to Coriolis force. This mesoscale rotation is often visible (by satellite) in the mid-level (former MCS) stratiform clouds, and is called a mesoscale convective vortex (MCV). The stable boundary layer beneath the MCV reduces surface drag, allowing the rotation to persist for many more hours around the weak low.
Although these weakly rotating systems are not violent and often don’t have a circulation at the surface, they can be tracked by satellite during the morning and early afternoon as they drift eastward. They are significant because they can enhance new thunderstorm formation via weak convergence and upward motion. Thus, by evening the dying MCV can change into a new MCS.
14.1.4.3. Supercell Thunderstorms
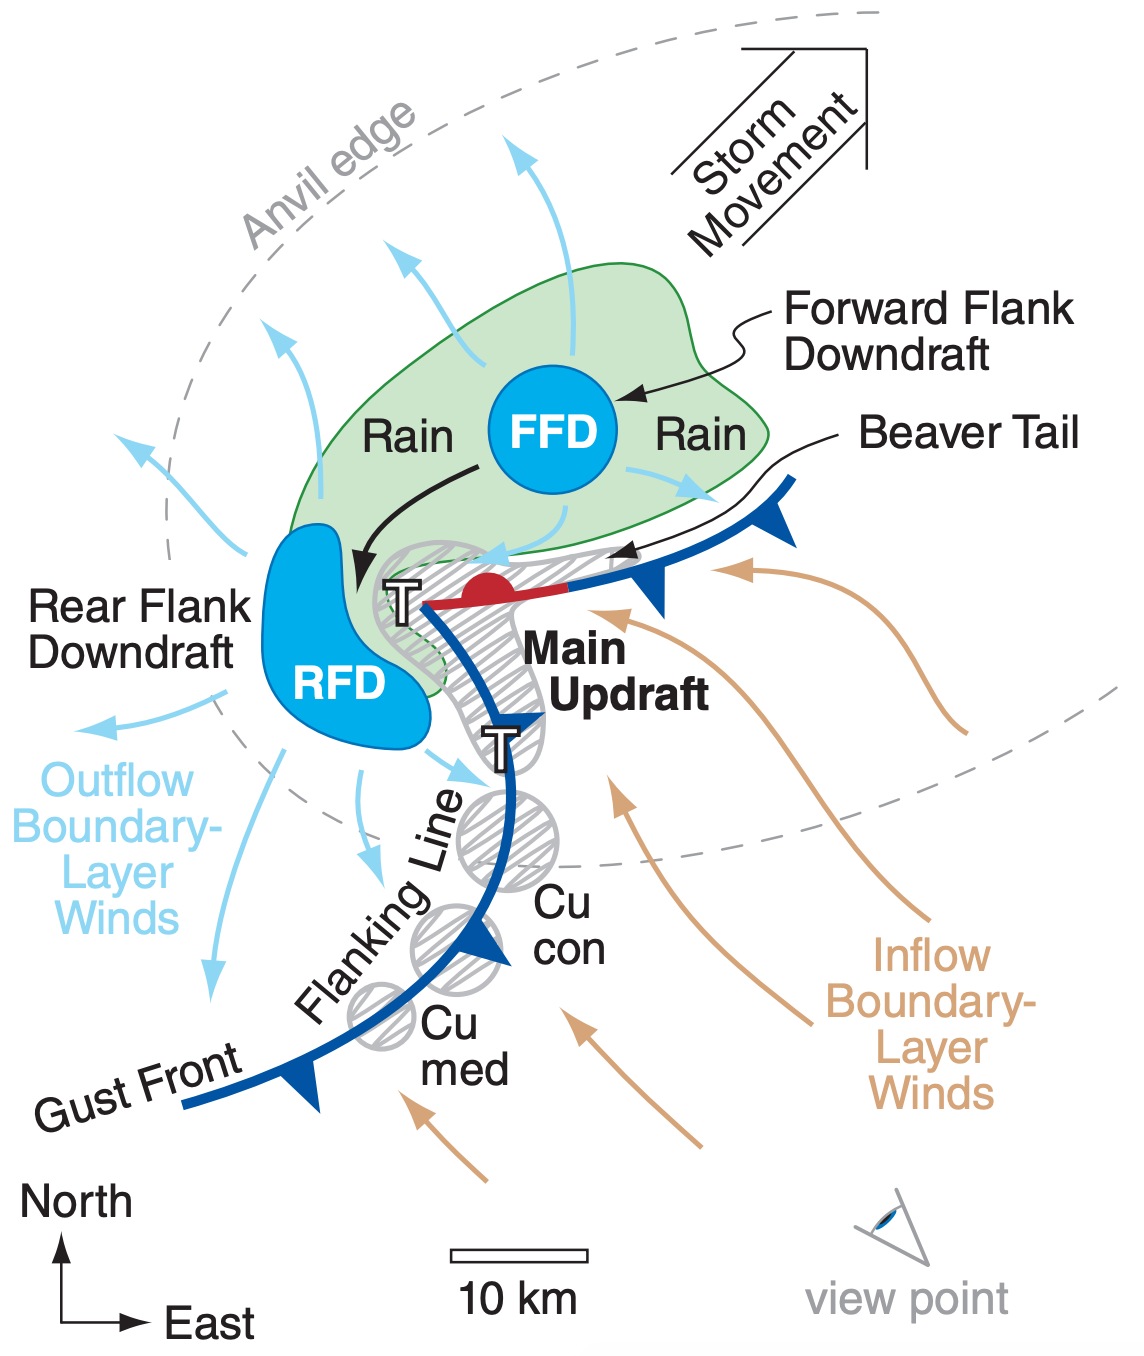
A violent thunderstorm having a rotating updraft and persisting for hours is called a supercell storm (Figs. 14.3 & 14.4). Its downdraft and surface features (Fig 14.18, a duplicate of Fig. 14.4b) are organized in a way to trigger new thunderstorms nearby along a flanking line, and then to entrain these incipient updrafts (cumulus congestus clouds) into the main supercell updraft to give it renewed strength. The main, persistent, rotating updraft, or mesocyclone, is 3 to 10 km in diameter, and can extend throughout the whole depth of the thunderstorm.
Supercell storms are responsible for the most violent tornadoes (EF3 - EF5, as defined in the next chapter) and hail, and can have damaging straightline winds and intense rain showers causing flash floods. To support supercells, the pre-storm environment must have a deep layer of convectively unstable air, and strong wind shear in the bottom 6 km of the troposphere.
Although supercells can have a wide range of characteristics, they are classified into three categories: low-precipitation (LP) storms, medium-precipitation or classic (CL) supercells, and high-precipitation (HP) storms. Storms that fall between these categories are called hybrid storms.
Classic Supercells. Figures 14.3 and 14.4 show characteristics of a classic supercell. One way to understand how supercells work is to follow air parcels and hydrometeors (precipitation particles) as they flow through the storm.
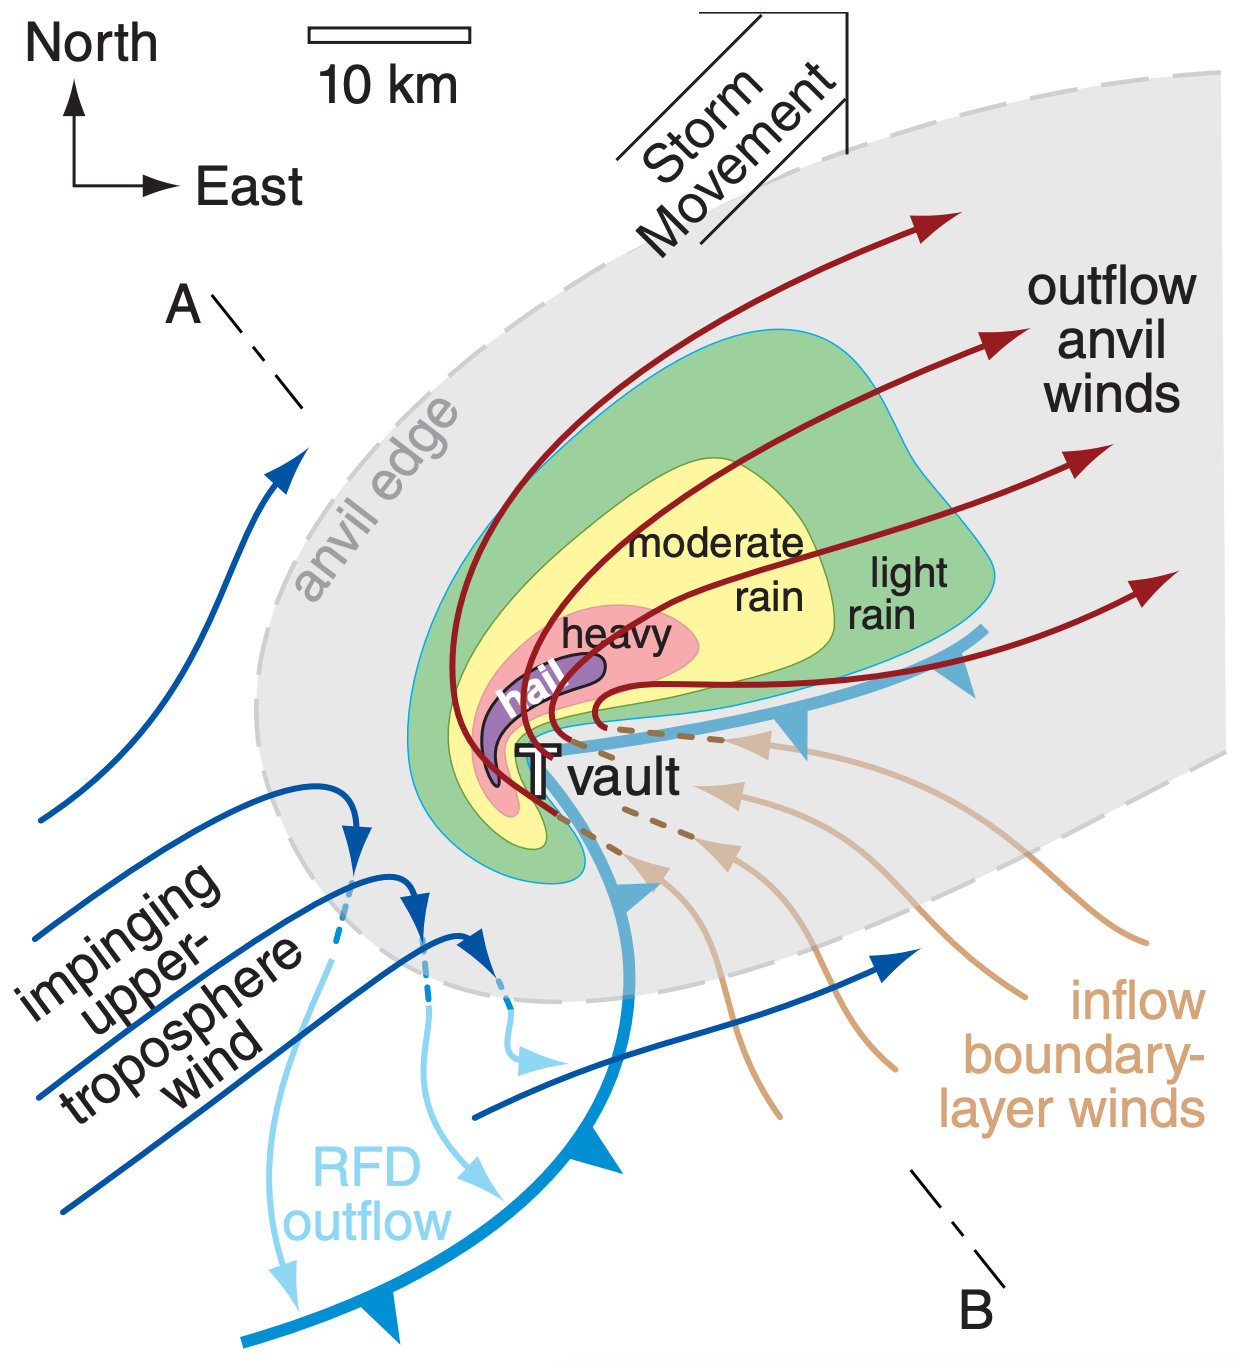
Warm humid boundary-layer air flowing in from the southeast (Fig. 14.19) rises in the main supercell updraft, and tiny cloud droplets form once the air is above its LCL. So much water vapor condenses that large amounts of latent heat are released, causing large buoyancy and strong updrafts (often ≥ 50 m s–1). Cloud droplets are carried upward so quickly in the updraft that there is not yet time for larger precipitation particles to form. Hence, the updraft, while visible by eye as a solid cloud, appears only as a weak echo region (WER) on radar PPI scans because there are no large hydrometeors. This region is also known as an echo-free vault (Fig. 14.19).
As the air reaches the top of the troposphere, it encounters stronger winds, which blows these air parcels and their cloud particles downwind (to the northeast in Fig. 14.19). Since the whole storm generally moves with the mean wind averaged over the bottom 6 km of troposphere (to the northeast in Fig. 14.19), this means that the air parcels in the top part of the storm are flowing to the storm’s forward flank. This differs from MCSs, where the updraft air tilts back toward the storm’s trailing (rear) flank.
While rising, the air-parcel temperature drops to below freezing, and eventually below –40°C near the top of the thunderstorm (similar to Fig. 14.7), at which point all hydrometeors are frozen. Various microphysical processes (cold-cloud Bergeron process, collision, aggregation, etc.) cause largersize hydrometeors to form and precipitate out. The larger, heavier hydrometeors (hail, graupel) fall out soonest, adjacent to the updraft (to the north in Fig. 14.19). Medium size hydrometeors are blown by the upper-level winds farther downwind (northeast), and fall out next. Lighter hydrometeors fall more slowly, and are blown farther downwind and fall in a larger area.
In summer, all of these ice particles (except for some of the hail) melt while falling, and reach the ground as rain. The greatest precipitation rate is close to the updraft, with precipitation rates diminishing farther away. The very smallest ice particles have such a slow fall velocity that they have a long residence time in the top of the troposphere, and are blown downwind to become the anvil cloud.
Meanwhile, the falling precipitation drags air with it and causes it to cool by evaporation (as will be explained in more detail in the next chapter). This causes a downdraft of air called the forward flank downdraft (FFD, see Fig. 14.18). When this cold air hits the ground, it spreads out. The leading edge of the spreading cold air is called the (forward-flank) gust front, and is often indicated with cold-frontal symbols. This gust front helps to deflect the boundary-layer air upward into the main updraft, and can create a beaver-tail cloud, as described earlier.
Due to rotation of the whole updraft (the origin of rotation will be discussed later), the precipitation region is often swept counterclockwise around the updraft for N. Hemisphere supercells. This creates a characteristic curve of the precipitation region that is seen on weather radar as a hook echo around the echo-free vault (Fig. 14.19).
In the S. Hemisphere (and for a small portion of N. Hemisphere supercells — see Fig. 14.63), the updrafts rotate clockwise. These supercells can still produce hook echoes, but with the hook projecting in a direction different than that sketched in Fig. 14.19).
The supercell storm is so tightly organized that it acts as an obstacle to fast winds in the upper troposphere. When these ambient winds from the west or southwest hit the supercell, some are deflected downward, creating the rear-flank downdraft (RFD). As the dry upper-tropospheric air moves down adjacent to the cloudy updraft, it entrains some cloud droplets, which quickly evaporate and cool the air. This negative buoyancy enhances the RFD such that when the air hits the ground it spreads out, the leading edge of which is a (rear-flank) gust front.
When warm, humid boundary-layer air flowing into the storm hits the rear-flank gust front, it is forced upward and triggers a line of cumulus-cloud growth called the flanking line of clouds. The inflow and circulation around the supercell draws these new cumulus congestus clouds into the main updraft, as previously described. At the cusp of the two gust fronts, there is low surface pressure under the updraft. This meso-low (see Table 10-6) and the associated gust fronts look like mesoscale versions of synoptic-scale cyclones, and are the surface manifestation of the mesocyclone.
When warm, humid boundary-layer air flowing into the storm hits the rear-flank gust front, it is forced upward and triggers a line of cumulus-cloud growth called the flanking line of clouds. The inflow and circulation around the supercell draws these new cumulus congestus clouds into the main updraft, as previously described. At the cusp of the two gust fronts, there is low surface pressure under the updraft. This meso-low (see Table 10-6) and the associated gust fronts look like mesoscale versions of synoptic-scale cyclones, and are the surface manifestation of the mesocyclone.
Strong tornadoes are most likely to form in one of two locations in a supercell. One is under the largest cumulus congestus clouds just as they are being entrained into the main updraft, due to the rotation between the RFD and the updraft. These form under the rain-free cloud-base portion of the supercell, and are often easy to view and chase. The other location is under the main updraft at the cusp where the two gust fronts meet, due to rotation from the parent mesocyclone. Tornadoes are discussed in more detail in the next chapter.
Sample Application
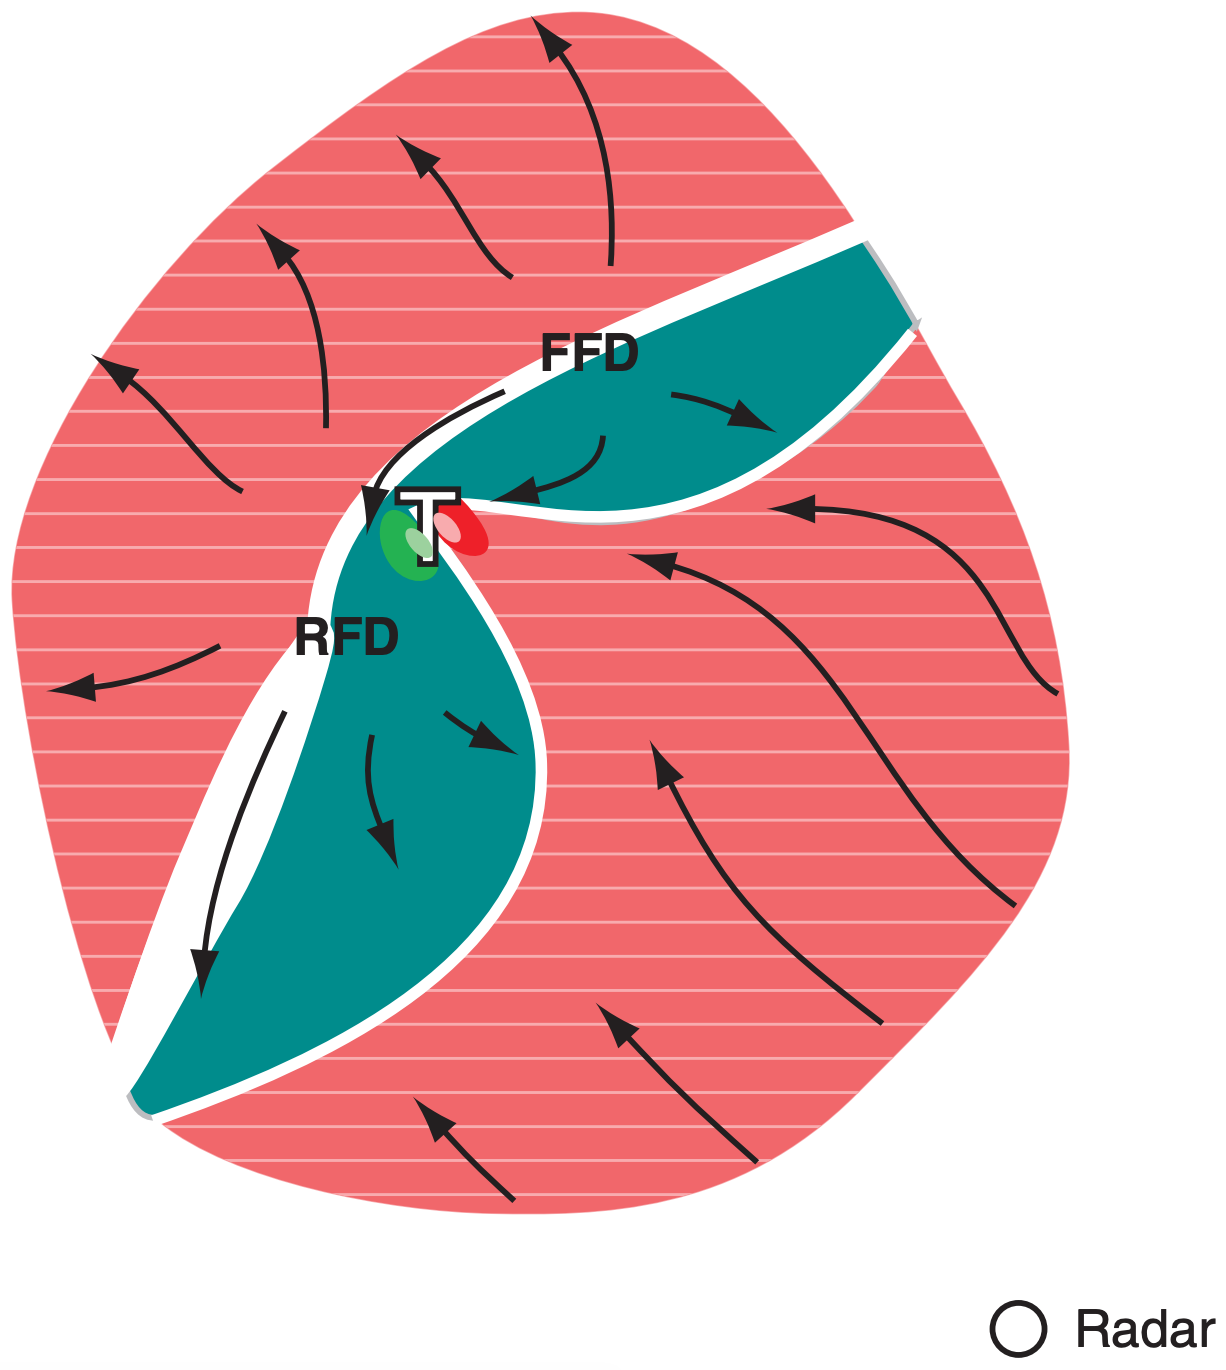
If a Doppler radar were located near the “view point” in the bottom right corner of Fig. 14.18, then sketch the resulting color patterns on the Doppler PPI wind display for near-surface winds.
Find the Answer
Given: Near-surface winds from Fig. 14.18 are copied below, with radar located southeast of the storm center.
Find: Sketch the Doppler wind display.
Assume sufficient number-density of insects to allow Doppler radar returns even in rain-free areas.
Hatched red corresponds to winds away from the radar. Solid turquoise corresponds to winds toward the radar. White is the zero isodop line. Brighter shading of the reds and greens near the “T” is to suggest a tornado vortex signature.
Check: Compares well with info in Chapter 8.
Exposition: Fig. 14.19 already shows the radar reflectivity display. By interpreting the reflectivity and Doppler info together, you can create in your mind a coherent picture of the storm.
The gust fronts show up clearly in the Doppler display. The tornado-vortex signature in the Doppler display and the hook echo in the reflectivity display both suggest the presence of a tornado.
Finally, real thunderstorms are embedded in an environment that is not usually calm, so there would also be red and blue colors outside of the regions sketched here.
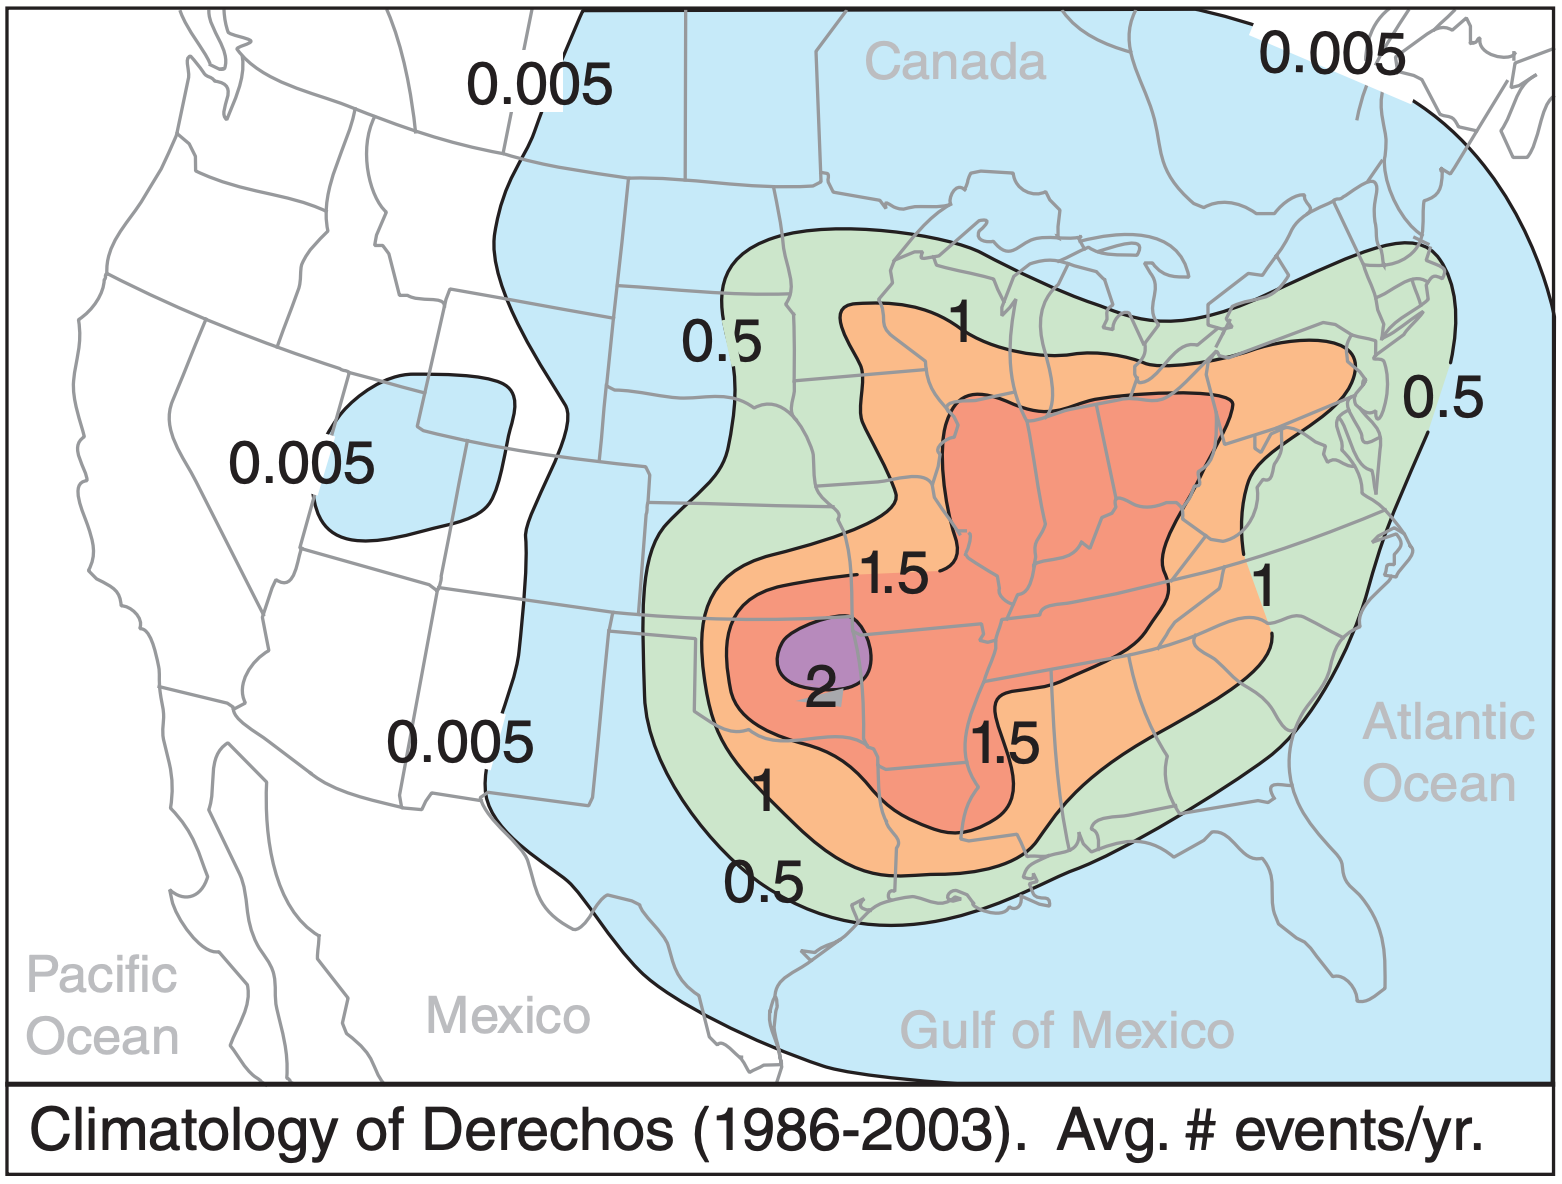
A derecho is a hazardous event of very strong straight-line (non-tornadic) horizontal winds (≥ 26 m s–1) often causing widespread (greater than 100 km wide and 650 km length) damage at the surface. It is associated with clusters of downbursts of air from a single moving mesoscale convective system (MCS), which causes localized destruction that sweeps through the event area during several hours to over a day.
Within the event area, the wind intensity and damage can be variable. Peak wind speeds over 65 m s–1 have been rarely observed. Derechos are associated with rear-inflow jets and bow echoes that propagate in the forward (downshear) direction.
The word “derecho” is based on a Spanish word for “straight-ahead” or “direct”. In North America, derechos occur in the prairies east of the Rocky Mountains (see Fig. below), and were first reported over a century ago. Although derechos can occur during any month, they are most frequent in April through August, with peak frequencies during May and July.
In the USA, an average of 21 derechos occur each year, killing 9 and injuring 145 people annually. Most of the deaths are people in cars and boats, while most of the injuries are people in mobile homes and cars. Derechos can blow down trees, destroy mobile homes, and damage other structures and cars. Damage from derechos is sometimes mistakenly reported as tornado damage.
Low Precipitation Supercells (Fig. 14.20). In drier regions of North America just east of the Rocky Mountains, LCLs are much higher above ground. However, mountains or dry lines can cause sufficient lift to trigger high-base supercell storms. Also, if strong environmental wind shear causes a strongly tilted updraft, then incipient precipitation particles are blown downwind away from the rich supply of smaller supercooled cloud droplets in the updraft, and thus can’t grow large by collection/accretion. Most of the hydrometeors that form in these storms evaporate before reaching the ground; hence the name low-precipitation (LP) supercells.
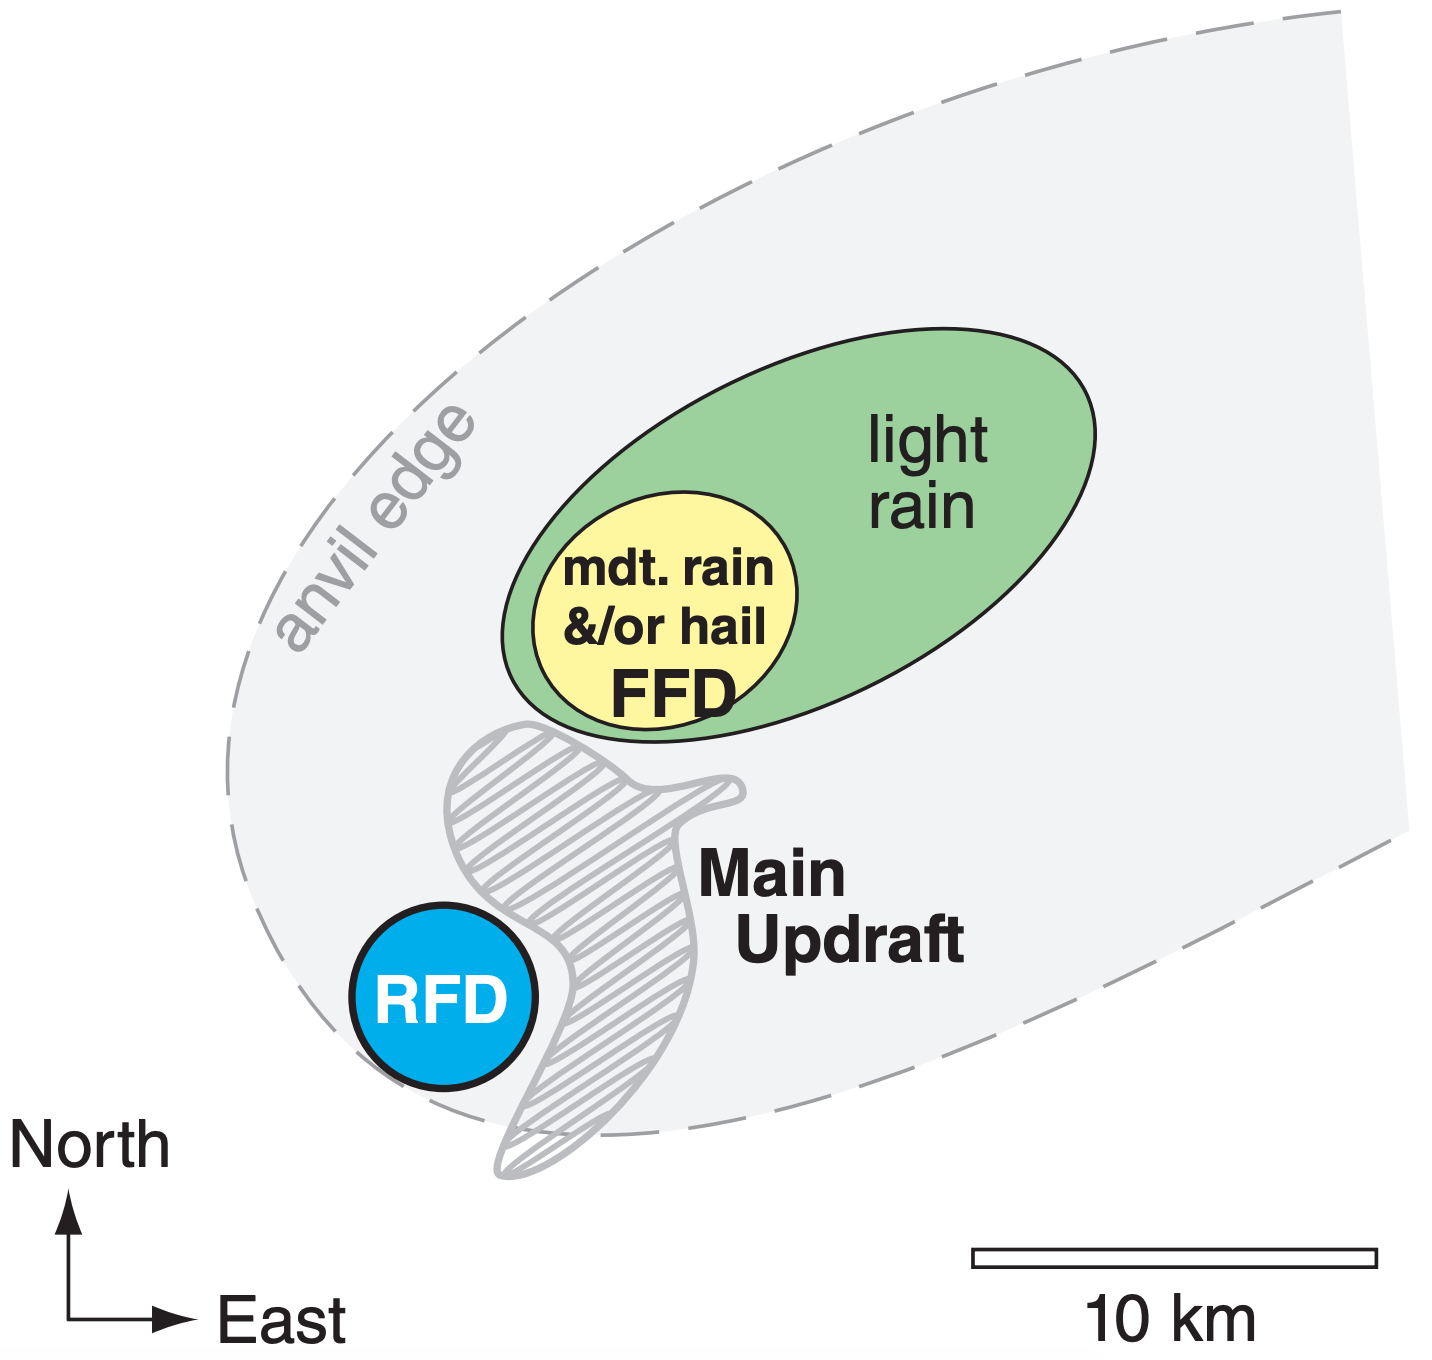
With fewer surrounding low clouds to block the view, LP storms often look spectacular. You can often see the updraft, and can see evidence of its rotation due to cloud striations, curved inflow bands and possibly a rotating wall cloud. If present, the beaver tail is easily visible. Although rainfall is only light to moderate, LP storms can produce great amounts of large-diameter hail. Those LP supercells having exceptionally strong updrafts produce anvils that look like a mushroom cloud from a nuclear bomb explosion.
High Precipitation Supercells (Fig. 14.21). In very warm humid locations such as southeastern North America, some supercell storms can produce widespread heavy precipitation. These are known as high-precipitation (HP) supercells. Precipitation falls from most of the cloud-base areas, often filling both the FFD and the RFD. So much rain falls upstream in the rear-flank region of the storm that the main mesocyclone is sometimes found downstream (forward) of the main precipitation region.
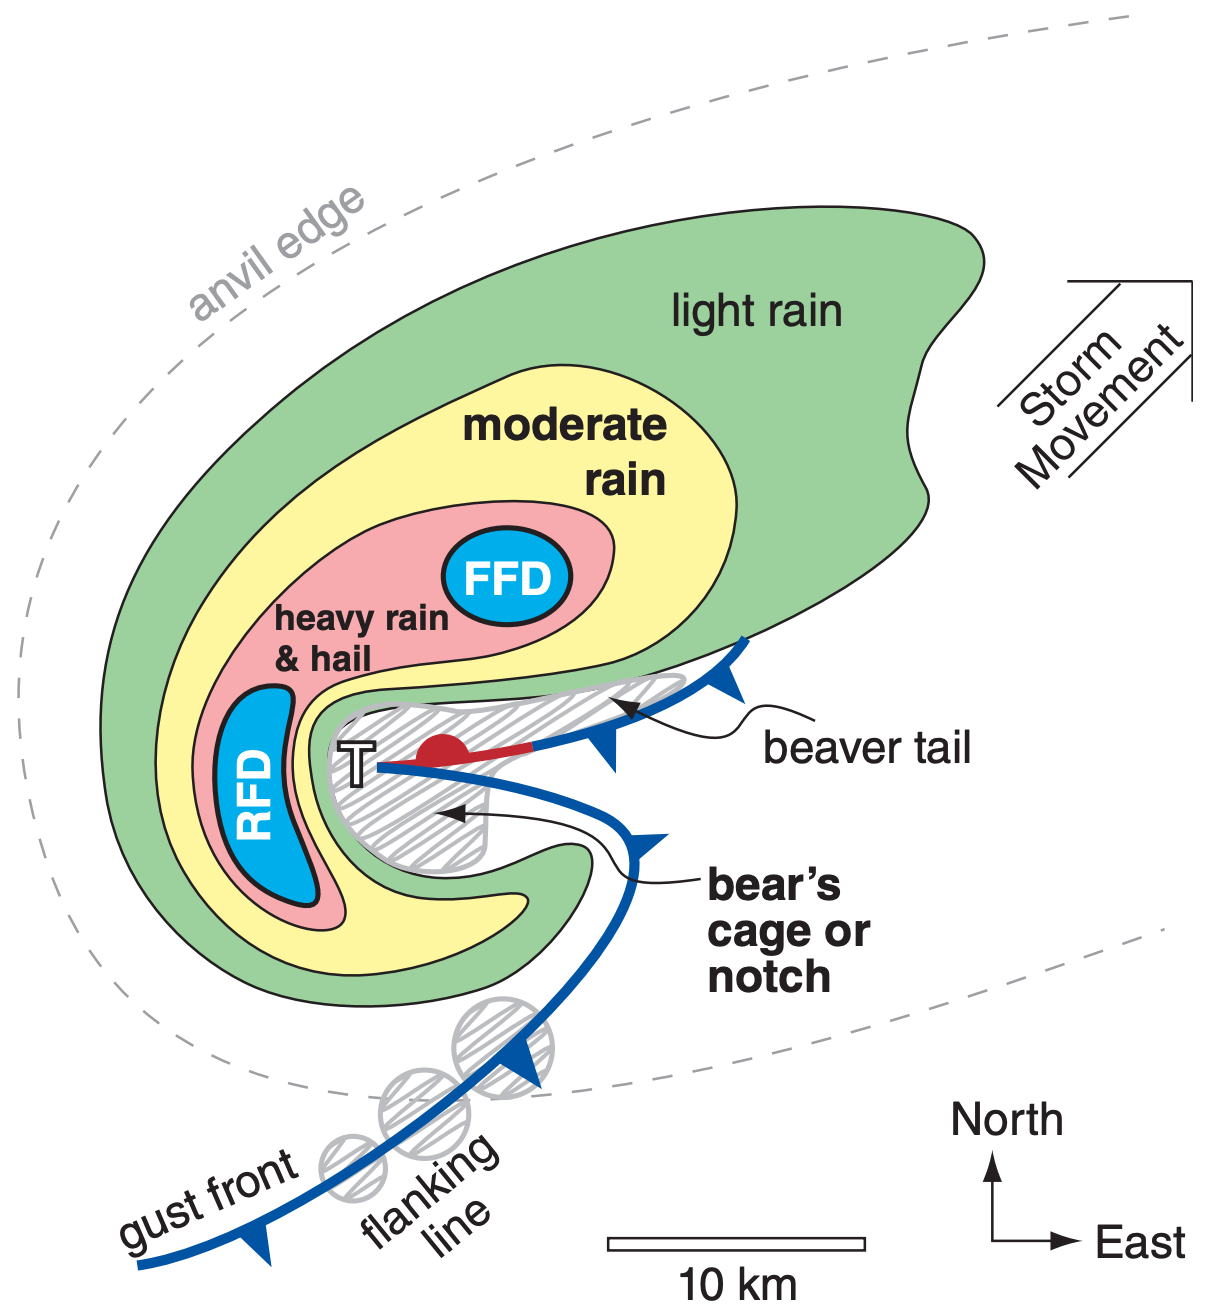
Some storms have curved inflow bands and cloud striations on the updraft that you can see from a distance. Also, the smooth-looking beaver-tail clouds are most common for HP storms, near the forwardflank gust front. Much more of the surrounding sky is filled with low and mid-level clouds, which together with low visibilities makes it difficult to get good views of this storm.
As this type of storm matures, the heavy-rain region of the hook echo can completely wrap around the updraft vault region. Storm chasers call this region the bear’s cage, because of the high danger associated with tornadoes and lightning, while being surrounded by walls of torrential rain and hail with poor visibility and hazardous driving/chasing conditions.
Now that we are finished covering the descriptive appearance and types of thunderstorms, the next five sections examine the meteorological conditions needed to form a thunderstorm.


