7.7: Precipitation Characteristics
- Page ID
- 9946
\( \newcommand{\vecs}[1]{\overset { \scriptstyle \rightharpoonup} {\mathbf{#1}} } \)
\( \newcommand{\vecd}[1]{\overset{-\!-\!\rightharpoonup}{\vphantom{a}\smash {#1}}} \)
\( \newcommand{\dsum}{\displaystyle\sum\limits} \)
\( \newcommand{\dint}{\displaystyle\int\limits} \)
\( \newcommand{\dlim}{\displaystyle\lim\limits} \)
\( \newcommand{\id}{\mathrm{id}}\) \( \newcommand{\Span}{\mathrm{span}}\)
( \newcommand{\kernel}{\mathrm{null}\,}\) \( \newcommand{\range}{\mathrm{range}\,}\)
\( \newcommand{\RealPart}{\mathrm{Re}}\) \( \newcommand{\ImaginaryPart}{\mathrm{Im}}\)
\( \newcommand{\Argument}{\mathrm{Arg}}\) \( \newcommand{\norm}[1]{\| #1 \|}\)
\( \newcommand{\inner}[2]{\langle #1, #2 \rangle}\)
\( \newcommand{\Span}{\mathrm{span}}\)
\( \newcommand{\id}{\mathrm{id}}\)
\( \newcommand{\Span}{\mathrm{span}}\)
\( \newcommand{\kernel}{\mathrm{null}\,}\)
\( \newcommand{\range}{\mathrm{range}\,}\)
\( \newcommand{\RealPart}{\mathrm{Re}}\)
\( \newcommand{\ImaginaryPart}{\mathrm{Im}}\)
\( \newcommand{\Argument}{\mathrm{Arg}}\)
\( \newcommand{\norm}[1]{\| #1 \|}\)
\( \newcommand{\inner}[2]{\langle #1, #2 \rangle}\)
\( \newcommand{\Span}{\mathrm{span}}\) \( \newcommand{\AA}{\unicode[.8,0]{x212B}}\)
\( \newcommand{\vectorA}[1]{\vec{#1}} % arrow\)
\( \newcommand{\vectorAt}[1]{\vec{\text{#1}}} % arrow\)
\( \newcommand{\vectorB}[1]{\overset { \scriptstyle \rightharpoonup} {\mathbf{#1}} } \)
\( \newcommand{\vectorC}[1]{\textbf{#1}} \)
\( \newcommand{\vectorD}[1]{\overrightarrow{#1}} \)
\( \newcommand{\vectorDt}[1]{\overrightarrow{\text{#1}}} \)
\( \newcommand{\vectE}[1]{\overset{-\!-\!\rightharpoonup}{\vphantom{a}\smash{\mathbf {#1}}}} \)
\( \newcommand{\vecs}[1]{\overset { \scriptstyle \rightharpoonup} {\mathbf{#1}} } \)
\(\newcommand{\longvect}{\overrightarrow}\)
\( \newcommand{\vecd}[1]{\overset{-\!-\!\rightharpoonup}{\vphantom{a}\smash {#1}}} \)
\(\newcommand{\avec}{\mathbf a}\) \(\newcommand{\bvec}{\mathbf b}\) \(\newcommand{\cvec}{\mathbf c}\) \(\newcommand{\dvec}{\mathbf d}\) \(\newcommand{\dtil}{\widetilde{\mathbf d}}\) \(\newcommand{\evec}{\mathbf e}\) \(\newcommand{\fvec}{\mathbf f}\) \(\newcommand{\nvec}{\mathbf n}\) \(\newcommand{\pvec}{\mathbf p}\) \(\newcommand{\qvec}{\mathbf q}\) \(\newcommand{\svec}{\mathbf s}\) \(\newcommand{\tvec}{\mathbf t}\) \(\newcommand{\uvec}{\mathbf u}\) \(\newcommand{\vvec}{\mathbf v}\) \(\newcommand{\wvec}{\mathbf w}\) \(\newcommand{\xvec}{\mathbf x}\) \(\newcommand{\yvec}{\mathbf y}\) \(\newcommand{\zvec}{\mathbf z}\) \(\newcommand{\rvec}{\mathbf r}\) \(\newcommand{\mvec}{\mathbf m}\) \(\newcommand{\zerovec}{\mathbf 0}\) \(\newcommand{\onevec}{\mathbf 1}\) \(\newcommand{\real}{\mathbb R}\) \(\newcommand{\twovec}[2]{\left[\begin{array}{r}#1 \\ #2 \end{array}\right]}\) \(\newcommand{\ctwovec}[2]{\left[\begin{array}{c}#1 \\ #2 \end{array}\right]}\) \(\newcommand{\threevec}[3]{\left[\begin{array}{r}#1 \\ #2 \\ #3 \end{array}\right]}\) \(\newcommand{\cthreevec}[3]{\left[\begin{array}{c}#1 \\ #2 \\ #3 \end{array}\right]}\) \(\newcommand{\fourvec}[4]{\left[\begin{array}{r}#1 \\ #2 \\ #3 \\ #4 \end{array}\right]}\) \(\newcommand{\cfourvec}[4]{\left[\begin{array}{c}#1 \\ #2 \\ #3 \\ #4 \end{array}\right]}\) \(\newcommand{\fivevec}[5]{\left[\begin{array}{r}#1 \\ #2 \\ #3 \\ #4 \\ #5 \\ \end{array}\right]}\) \(\newcommand{\cfivevec}[5]{\left[\begin{array}{c}#1 \\ #2 \\ #3 \\ #4 \\ #5 \\ \end{array}\right]}\) \(\newcommand{\mattwo}[4]{\left[\begin{array}{rr}#1 \amp #2 \\ #3 \amp #4 \\ \end{array}\right]}\) \(\newcommand{\laspan}[1]{\text{Span}\{#1\}}\) \(\newcommand{\bcal}{\cal B}\) \(\newcommand{\ccal}{\cal C}\) \(\newcommand{\scal}{\cal S}\) \(\newcommand{\wcal}{\cal W}\) \(\newcommand{\ecal}{\cal E}\) \(\newcommand{\coords}[2]{\left\{#1\right\}_{#2}}\) \(\newcommand{\gray}[1]{\color{gray}{#1}}\) \(\newcommand{\lgray}[1]{\color{lightgray}{#1}}\) \(\newcommand{\rank}{\operatorname{rank}}\) \(\newcommand{\row}{\text{Row}}\) \(\newcommand{\col}{\text{Col}}\) \(\renewcommand{\row}{\text{Row}}\) \(\newcommand{\nul}{\text{Nul}}\) \(\newcommand{\var}{\text{Var}}\) \(\newcommand{\corr}{\text{corr}}\) \(\newcommand{\len}[1]{\left|#1\right|}\) \(\newcommand{\bbar}{\overline{\bvec}}\) \(\newcommand{\bhat}{\widehat{\bvec}}\) \(\newcommand{\bperp}{\bvec^\perp}\) \(\newcommand{\xhat}{\widehat{\xvec}}\) \(\newcommand{\vhat}{\widehat{\vvec}}\) \(\newcommand{\uhat}{\widehat{\uvec}}\) \(\newcommand{\what}{\widehat{\wvec}}\) \(\newcommand{\Sighat}{\widehat{\Sigma}}\) \(\newcommand{\lt}{<}\) \(\newcommand{\gt}{>}\) \(\newcommand{\amp}{&}\) \(\definecolor{fillinmathshade}{gray}{0.9}\)7.7.1. Rain-Drop Size Distribution
Small raindrops outnumber large ones. Classically, the rain-drop spectrum has been fit by an exponential function, known as the Marshall-Palmer distribution:
\(\ \begin{align} N=\dfrac{N_{o}}{\Lambda} \exp (-\Lambda \cdot R)\tag{7.33}\end{align}\)
where N is the number of drops of radius greater than R within each cubic meter of air, and No ≈ 1.6x10⁷ m–4. Parameter Λ(m–1) = 8200·(RR)–0.21, where RR is rainfall rate in mm h–1. Fig. 7.22 shows the Marshall-Palmer distribution. While there are on the order of 1000 drops of drizzle size and larger in each cubic meter of air, there are only tens of drops of typical raindrop size and larger.
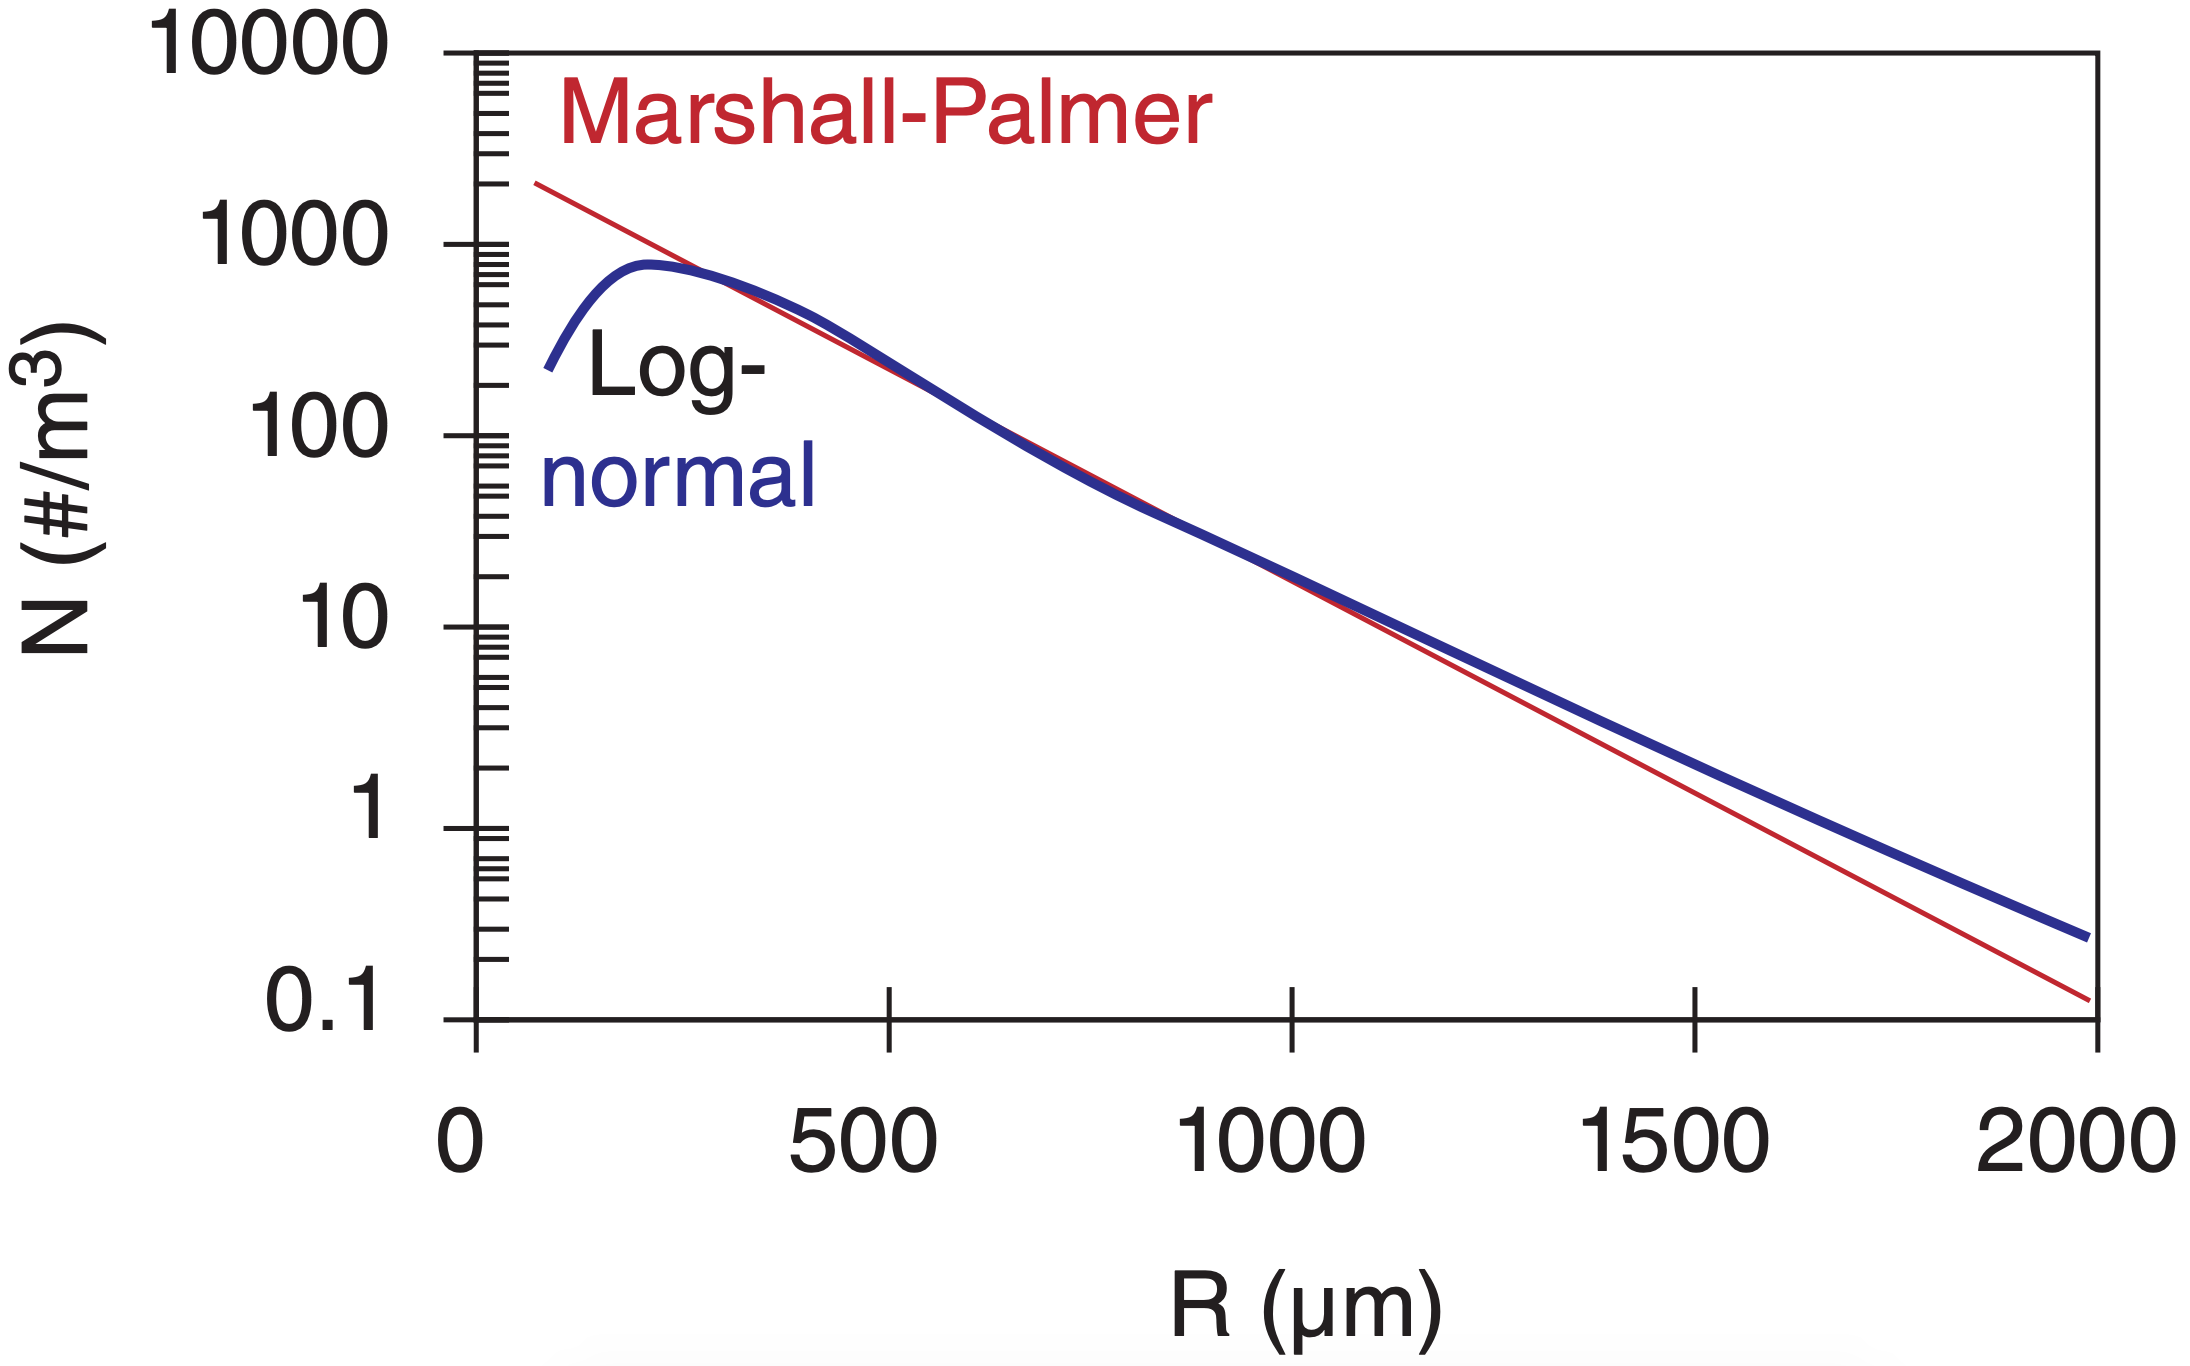
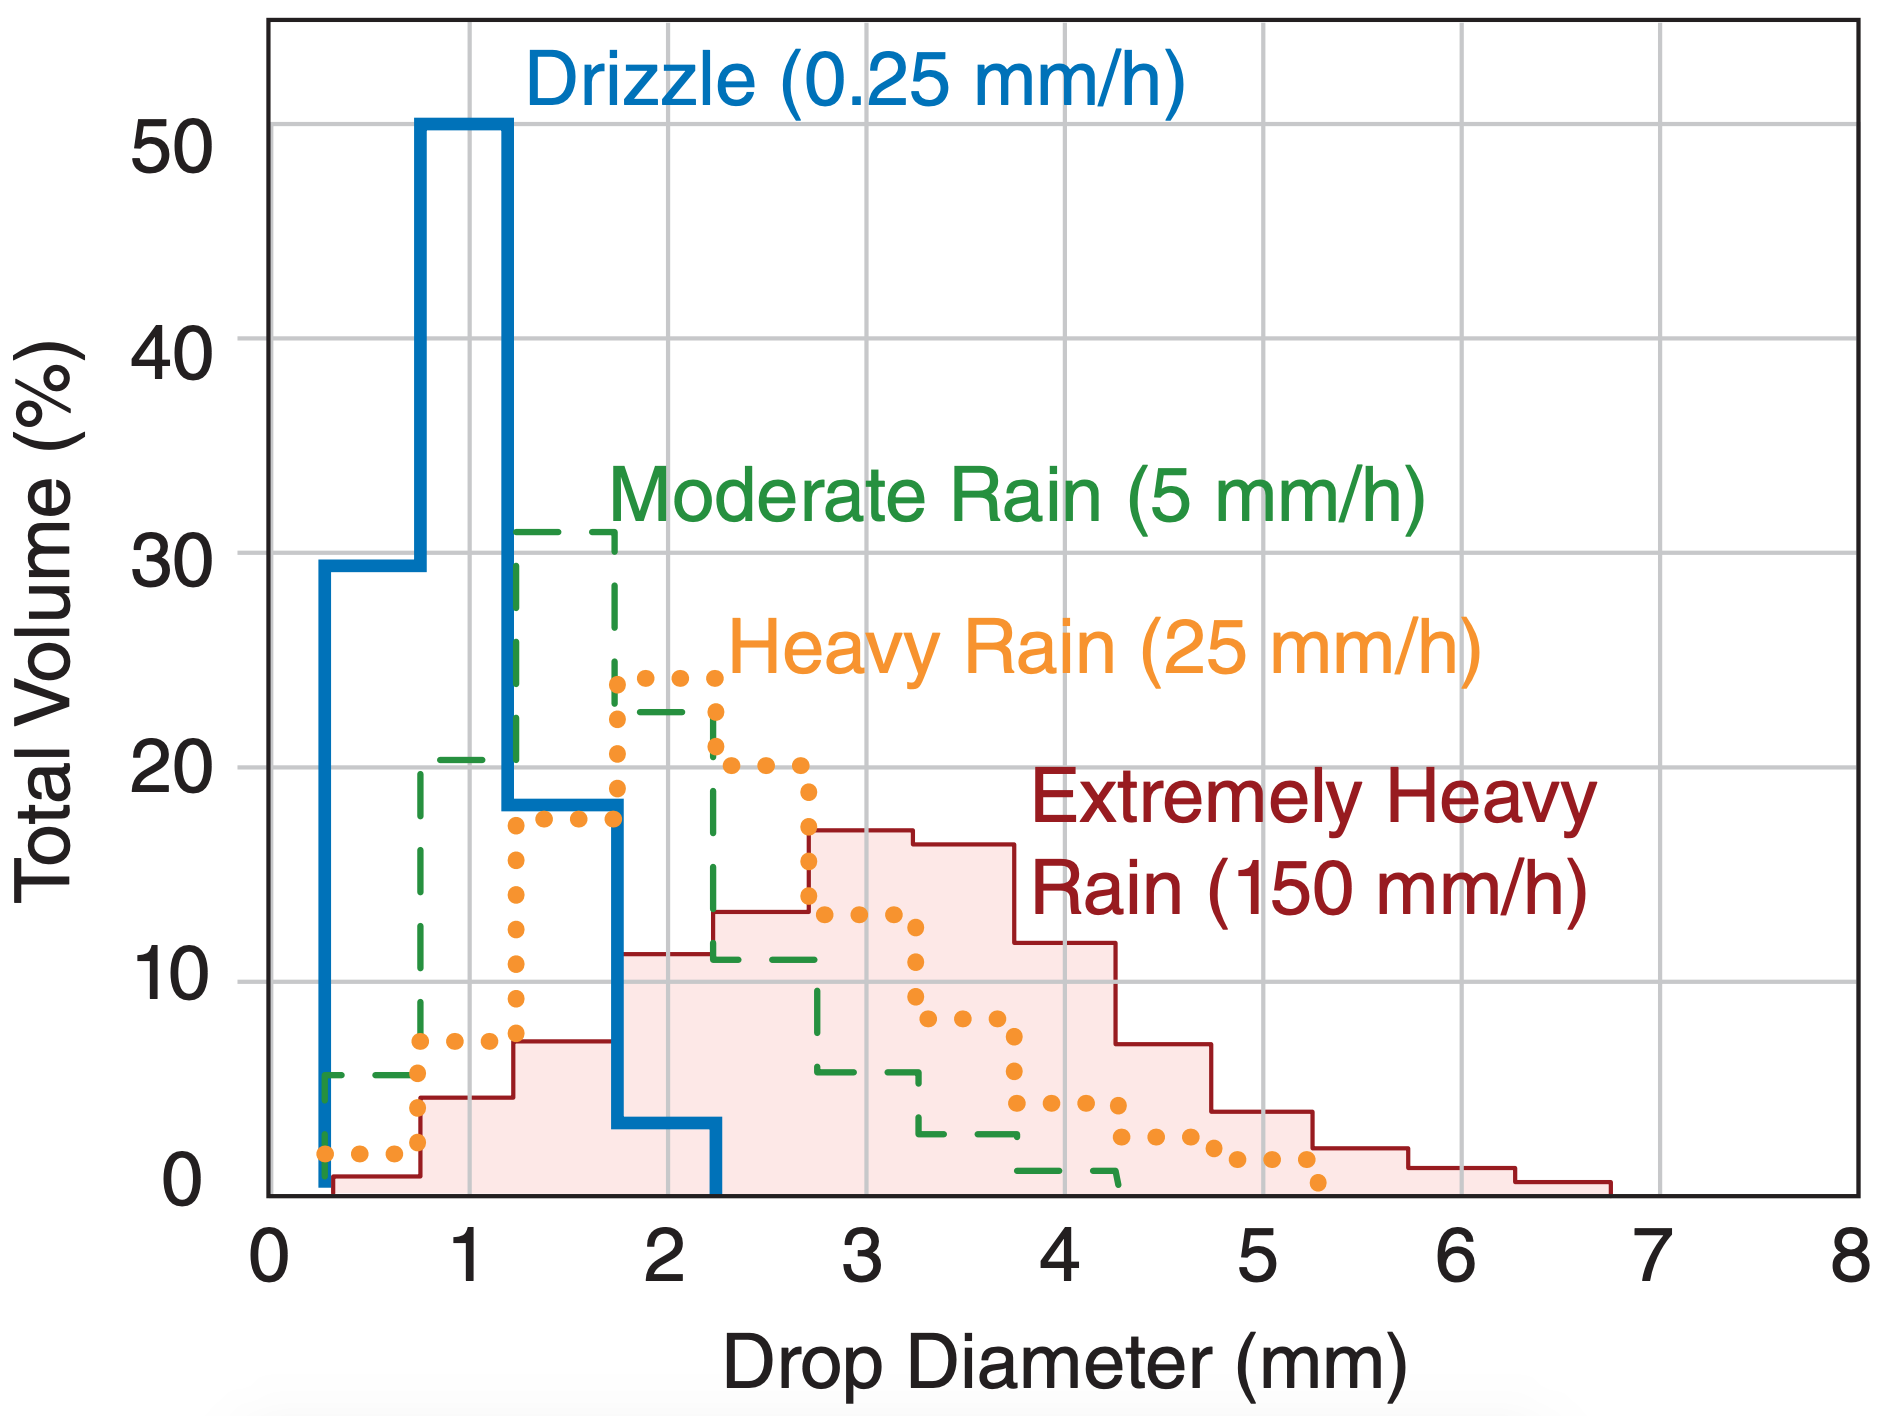
Fig. 7.23 shows rain-drop distributions for a variety of rain rates. Larger drop diameters are associated with heavier rainfall rates. Drop diameters in the range of 4 to 8 mm diameters have been observed for the heaviest rain events. Because large liquid drops tend to break up into smaller ones as they fall, it is possible that some of the largest-diameter drops reported in Fig. 7.23 consisted of still-melting graupel or aggregated/rimed snow.
Beware that these curves vary significantly from storm to storm. Many thunderstorms have much greater numbers of large 1000 to 2500 µm radius drops. Real clouds are very heterogeneous in their generation of rain, causing a patchiness in the rainfall rates. This patchiness causes the raindrop size distributions to continually change with time and place; namely, they are not the simplistic, steady distributions given above. This patchiness is also observed by weather radar (see the Satellites & Radar chapter), and in the rainfall observed by rain gauges on the ground. You have probably also experienced it when driving or walking through rain.
Sample Application
Find the number of raindrops larger than 1000 µm, using the parameters given below.
Find the Answer
Given: RR = 10 mm h–1, No = 1.6x10⁷ m–4 , R = 1000 µm
Find: N = ? m–3 .
First, find Λ = 8200·(10 mm h–1)–0.21 = 5056 m–1 .
Next, use eq. (7.33) for Marshall-Palmer:
N = [(1.6x10⁷ m–4)/(5056 m–1)]·exp[–(5056 m–1)·(10–3 m)] = 20.2 m–3 .
Check: Units OK. Physics OK. Agrees with Fig. 7.22.
Exposition: Don’t forget that N is like 1 – cumulative distribution. It doesn’t give the count of drops of size equal to R, but counts all drops of size R and greater.
7.7.2. Rainfall Rates
| Table 7-3. Rain intensity criteria (from USA Fed. Meteor. Handbook No. 1, Sep 2005), and their corresponding weather-map symbols and Meteorological Aviation Report (METAR) codes for continuous, non-freezing rain. | |||
| Rain Intensity | Rainfall rate | Symbol on Map | |
|---|---|---|---|
| inches h–1 | ≈mm h–1 | METAR code | |
| heavy | > 0.30 | > 7.6 |  |
| +RA | |||
| moderate | 0.11 – 0.30 | 2.6 – 7.6 |  |
| RA | |||
| light | 0* – 0.10 | 0* to 2.5 |  |
| –RA | |||
| trace | < 0.005 | <0.1 | |
| Table 7-4. Drizzle and snow intensity criteria (from USA Fed. Meteor. Handbook No. 1, Sep 2005), and their weather-map symbols and Meteorological Aviation Report (METAR) codes for continuous precipitation. | ||||
| Precip. Intensity | Visibility (xv) | Symbol on Map | ||
|---|---|---|---|---|
| METAR Code | ||||
| miles | ≈km | Drizzle | Snow | |
| heavy | xv ≤ 0.25 | xv ≤ 0.4 |  |
 |
| +DZ | +SN | |||
| moderate | 0.25 < xv ≤ 0.5 | 0.4 < xv ≤ 0.8 |  |
 |
| DZ | SN | |||
| light | xv > 0.5 | xv > 0.8 |  |
 |
| –DZ | –SN | |||
| Table 7-5. Blizzard criteria. | ||
| Weather Condition | Criteria (all must be met) | |
|---|---|---|
| USA | Canada | |
| visibility | ≤ 0.25 mile | ≤ 1 km |
| wind speed | ≥ 35 mi h–1 | ≥ 40 km h–1 |
| duration | ≥ 3 h | ≥ 4 h |
| Table 7-6. Snow density | |
| Density (kg m–3) | Characteristics |
|---|---|
| 50 - 100 | Fresh falling snow. |
| 100 - 200 | New top snow. Uncompacted. Called “powder” by skiers. |
| 200 - 300 | Settled snow on ground. Self-compacted after several days. |
| 300 - 500 |
Snow compacted by grooming machines. Some target densities (kg m–3) for groomed ski slopes are: 450 for cross-country (nordic) tracks, 530-550 for snowboard and downhill (alpine) runs, and 585 - 620 for slalom. Also forms naturally in deep layers of snow, such as during glacier formation. |
| 500 - 550 | Called “névé”. Snow that has been partially melted, refrozen, & compacted. |
| 550 - 830 | Called “firn”. Naturally compacted and aged over 1 year. A form of ice still containing air channels, observed during glacier formation. |
| 830 - 917 | Ice with bubbles, typical in the top 1000 m of old glaciers. |
| 917 | Solid ice (no bubbles). Typical of glacier ice below 1000 m depth. |
Sometimes rainfall rate (i.e., precipitation intensity) is classified as light (or slight), moderate, or heavy. Different countries set different thresholds for these rainfall categories. Table 7-3 shows rainfall intensity criteria used in the USA to determine weather symbols in station plots on surface weather maps. A trace amount of precipitation is a very small amount of rain that might wet the ground, but is too small to be detected in a rain gauge (i.e., < 0.1 mm). See the Thunderstorm chapters for more information about very heavy rain and downpours from thunderstorms.
Drizzle is precipitation of very small drops (diameter < 0.5 mm) that are closely spaced and uniform. Although precipitation rates (mm h–1) from drizzle are usually very small, drizzle can reduce visibility (Table 7-4).
World-record rainfall total accumulated depth dmax.rain in a rain gauge over any storm period Prain is approximately contained under the following envelope:
\(\ \begin{align}d_{\max . \text {rain}}=a \cdot P_{\text {rain}}^{1 / 2}\tag{7.34}\end{align}\)
where a = 363 mmrain·h–1/2. For example, on 25 May 1920 Fussen, Germany received 126 mm in 8 minutes. On 18 July 1942 Smethport, PA, USA received 780 mm in 6 hours. On 15 March 1952, Cilaos, La Réunion Island received 1,830 mm in 1 day. Cherrapunji, India received 2,493 mm in 48 h on 15-16 Jun 1995, and 9,300 mm for the month of July 1861, and received 26,470 mm in the year ending 31 July 1861.
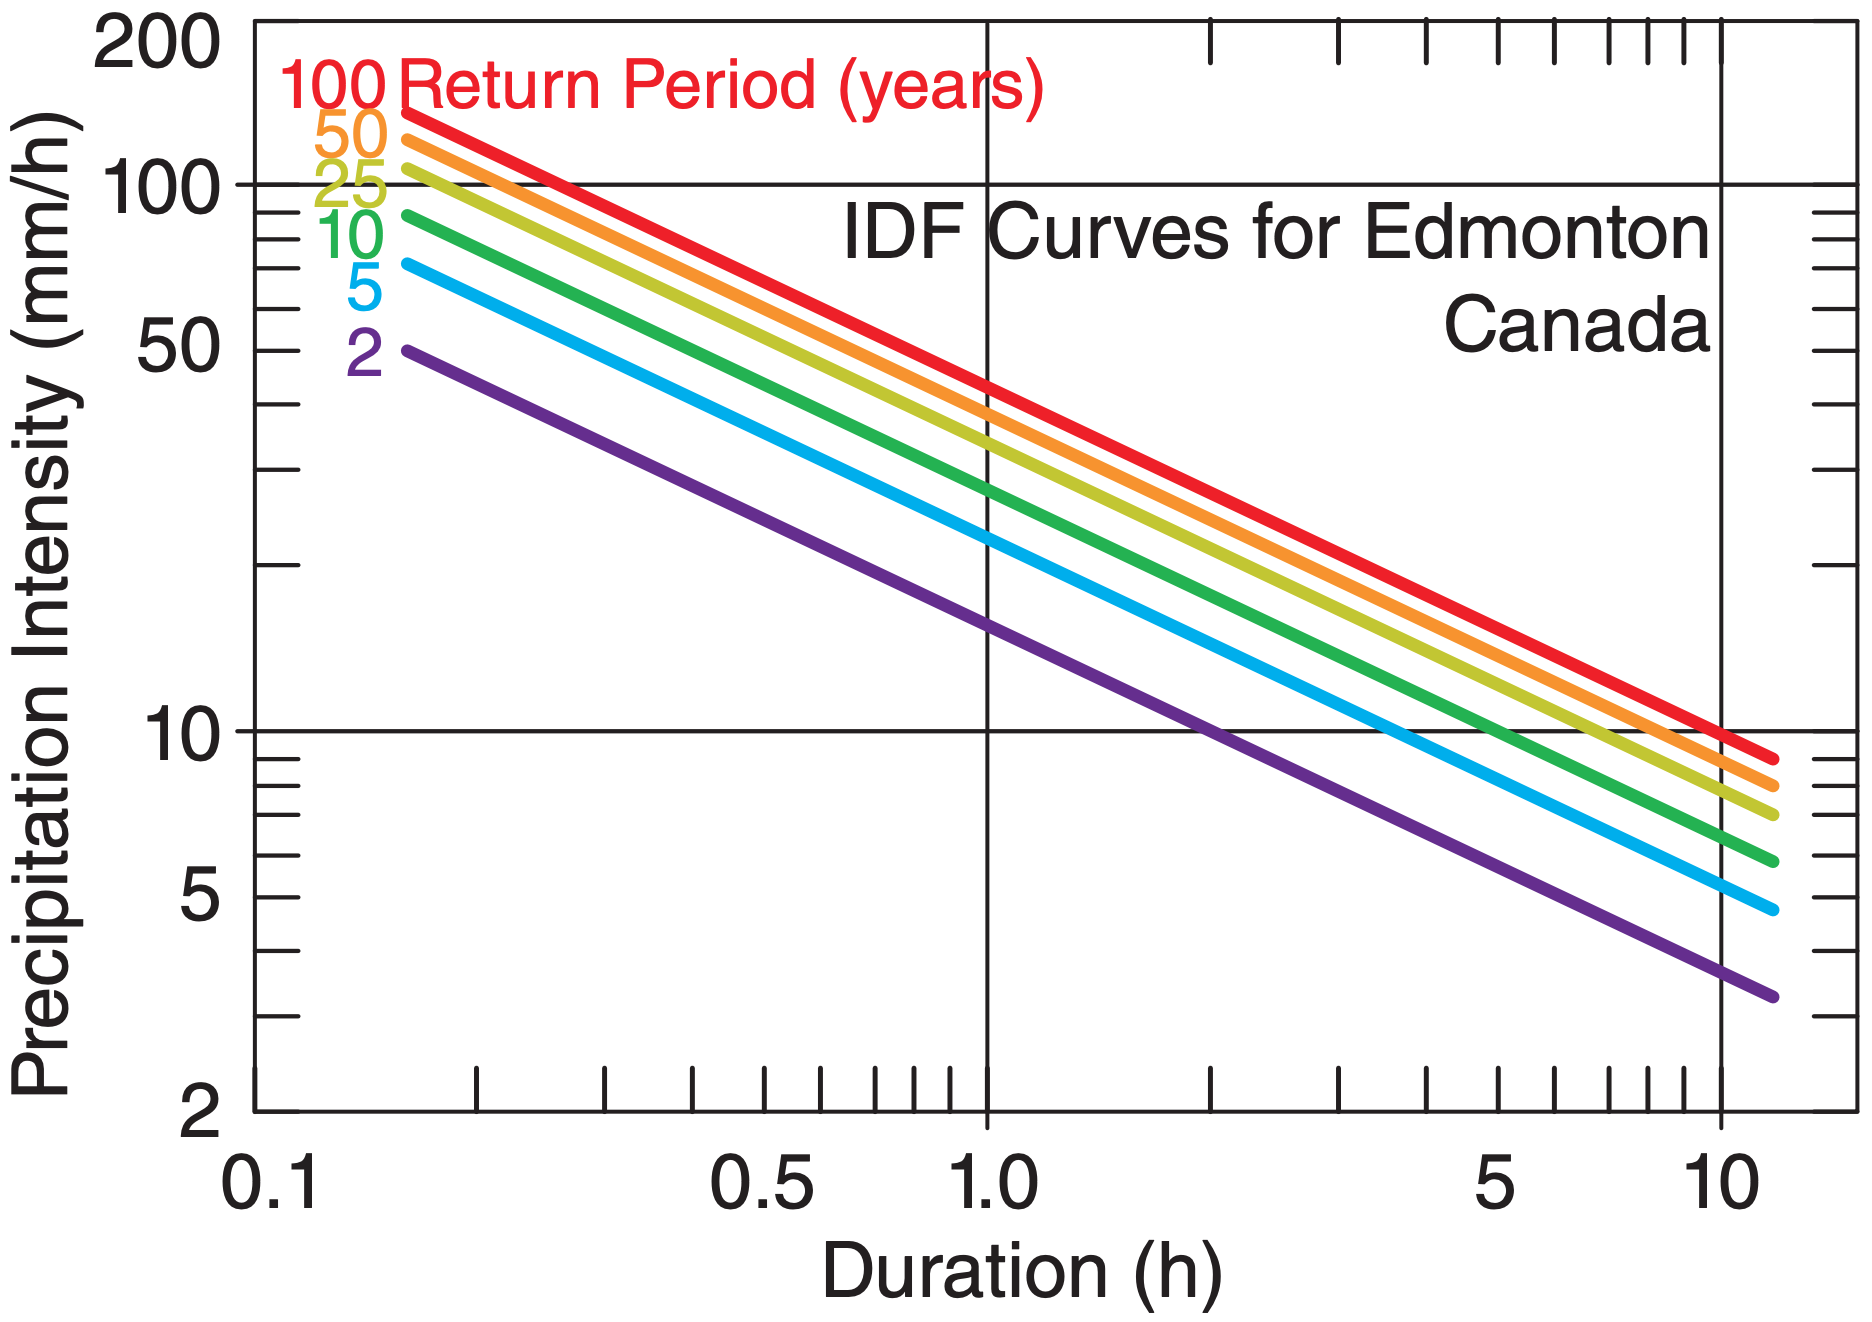
Rain intensity-duration-frequency (IDF) relationships are used when designing dikes, bridges, and drainage systems. One simple IDF model is
\(\ \begin{align} \dfrac{I}{I_{o}}=\left(\dfrac{D}{D_{o}}\right)^{p}\tag{7.35}\end{align}\)
where
\(\ \begin{align} \dfrac{I_{o}}{I_{r}}=1+b \ln \left(\dfrac{R P}{R P_{r}}\right)+a\left[\ln \left(\dfrac{R P}{R P_{r}}\right)\right]^{2}\tag{7.36}\end{align}\)
RP = return period (years; the average time between events), I = precipitation intensity (mm h–1), D is precipitation duration (h), and subscripts o and r indicate reference values.
For example, for Edmonton, Canada, a = 0.5, b = 0.015, c = –0.6425, Do = 1 h, RPr = 2 years, and Ir = 15.8 (mm h–1). For any return period of interest (e.g., RP = 50 years), first use eq. (7.36) to find Io. Then use that Io with any duration (e.g., D = 0.25 h) in eq. (7.35) to find the corresponding intensity of precipitation. Fig. 7.24 shows the IDF curves for Edmonton. Civil engineers can use that figure to find the return period for a rainstorm of any intensity and duration.
Sample Application
Is depth-envelope eq. (7.34) valid for: (a) 206 mm/20 min at Curtea-de-Arges, Romania on 7 July 1889; (b) 304.8 mm/42 min at Holt, MO, USA on 22 July 1947?
Find the Answer
Given: (a) dobs = 206 mm, Prain = 20 minutes = 0.333 h
(b) dobs = 304.8 mm , Prain = 42 min = 0.7 h
Find: if dobs is approx. equal or less than dmax rain
Use eq. (7.34): (a) dmax rain = 209.6 mm
(b) dmax rain = 303.7 mm
Check: Units look OK. Magnitude is reasonable.
Exposition: Yes, envelope is approx. valid for both.
Sample Application
What intensity precipitation for Edmonton would be expected for a return period of 50 years and a duration 15 min?
Find the Answer
Given: RP = 50 y, D = 0.25 h. Emonton, Canada
Find: I = ? (mm h–1)
Use eq. (7.36): Io=15.8(mm h–1)·[1+0.5·ln(50/2) – 0.015·ln2(50/2)] = 38.77 (mm h–1)
Use eq. (7.35): I = 38.77 (mm h–1)·(0.25/1)–0.6425 = 94.5 (mm h–1)
Check: Units good. Agrees with Fig. 7.24.
Exposition: This is a very heavy rainfall rate over a short time, but luckly it doesn’t happen frequently.
7.7.3. Snowfall Rates & Snow Accumulation
Snowfall rates in the US are classified using the same visibility criterion as drizzle (Table 7-4). Low visibility due to heavy snowfall or blowing loose snow, when accompanied by strong winds, is classified as a blizzard if it persists for 3 to 4 hours (Table 7-5). If you are outside in a blizzard, you could easily get disoriented and not be able to return to a shelter, because of white-out conditions, where the snow makes the ground and sky look uniformly white so you cannot discern any features or landmarks.
When it is snowing, the precipitation rate is usually measured as liquid-water equivalent in units of mm h–1. Namely, it is the precipitation rate after all precipitation is melted. Heated rain gauges accomplish this.
You can also estimate the snowfall rate by periodically measuring the depth of snow on the ground using a meter stick or other metric. However, melting of the snow on warm ground, and compression of snow by the weight of snow above cause large errors in these estimates. Thus, liquid-water equivalent is used instead as a more accurate measure.
New fallen snow has a density roughly 10% of that of liquid water. Thus, a rough first guess is that new-fallen snow depth is about 10 times the liquidwater equivalent depth.
Actual snow densities vary widely, as listed in Table 7-6. The density of freshly falling dry snow is very small because of the air between branches of each ice crystal, and because of air trapped between ice crystals as they accumulate on the ground. After snow has fallen, metamorphosis takes place where the tips of the crystals evaporate and redeposit near the crystal centers. Such snow gradually changes into snow grains (similar to sugar grains), and becomes more compact and dense. Snow can be further modified by partial melting and refreezing (on a diurnal cycle, and also on an annual cycle for glacier snow). The weight of additional snow on top can further compact deeper older snow.
Piste is the name for a ski run where the snow has been compacted by grooming machines. Density and strength can be increased by mechanically chopping and compacting the snow, by adding liquid water (that later freezes), and by adding chemicals such as nitrate fertilizers or urea.
7.7.4. Precipitation Distribution
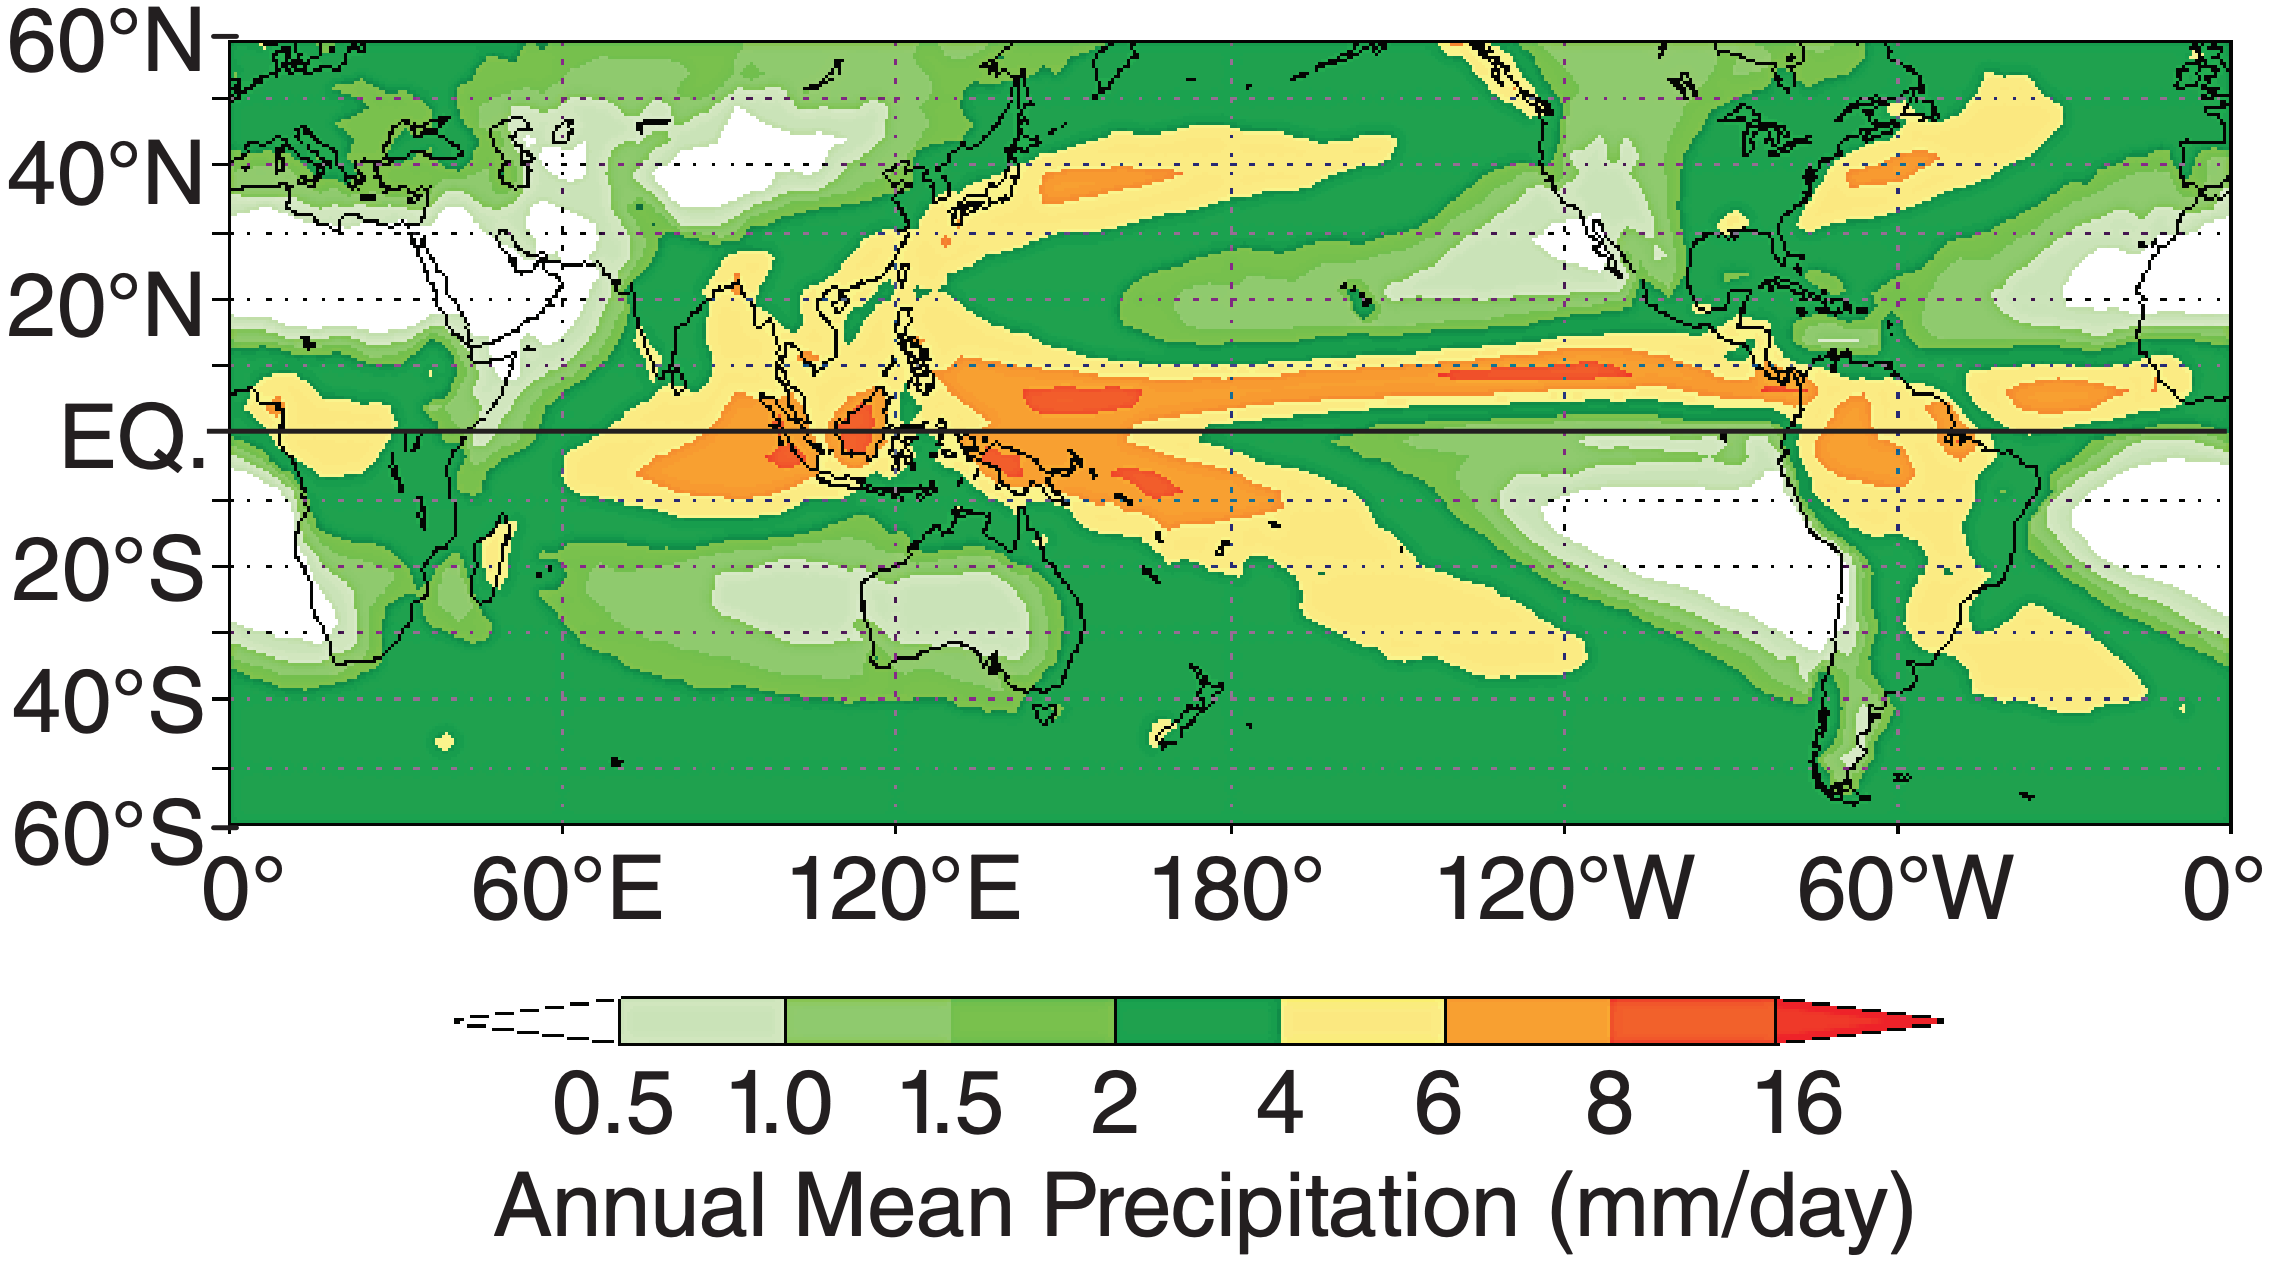
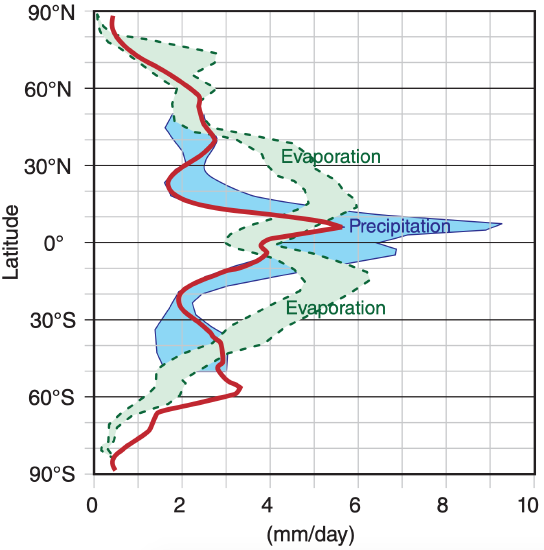
Combining rain-gauge data over land with satellite observations over oceans gives the annual precipitation distribution shown in Fig. 7.25. The heaviest rain is in the tropics, where the warm sea surface causes copious amounts of evaporation (Fig. 7.26), where the warm air can hold a large amount of precipitable water, and where the general circulation contains updrafts. Rain is suppressed at 30° north and south due to extensive regions of downdraft in the Hadley-cell circulation. This circulation is discussed in the General Circulation chapter.
