
1.8: Lab 8 - Water Resources
- Page ID
- 25332
\( \newcommand{\vecs}[1]{\overset { \scriptstyle \rightharpoonup} {\mathbf{#1}} } \)
\( \newcommand{\vecd}[1]{\overset{-\!-\!\rightharpoonup}{\vphantom{a}\smash {#1}}} \)
\( \newcommand{\id}{\mathrm{id}}\) \( \newcommand{\Span}{\mathrm{span}}\)
( \newcommand{\kernel}{\mathrm{null}\,}\) \( \newcommand{\range}{\mathrm{range}\,}\)
\( \newcommand{\RealPart}{\mathrm{Re}}\) \( \newcommand{\ImaginaryPart}{\mathrm{Im}}\)
\( \newcommand{\Argument}{\mathrm{Arg}}\) \( \newcommand{\norm}[1]{\| #1 \|}\)
\( \newcommand{\inner}[2]{\langle #1, #2 \rangle}\)
\( \newcommand{\Span}{\mathrm{span}}\)
\( \newcommand{\id}{\mathrm{id}}\)
\( \newcommand{\Span}{\mathrm{span}}\)
\( \newcommand{\kernel}{\mathrm{null}\,}\)
\( \newcommand{\range}{\mathrm{range}\,}\)
\( \newcommand{\RealPart}{\mathrm{Re}}\)
\( \newcommand{\ImaginaryPart}{\mathrm{Im}}\)
\( \newcommand{\Argument}{\mathrm{Arg}}\)
\( \newcommand{\norm}[1]{\| #1 \|}\)
\( \newcommand{\inner}[2]{\langle #1, #2 \rangle}\)
\( \newcommand{\Span}{\mathrm{span}}\) \( \newcommand{\AA}{\unicode[.8,0]{x212B}}\)
\( \newcommand{\vectorA}[1]{\vec{#1}} % arrow\)
\( \newcommand{\vectorAt}[1]{\vec{\text{#1}}} % arrow\)
\( \newcommand{\vectorB}[1]{\overset { \scriptstyle \rightharpoonup} {\mathbf{#1}} } \)
\( \newcommand{\vectorC}[1]{\textbf{#1}} \)
\( \newcommand{\vectorD}[1]{\overrightarrow{#1}} \)
\( \newcommand{\vectorDt}[1]{\overrightarrow{\text{#1}}} \)
\( \newcommand{\vectE}[1]{\overset{-\!-\!\rightharpoonup}{\vphantom{a}\smash{\mathbf {#1}}}} \)
\( \newcommand{\vecs}[1]{\overset { \scriptstyle \rightharpoonup} {\mathbf{#1}} } \)
\( \newcommand{\vecd}[1]{\overset{-\!-\!\rightharpoonup}{\vphantom{a}\smash {#1}}} \)
\(\newcommand{\avec}{\mathbf a}\) \(\newcommand{\bvec}{\mathbf b}\) \(\newcommand{\cvec}{\mathbf c}\) \(\newcommand{\dvec}{\mathbf d}\) \(\newcommand{\dtil}{\widetilde{\mathbf d}}\) \(\newcommand{\evec}{\mathbf e}\) \(\newcommand{\fvec}{\mathbf f}\) \(\newcommand{\nvec}{\mathbf n}\) \(\newcommand{\pvec}{\mathbf p}\) \(\newcommand{\qvec}{\mathbf q}\) \(\newcommand{\svec}{\mathbf s}\) \(\newcommand{\tvec}{\mathbf t}\) \(\newcommand{\uvec}{\mathbf u}\) \(\newcommand{\vvec}{\mathbf v}\) \(\newcommand{\wvec}{\mathbf w}\) \(\newcommand{\xvec}{\mathbf x}\) \(\newcommand{\yvec}{\mathbf y}\) \(\newcommand{\zvec}{\mathbf z}\) \(\newcommand{\rvec}{\mathbf r}\) \(\newcommand{\mvec}{\mathbf m}\) \(\newcommand{\zerovec}{\mathbf 0}\) \(\newcommand{\onevec}{\mathbf 1}\) \(\newcommand{\real}{\mathbb R}\) \(\newcommand{\twovec}[2]{\left[\begin{array}{r}#1 \\ #2 \end{array}\right]}\) \(\newcommand{\ctwovec}[2]{\left[\begin{array}{c}#1 \\ #2 \end{array}\right]}\) \(\newcommand{\threevec}[3]{\left[\begin{array}{r}#1 \\ #2 \\ #3 \end{array}\right]}\) \(\newcommand{\cthreevec}[3]{\left[\begin{array}{c}#1 \\ #2 \\ #3 \end{array}\right]}\) \(\newcommand{\fourvec}[4]{\left[\begin{array}{r}#1 \\ #2 \\ #3 \\ #4 \end{array}\right]}\) \(\newcommand{\cfourvec}[4]{\left[\begin{array}{c}#1 \\ #2 \\ #3 \\ #4 \end{array}\right]}\) \(\newcommand{\fivevec}[5]{\left[\begin{array}{r}#1 \\ #2 \\ #3 \\ #4 \\ #5 \\ \end{array}\right]}\) \(\newcommand{\cfivevec}[5]{\left[\begin{array}{c}#1 \\ #2 \\ #3 \\ #4 \\ #5 \\ \end{array}\right]}\) \(\newcommand{\mattwo}[4]{\left[\begin{array}{rr}#1 \amp #2 \\ #3 \amp #4 \\ \end{array}\right]}\) \(\newcommand{\laspan}[1]{\text{Span}\{#1\}}\) \(\newcommand{\bcal}{\cal B}\) \(\newcommand{\ccal}{\cal C}\) \(\newcommand{\scal}{\cal S}\) \(\newcommand{\wcal}{\cal W}\) \(\newcommand{\ecal}{\cal E}\) \(\newcommand{\coords}[2]{\left\{#1\right\}_{#2}}\) \(\newcommand{\gray}[1]{\color{gray}{#1}}\) \(\newcommand{\lgray}[1]{\color{lightgray}{#1}}\) \(\newcommand{\rank}{\operatorname{rank}}\) \(\newcommand{\row}{\text{Row}}\) \(\newcommand{\col}{\text{Col}}\) \(\renewcommand{\row}{\text{Row}}\) \(\newcommand{\nul}{\text{Nul}}\) \(\newcommand{\var}{\text{Var}}\) \(\newcommand{\corr}{\text{corr}}\) \(\newcommand{\len}[1]{\left|#1\right|}\) \(\newcommand{\bbar}{\overline{\bvec}}\) \(\newcommand{\bhat}{\widehat{\bvec}}\) \(\newcommand{\bperp}{\bvec^\perp}\) \(\newcommand{\xhat}{\widehat{\xvec}}\) \(\newcommand{\vhat}{\widehat{\vvec}}\) \(\newcommand{\uhat}{\widehat{\uvec}}\) \(\newcommand{\what}{\widehat{\wvec}}\) \(\newcommand{\Sighat}{\widehat{\Sigma}}\) \(\newcommand{\lt}{<}\) \(\newcommand{\gt}{>}\) \(\newcommand{\amp}{&}\) \(\definecolor{fillinmathshade}{gray}{0.9}\)This lab contains potentially inaccessible interactive resources. Please work with your instructor and local campus resources to identify accommodations for these resources.
- Identify key processes in the hydrologic cycle.
- Describe the distribution of water around the world and in the United States.
- Analyze water consumption patterns.
- Define watershed and describe watershed pollutants.
- Analyze water budget data.
Introduction
You have likely heard before that there is more water on Earth than there is land. In fact, more than 70% of Earth’s surface is covered by water. Water is composed of two hydrogen atoms and one oxygen atom and it is known as a “universal solvent”. Water is called the universal solvent because it is capable of dissolving more substances than any other liquid. It is water's chemical composition and physical attributes that make it such an excellent solvent. Water molecules have a polar arrangement of oxygen and hydrogen atoms—one side (hydrogen) has a positive electrical charge and the other side (oxygen) has a negative charge. This allows the water molecule to become attracted to many other different types of molecules. Water can become so heavily attracted to a different compound, like salt (NaCl), that it can disrupt the attractive forces that hold the sodium and chloride in the salt compound together and, thus, dissolve it. This is important to every living thing on Earth. It means that wherever water goes, either through the air, the ground, or through our bodies, it takes along valuable chemicals, minerals, and nutrients.[122]
In this lab, we will discover where water is held on Earth and how it cycles through the planet. We will learn about how we access freshwater and how our actions impact natural water systems.
Part A. The Hydrosphere
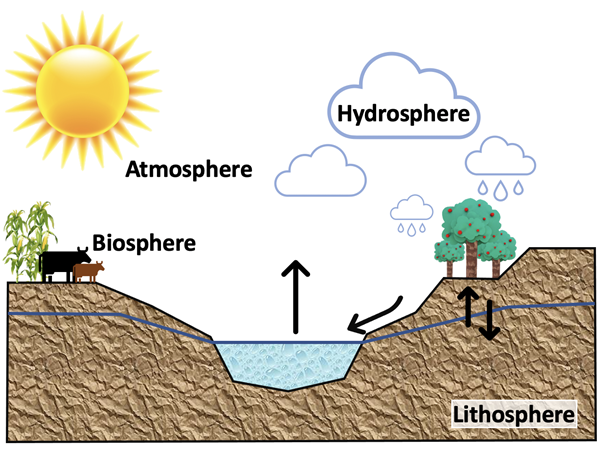
As you have learned, there are four main spheres on Earth: the biosphere, the atmosphere, the lithosphere, and the hydrosphere. All water on Earth exists within the hydrosphere (Figure 8.1). Water exists in three states at Earth’s ambient temperature and atmospheric pressure: as a solid, as a liquid, and as a gas. In addition, water does not only exist as freshwater, but also as salt water. In fact, the percentage of freshwater is much lower than the percentage of salt water, which means the amount of freshwater available for human consumption is actually quite low.
Water cycles through Earth in something called the hydrologic cycle, also known as the water cycle. Much like energy, water cannot be created nor destroyed, it simply changes form. In fact, the very first water ever to exist on Earth is still here today!
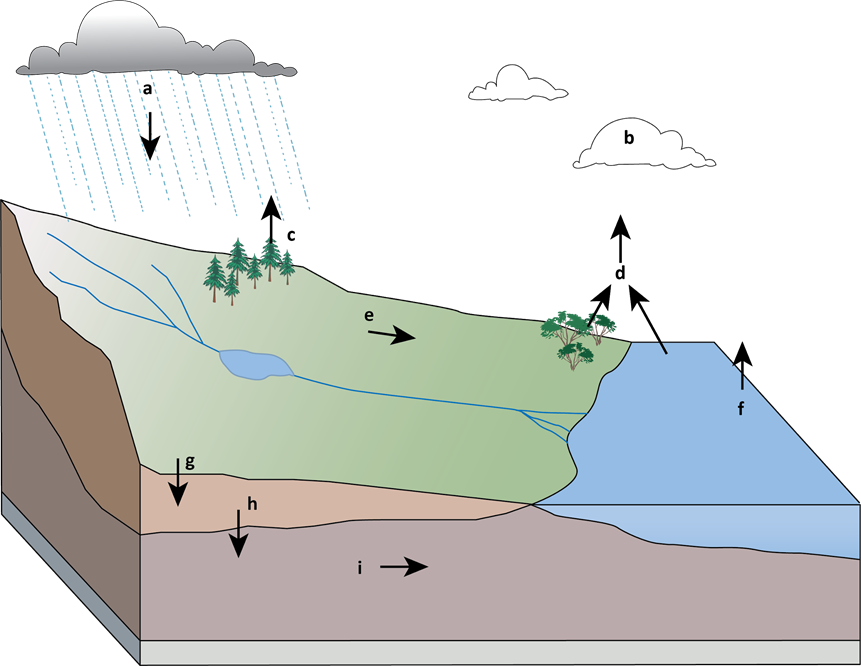
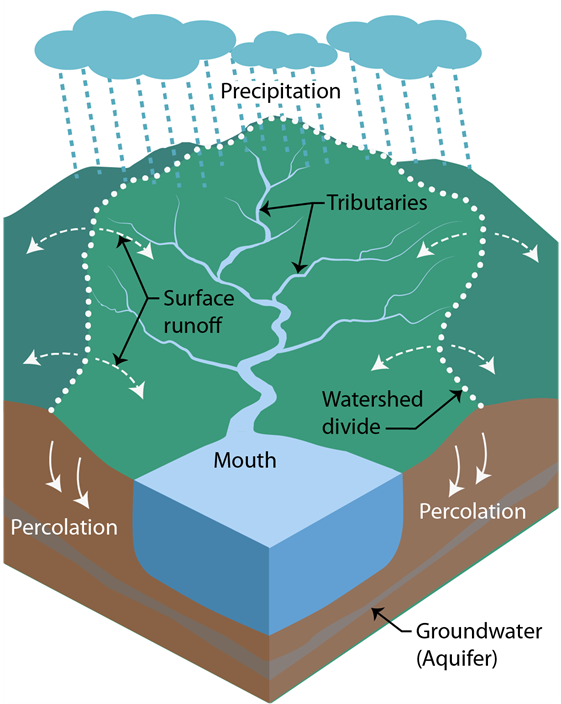
Water moves in a variety of ways within the hydrologic cycle. First, water is evaporated from the Earth in two ways: through evaporation from the surface (such as from oceans, lakes, streams, surfaces, and reservoirs) and through transpiration, a process in which water leaves a plant through its leaves. Recall that evaporation occurs when water changes from a liquid to water vapor. The combination of these two processes is called evapotranspiration and accounts for all water that leaves the surface of the Earth. As water evaporates into the atmosphere as a gas, it cools and condenses in a process called condensation. Condensation occurs when water vapor changes into a liquid. This liquid water falls back onto Earth in a process called precipitation. Once the water reaches the surface of the Earth, it can either runoff along the surface or infiltrate into the ground, which is called groundwater flow. Water that does not infiltrate into the ground is called runoff. Water enters into the ground through a process called infiltration and moves through the soil into deeper depths of the water table in a process called percolation. Some water is also stored underground in layers of permeable rock, called aquifers.
- Refer to the hydrologic cycle diagram below (Figure 8.2). What is the correct process for each of the labels on the diagram? Tip: you will use all but one of the terms shown in bold-faced type in the previous paragraph.
The Global Distribution of Water
Figure 8.3 shows the distribution of water on Earth. As you can see, only 2.5% of water on Earth is freshwater and of that amount, only 30.1% is groundwater. This means that 0.08% of all water on Earth is available to humans as freshwater for irrigation, drinking, and sanitation! Water is stored on Earth in five main reservoirs: oceans (holding 96.5% of all water on Earth), glaciers and ice caps, groundwater, surface water (water in lakes, rivers, and soil), and atmospheric water.
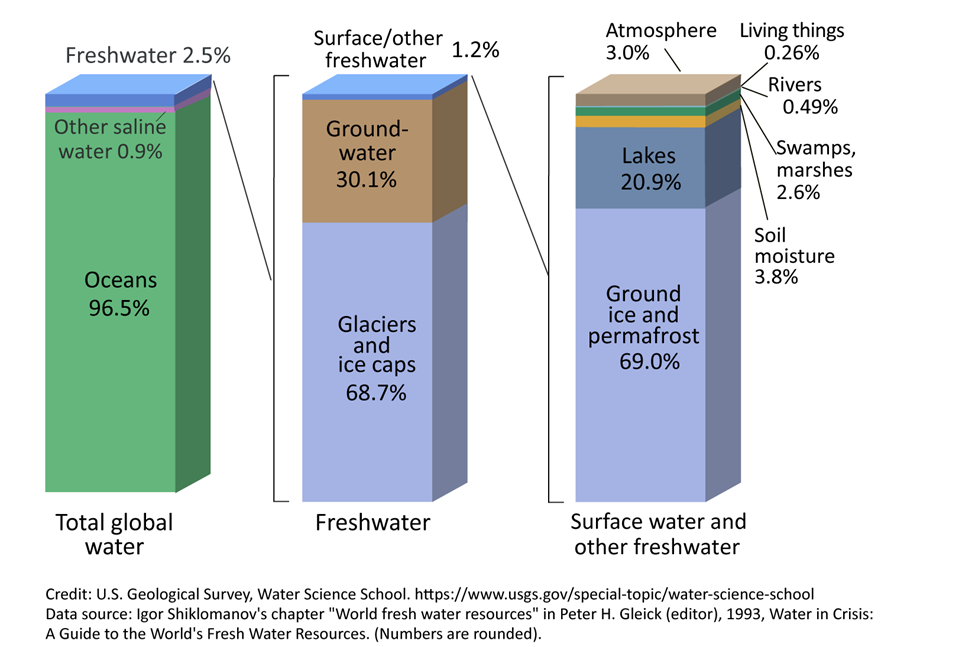
- Refer to Figure 8.3.
- What percentage of water on the planet is freshwater?
- What percentage of water on the planet is in glaciers and ice caps? Tip: notice that the percentage of water in glaciers and ice caps globally is 68.7% of 2.5%. So, you need to calculate how much 68.7% of 2.5 is. Show your calculation.
- What percentage of water on the planet is available as groundwater? Show your calculation.
According to the U.S. Geological Survey (USGS), there is approximately 326 million cubic miles (1.32 billion cubic kilometers) of water on Earth. The distribution of water is shown below in Table 8.1.
| Water Source | Freshwater Volume (cubic kilometers) | Salt Water Volume (cubic kilometers) |
|---|---|---|
| Oceans, Seas, and Bays | 0 | 1,338,000,000 |
| Ice Sheets, Glaciers, and Permafrost | 24,364,000 | 0 |
| Groundwater | 10,530,000 | 12,870,000 |
| Surface Water | 122,210 | 85,400 |
| Atmosphere | 12,900 | 0 |
| Subtotals | 35,029,110 | 1,350,955,400 |
| Grand Total (rounded) | 1,386,000,000 |
- Refer to Table 8.1.
- Which water source contains the highest amount of freshwater?
- Does salt water exist in all 5 water sources? Explain why or why not.
- If frozen water on the planet does not contain salt water, where does the water from a floating iceberg over the sea come from?
- What happens to the freshwater that drains into the sea from a melting ice sheet or glacier?
Human Population and Water Use
As we can see from Figure 8.3 and Table 8.1, there is minimal freshwater water available to people. The distribution of water on Earth changes over time and is dependent upon climate. For example, as Earth warms, more water is stored in the ocean as salt water and as Earth cools, more water is stored in snow, glaciers, and ice sheets as freshwater. Currently, Earth is experiencing a global warming period and the snow, glaciers, and ice sheets are melting rapidly and draining into the sea. This decreases the amount of freshwater available to people. As the amount of freshwater available to people continues to decrease, Earth’s human population is increasing at an extraordinary rate (Figure 8.4). How might this impact water supplies for people?
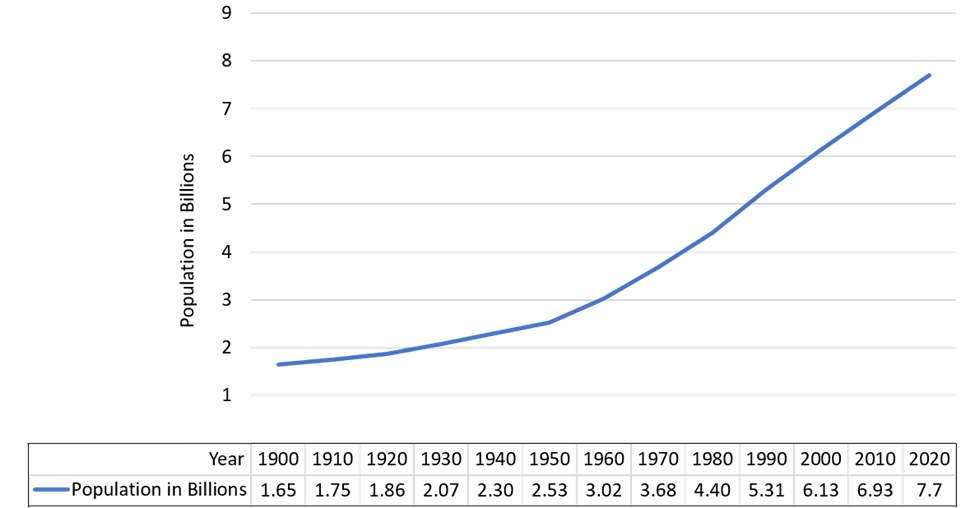
- Refer to Figure 8.4.
- What does Figure 8.4 tell you about Earth’s human population?
- What other information might be helpful to add to this figure?
- What is the difference in population between 1920 and 2020? Tip: subtract the 2020 population from the 1920 population. Show your calculation.
- What percent did the population increase during this period? Tip: divide your answer from 4c by the 1920 population. Then, multiply that number by 100 to get the percentage. Show your calculation.
- What decade experienced the largest increase in population and by how much?
Figure 8.4 provides basic statistics for population and is useful for determining a general idea of what population looks like on the planet. However, in order to plan sustainably and ensure that all of humanity has access to resources like water on the planet, it is important that we look at various factors that influence how water is used and where.
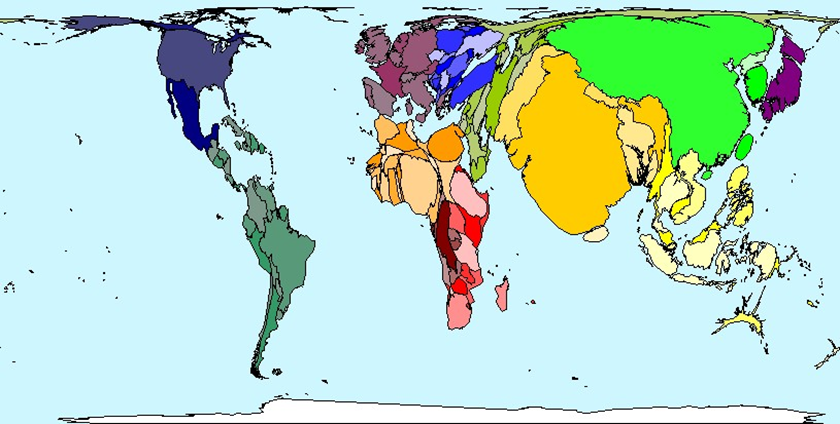
The distribution of water varies globally and in order for us to manage water supplies and ensure all humans have access to water, it is important that we understand the global distribution of water as well as how it is used. One way to geographically display information is by using a cartogram. A cartogram is a map in which the geometry of the regions is distorted in order to show information for a particular variable, such as the distribution of population or income. In this section we will evaluate cartograms that show water usage around the world. Figure 8.5 is a cartogram of water use. The territory size shows the proportion of the worldwide water use occurring in a country. Countries that have enlarged territory sizes have higher rates of water usage. Figure 8.6 is a world population cartogram for comparison.
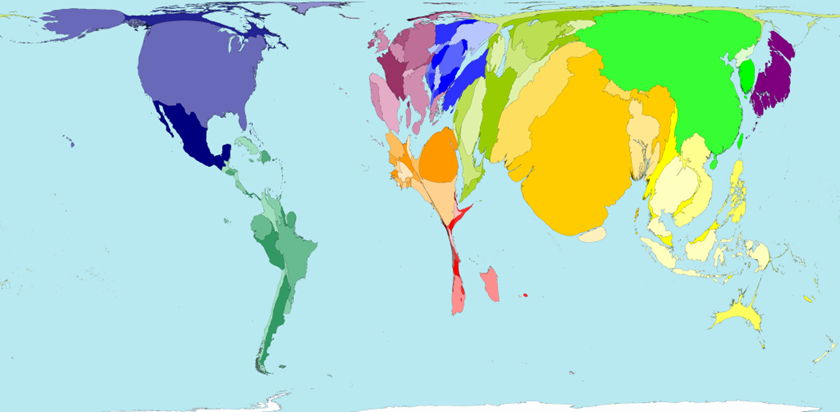
The Worldmapper brief on water use explains that:
Four thousand cubic kilometres of water are used by people each year around the world, for domestic, agricultural and other industrial purposes. This does not include non-consumptive uses such as energy generation, mining, and recreation.
China, India, and the United States use the most water. These are also the territories where the most people live. But water use per person is about three times higher in the United States than it is in India and China.
While everyone needs water,the quantity used varies widely. On average, people living in Central Africa individually use only 2% of the water used by each person living in North America.[130]
Figure 8.7 maps countries based on per capita water usage, measured in cubic meters per year. The data includes water withdrawals from agricultural, industrial, and household/public services uses.
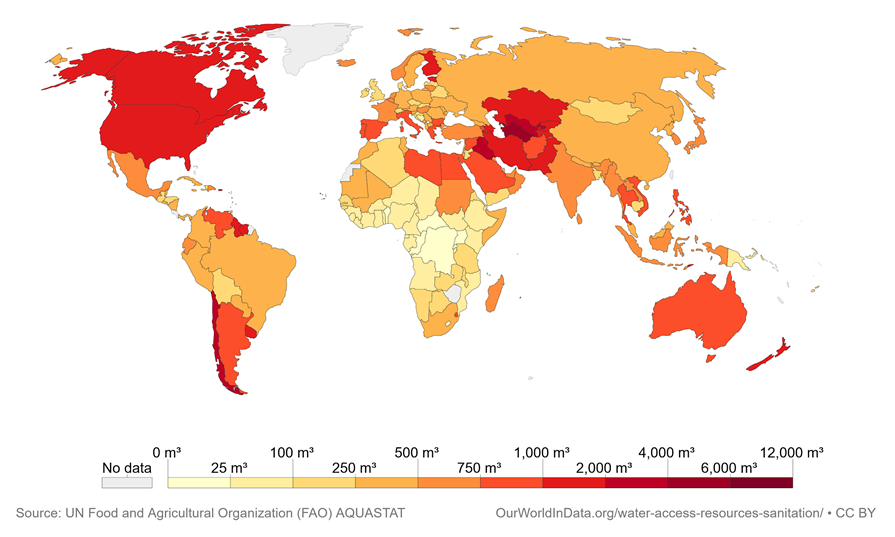
- Refer to Figure 8.7.
- Do you notice any spatial patterns on the map? Which regions have the most water withdrawals and which regions have the least? Explain your response in three to four sentences.
- Use Your Critical Thinking Skills: List factors that might explain why some countries have high levels of water withdrawals.
- Use Your Critical Thinking Skills: List factors that might explain why some countries have low levels of water withdrawals.
- Use Your Critical Thinking Skills: List strategies governments and schools could use to improve water conservation practices.
- Use Your Critical Thinking Skills: How does food play a role in water supplies? Explain your response in one to two sentences.
 Check It Out! Water Withdrawals by Sector
Find out how countries compare in terms of water withdrawals in the agricultural, industrial, and household/public services sectors by going to the Our World in Data website and scrolling down through the maps.
Water Use in the United States
Now that you have a better understanding of how water is used globally, let us take a look at how water is used in the United States. Approximately 87% of the water used in the United States is freshwater, the remaining water used is salt water from the ocean or brackish water bodies such as lagoons and estuaries. According to the USGS, the United States used 322 billion gallons of water per day in 2015. The distribution of that usage is shown in Figure 8.8.
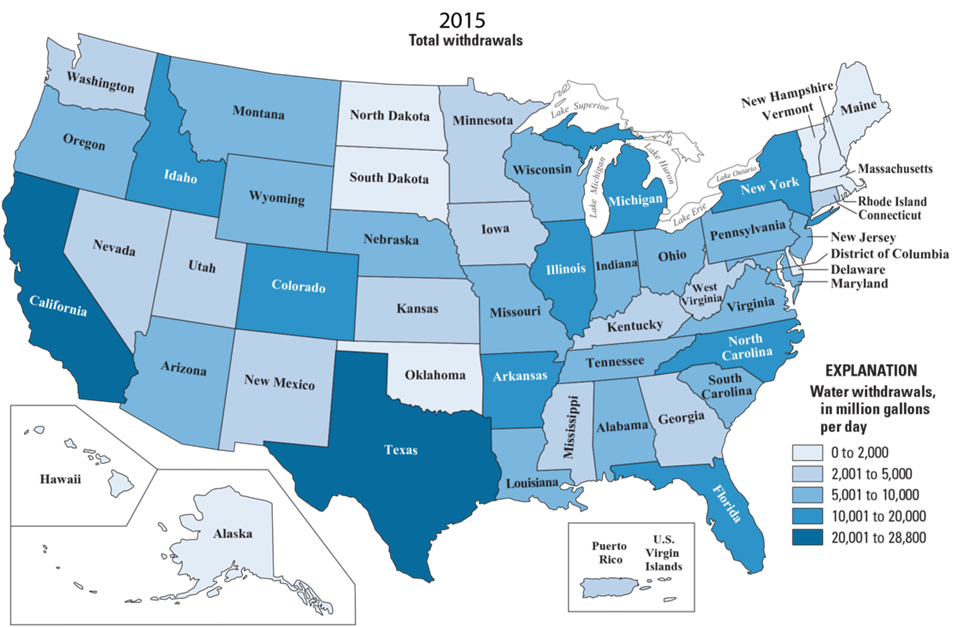
- Refer to Figure 8.8.
- Which states use the most water?
- Which states use the least water?
- Use Your Critical Thinking Skills: List reasons why some states use more water than others.
Do you think population plays a role in your state’s water usage? How does the United States use the water it withdrawals from natural systems? Figure 8.9 shows the distribution of how the 322 billion gallons per day of water was used in 2015. Seven categories were selected for top water usage in the United States by the USGS. We can see that 118 billion gallons per day of water is used for irrigation, and according to the USGS all of this water is pulled from freshwater sources. In other words, the second largest usage of freshwater in the United States is used to provide water for plant growth. This plant growth accounts for all agriculture uses, including chemical application, crop cooling, and harvesting. In addition, irrigation is used for plant growth in golf courses, cemeteries, nurseries, and parks.
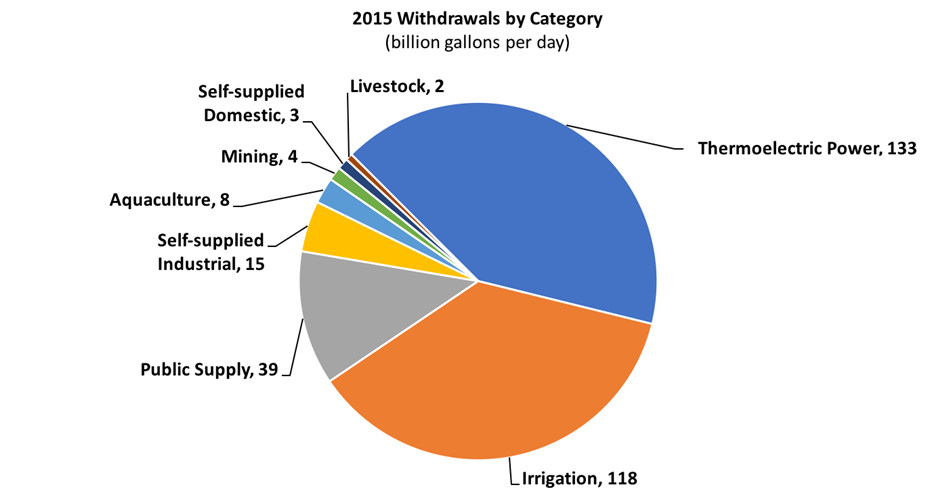
- Refer to Figure 8.9.
- In the United States, which two categories use the most water?
- What percentage of water is used for irrigation and livestock? Tip: Add the two values and then divide by the total amount of water withdrawals (322 million gallons) and then multiple by 100 to get the percentage. Show your calculation.
- What are some ways the United States could lower this percentage?
- What are some actions you could take to help lower this percentage?
Part B. Watersheds and Groundwater
A watershed is the area of land where all of the water that falls in it and drains off of it goes to a common outlet, such as a river, a lake, or the ocean (refer to Figure 8.10). Watersheds exist everywhere and everyone lives within a watershed. Notice in Figure 8.10 how elevation plays a role in where water drains. Gravity pulls water toward the center of the Earth, so the water at higher elevations will naturally drain to lower elevations. This means that all of the water that falls at the top of a watershed will flow over or seep into the ground downstream. Some of this water flows directly to the sea or a nearby water body, and some of it seeps into the ground. This water either flows underground or is stored in an aquifer.
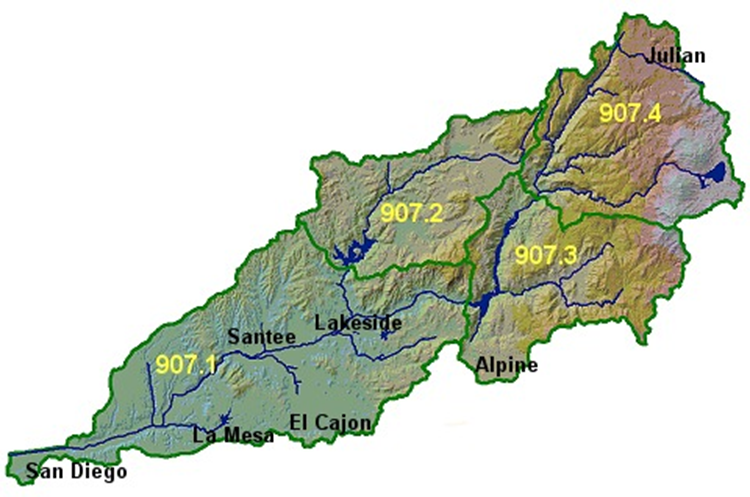
Watersheds are divided into hydrologic areas (HA) that are given distinct numbers (Figure 8.11). Each hydrologic area will contain unique land uses and habitats based on location, elevation, and climate. Because wildlife and people depend on water for survival, it is important that watersheds are monitored for water quality. If access to clean water is limited or unavailable, human and wildlife health can be severely compromised.
All components of the hydrologic cycle have an impact on water quality in a watershed. One of the key factors to water quality is runoff, which is determined by the relationship between precipitation and infiltration. Regardless of how much precipitation a watershed receives, the amount of water that infiltrates into the soil and how quickly this happens depends on soil type. Soil type is determined by several factors. In this lab, we will focus on two key factors: porosity and permeability. The size of soil particles and the space between them determines how much water can pass through and how quickly.
Porosity is the amount of water a substance, such as soil, can hold and is dependent upon the amount of space in the soil, known as pore space. The greater the pore space, the greater the porosity. Water will move quickly and more freely in soil like gravel, which has greater porosity. Water will move less quickly or not at all in soil like clay, which has less porosity. Porosity is usually stated as a percentage of a substance’s total volume.
Permeability is the ability of water to flow through soil. Permeability depends on how large the pore space in a soil is and how well the soil particles fit together. Figure 8.12 shows four sediment columns with different configurations of particle sizes that are either uniform, mixed, or sorted. Remember that aquifers are layers of permeable rock that store water underground. Watersheds that contain permeable rock layers underground will have more aquifers and therefore, are more likely to store more water underground. Some watersheds are able to store more groundwater than others. This is why it is important to understand what type of soil and rock lies below the surface in your watershed.
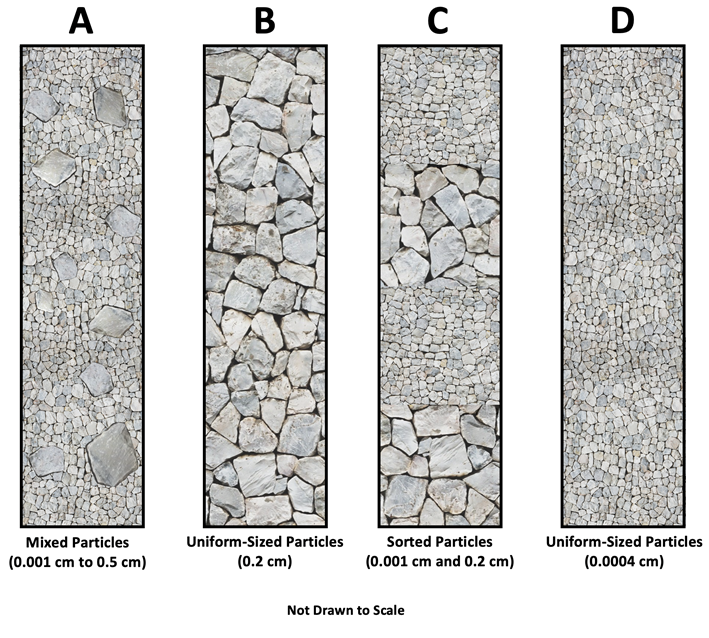
- Refer to Figure 8.12.
- Which column of soil would allow for the fastest infiltration rate? Explain your response in one to two sentences.
- Which column of soil might experience the most flooding during a downpour? Explain your response in one to two sentences.
- Which column of soil might be the best to use for planting tropical plants? Explain your response in one to two sentences.
- Apply What You Learned: In one to two sentences, explain the changes in porosity and permeability in areas where natural land use within a watershed has been removed and covered with hardscapes such as concrete or asphalt.
- Use Your Critical Thinking Skills: Taking these changes into consideration, how would infiltration and runoff change in this watershed when additional concrete or asphalt covers its surface?
Watershed Management and the Clean Water Act
Federal, state, and local jurisdictions manage, monitor, and regulate our water resources. A key piece of federal legislation is the Clean Water Act, which was enacted in 1972. This legislation accomplished the following:
➢ Established the basic structure for regulating pollutant discharges into the waters of the United States.
➢ Gave the Environmental Protection Agency (EPA) the authority to implement pollution control programs such as setting wastewater standards for industry.
➢ Maintained existing requirements to set water quality standards for all contaminants in surface waters.
➢ Made it unlawful for any person to discharge any pollutant from a point source into navigable waters, unless a permit was obtained under its provisions.
➢ Funded the construction of sewage treatment plants under the construction grants program.
➢ Recognized the need for planning to address the critical problems posed by nonpoint source pollution.[137]
Under the Clean Water Act and state law, California identifies more than 860 water quality monitoring variables, including chemical contaminants. Table 8.2 provides an overview of selected water quality indicators. Many of these variables have different thresholds, or limits to Determine when a water body is unhealthy, for both human health and aquatic life. When the water quality standards have been exceeded, a water body is designated as impaired.
| Indicator | Sources | Impact |
|---|---|---|
| Fecal Coliform and Enterococcus Bacteria | Sewage, farm animal waste, pet waste | Outbreaks of disease and illness in humans, cattle, chickens, pigs, and sheep |
| Plant Nutrients, including Nitrogen, Phosphorus, and Manganese | Application of fertilizers, sewage, vehicle exhaust, feedlots/farm manure | Prompts algal blooms that result in low levels of dissolved oxygen, which harms aquatic life |
| Metals and Metalloids including Lead, Mercury, and Selenium | Paints, automotive parts, brake pads, power plants | Can be harmful to human health, particularly during child development. Have been known to cause cancer, organ damage, nervous system damage, and death |
| Chloride | Sewage, application of inorganic fertilizers, animal feeds | Can increase the corrosivity of water |
| Sulfates | Sewage, discharges from industries such as tanneries, pulp mills, textile mills | May cause plumbing issues and can cause intestinal issues in mammals |
| pH | Carbon dioxide | Can change the acidity of the water, more acidic water prevents growth and development of shelled creatures and stony corals |
| Total Dissolved Solids | Wastewater treatment plants, agriculture, stormwater | Alter the flavor of drinking water, alter the color and clarity of freshwater sources |
- In your own words, what does it mean when a water body is impaired?
- Apply What You Learned: How would the hydrologic cycle influence the health of watersheds?
- Apply What You Learned: How would the physical characteristics of the watershed (such as tributaries and terrain) influence the health of a watershed?
- Use Your Critical Thinking Skills: Which of the water quality monitoring indicators shown in Table 8.2 do you have a direct impact on?
Case Study: San Diego River Watershed
The San Diego River watershed (Figure 8.11, above) is located in San Diego County, California. It is the second largest watershed in the county and receives minimal precipitation throughout the year. The San Diego River watershed is unique because it is one of the most biodiverse regions in the country. Because of its Mediterranean climate, a broad and diverse distribution of plant and animal species currently reside in this watershed. It is also home to five major reservoirs that provide potable (safe to drink) water to 760,000 residents in the area.
To learn more about the San Diego River watershed, you will explore information provided on the Project Clean Water website.
Step 1
 Go to the San Diego River Watershed webpage from Project Clean Water.
Step 2
Read the Overview section of the webpage.
- How many hydrologic units exist within this watershed and what are they called?
- Regarding development within the watershed:
- What percentage of the watershed is developed?
- What are the developed land uses and their percentages?
- What land uses are included in the “other” category?
Step 3
 Go to the Table of Contents and click on “8. Hydrologic Area (HA) Descriptions”.
Step 4
Read the information about the Lower San Diego HA (907.1).
- Describe what is shown in the photograph.
- What water bodies in this HA are listed as impaired under the Clean Water Act?
- What are the main pollutants in this HA?
- Of the pollutants listed for this HA, which ones are likely caused by human and animal waste? Tip: refer to Table 8.1.
- Where might these pollutants come from?
- Use Your Critical Thinking Skills: What are some ways that San Diego could manage this particular water quality issue?
Step 5
 Search the internet to learn about your watershed. You may want to use the How’s My Waterway? website from the Environmental Protection Agency.
- What is the name of the watershed where you live?
- Are there any water bodies that are listed as impaired under the Clean Water Act?
- What pollutants are found in your watershed?
- Use Your Critical Thinking Skills: What are some ways that you could help decrease pollutants in your watershed and in nearby watersheds? List at least three ideas.
Part C. Water Budgets
Earlier, you learned that nearly 120 billion gallons per day of water are used in the United States for agriculture and plant growth. In order to manage our water supply for food consumption, we need to understand; how much water enters a watershed; how water is processed in the watershed; how much water leaves the watershed; and how water leaves the watershed.
This information is provided in a water budget. A water budget calculates the total inputs and outputs of water in the watershed. Water budgets are useful because they help land managers and the agriculture industry to identify the frequency and duration of water needs for irrigation of crops and vegetation. Water budgets vary based on location, soil, climate, and land use distribution in the watershed. Each hydrologic area within a watershed requires a water budget and most water budgets are calculated monthly and analyzed over time, generally from year to year.
To calculate a water budget you need to know the factors that influence water movement in the system you are studying.
➢ Field capacity refers to the total amount of water a soil can hold. This is important because certain soils will not retain as much water as others. Soils with large particle sizes and coarse textures will not hold as much water as soils with smaller particle sizes and smoother textures. Remember that water also leaves the system so we must consider evaporation, including transpiration from plants!
➢ The maximum amount of water that could be lost to evapotranspiration is called potential evaporation (PE) and is primarily dependent upon the overall temperature of a region.
➢ The amount of water that is actually lost to evapotranspiration is called actual evapotranspiration (AE). Precipitation is the amount of water that enters the watershed from the sky and will determine AE. If precipitation increases in a system with a low PE, then more water is available than can be lost through evapotranspiration. If precipitation decreases in a system, there is less water available for evapotranspiration and the system experiences a water deficit.
At the end of a month, once AE and PE are known, the amount of water remaining in the soil shows how much water the soil retains over time. During a heavy or unpredicted rain event, precipitation could be greater than potential evaporation, and water is then added to the system. This is usually beneficial because the system experiences a water surplus (S). The opposite occurs during a dry season or a drought. When precipitation is less than potential evaporation, water is removed from the system and the system experiences a water deficit (D). Agriculture is often negatively impacted by systems that experience prolonged water deficits.
Below are water budgets for two cities in California: Eureka located in Northern California and San Diego located in Southern California. The goal of this exercise is to plot and analyze the water budget data in order to understand how water moves through the hydrologic cycle in two different watersheds.
Table 8.3 provides water budget data for sandy loam soil in Eureka, California. This soil type has a field capacity of 3.5 inches and the total annual precipitation is 34.22 inches.
| Variable | Jan | Fed | Mar | Apr | May | Jun | Jul | Aug | Sep | Oct | Nov | Dec |
|---|---|---|---|---|---|---|---|---|---|---|---|---|
| P | 4.85 | 4.60 | 3.90 | 2.60 | 2.00 | 1.75 | 1.22 | 1.00 | 1.60 | 3.30 | 3.80 | 3.60 |
| PE | 0.50 | 0.50 | 1.00 | 1.50 | 1.90 | 2.75 | 3.30 | 3.50 | 3.60 | 1.75 | 1.30 | 0.45 |
| AE | 0.50 | .50 | 1.00 | 1.50 | 1.90 | 3.00 | 3.12 | 2.90 | 2.80 | 1.75 | 1.30 | 0.45 |
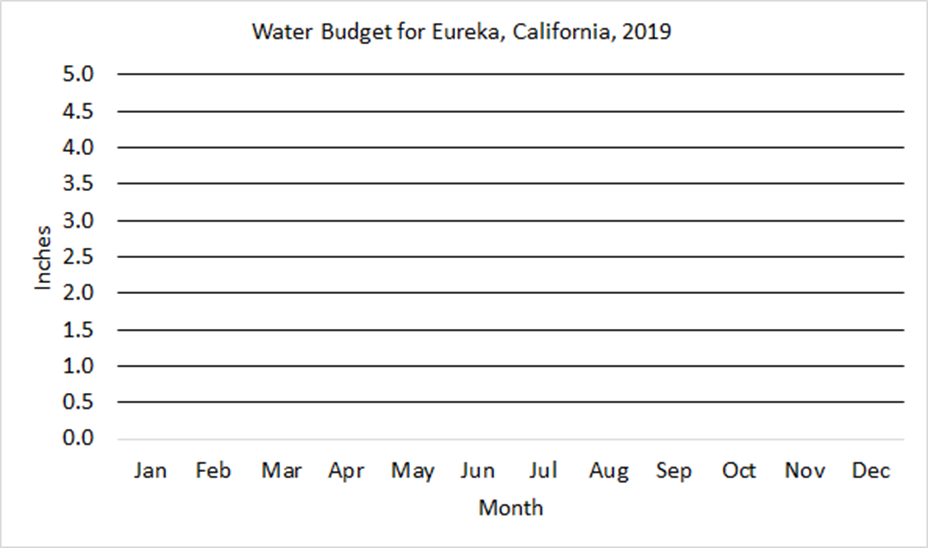
- Refer to Figure 8.13.
- During which months is actual evaporation (AE) less than potential evaporation (PE)?
- During these months is there a water surplus or a water deficit?
- Shade this area red.
- During which months is precipitation (P) greater than actual evaporation (AE) and potential evaporation (PE)?
- During these months is there a water surplus or a water deficit?
- Shade this area blue.
- Which months of the year would industries that rely on local groundwater supplies for agricultural needs have to plan ahead?
Now let’s analyze a water budget for San Diego in Southern California. Table 8.4 provides water budget data for silty clay loam soil in San Diego. This soil type has a field capacity of 2.2 inches and the total annual precipitation is 10.39 inches.
| Variable | Jan | Feb | Mar | Apr | May | Jun | Jul | Aug | Sep | Oct | Nov | Dec |
|---|---|---|---|---|---|---|---|---|---|---|---|---|
| P | 2.26 | 1.83 | 2.15 | 0.78 | 0.20 | 0.08 | 0.04 | 0.04 | 0.20 | 0.35 | 1.13 | 1.33 |
| PE | 1.37 | 1.60 | 1.79 | 2.26 | 2.81 | 3.39 | 4.06 | 4.21 | 3.71 | 2.81 | 0.91 | 1.37 |
| AE | 1.76 | 1.33 | 1.79 | 0.78 | 0.20 | 0.08 | 0.04 | 0.04 | 0.20 | 0.35 | 1.13 | 1.33 |
- Create a plot on the graph below (Figure 8.14) using the P, PE, and AE data for all 12 months of data from Table 8.4. Use a blue pencil for P, a green pencil for PE, and red pencil for AE. Make sure you connect the points for each of the three variables (you should have three lines on your graph). Also, create a legend by your plot.
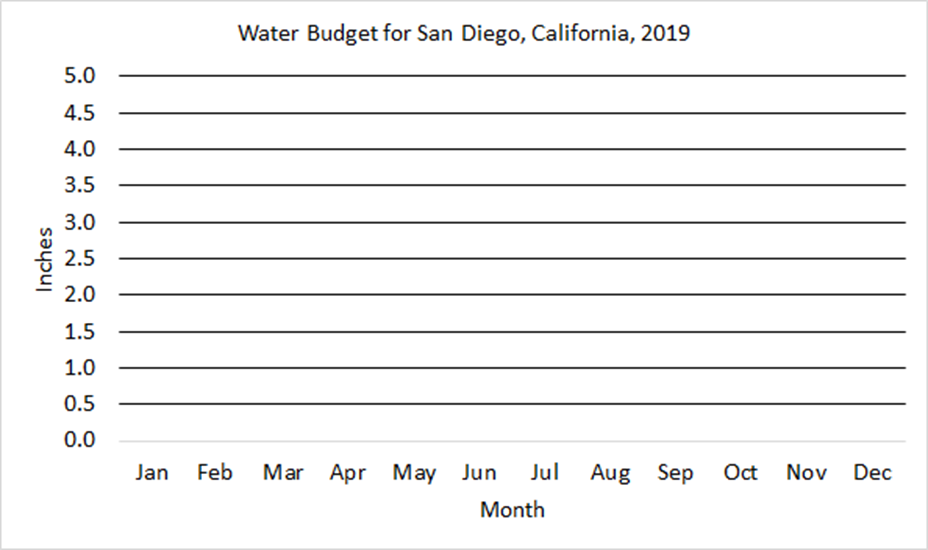
- Refer to Figure 8.14.
- During which months is actual evaporation (AE) less than potential evaporation (PE)?
- During these months is there a water surplus or a water deficit?
- Shade this area red.
- During which months is precipitation (P) greater than actual evaporation (AE) and potential evaporation (PE)?
- During these months is there a water surplus or a water deficit?
- Shade this area blue.
- Which months of the year would industries that rely on local groundwater supplies for agricultural needs have to plan for ahead of time?
- Review Figures 8.13 and 8.14. What are three key differences between the water budgets for Eureka and San Diego?
- Apply What You Learned: Why doesn’t a water budget include data about a location’s groundwater supplies?
- Use Your Critical Thinking Skills: As global temperatures continue to increase over the next several decades, what are some potential problems agricultural industries could face in regards to water supplies?
- Use Your Critical Thinking Skills: What are some actions people could take locally and globally to prevent the negative impacts of water deficits?
One difference between Eureka and San Diego is the amount of annual precipitation for each city in 2019: 34.22 inches and 10.39 inches, respectively. If water supply to residents depends on local water supplies, then cities with large populations would need to have larger amounts of surface water and groundwater available for drinking, sanitation, and irrigation. The population of Eureka is 26,998 people and the population of San Diego is 1,426,000 people.
- How many times larger is San Diego’s population compared to Eureka’s? Show your work.
- What percentage of Eureka’s precipitation did San Diego receive in 2019? Show your work.
Many cities in California don’t rely on local water supplies to support their populations. In San Diego, 85% of its water supplies come from outside the local area. Figure 8.15 shows the major surface water features and water infrastructure in California, along with whether a region is a net importer or exporter of water.
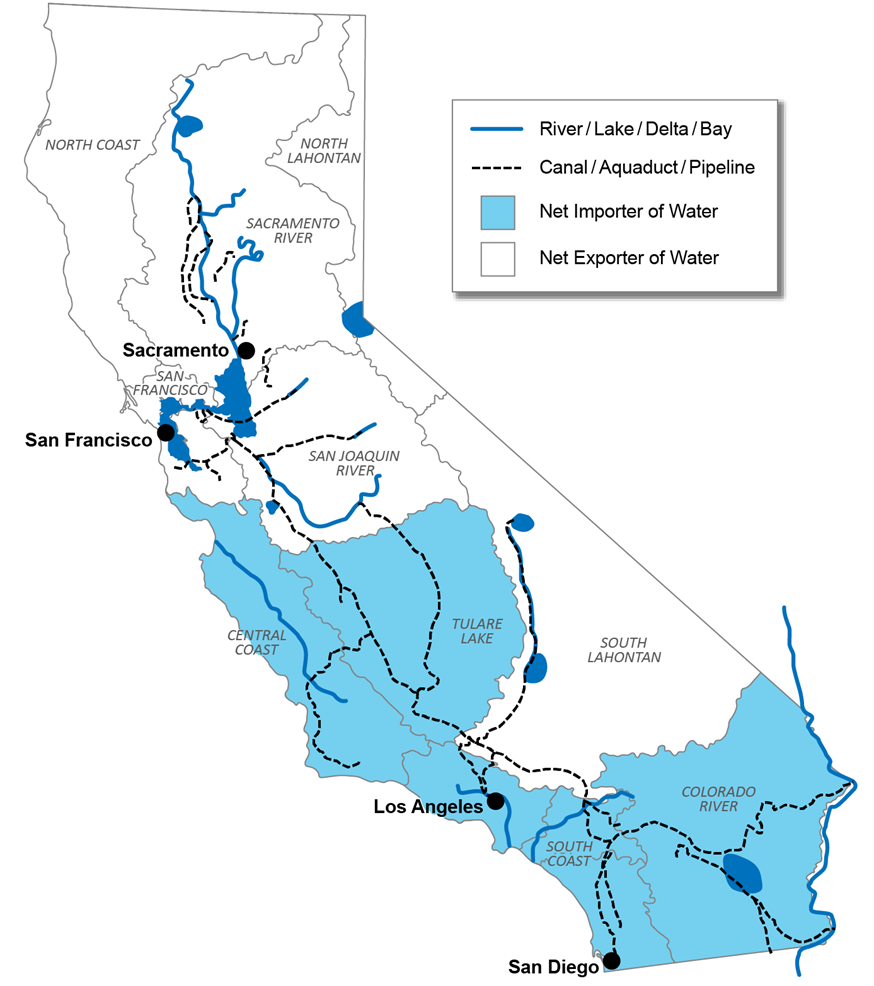
- Refer to Figure 8.15.
- Label the major water bodies shown on the map. From North to South:
- Shasta Lake
- Lake Tahoe (one eastern border with Nevada)
- California Delta (also known as the Sacramento-San Joaquin Delta)
- San Francisco Bay (to the west of the California Delta)
- San Luis Reservoir (in the San Joaquin River region)
- Mono Lake (in the northern part of South Lahontan region)
- Owens Lake (in the southern part of South Lahontan region)
- Salton Sea
- Is Eureka in a net exporting or net importing region?
- Is your location a net importer or net exporter of water?
- What are two conclusions that can be drawn from the information shown on the map?
- Use Your Critical Thinking Skills: Why is it important to analyze water resources at different scales (e.g., watershed, water region, state, country)? Explain your response in one to two sentences.
 Check It Out! California’s Water Policies and Infrastructure
Learn more about California’s water polices and infrastructure from the Managing California’s Water: From Conflict to Reconciliation report by the Public Policy Institute of California. (This links to a downloadable pdf file).
Part D. Wrap-Up
Consult with your geography lab instructor to find out which of the following wrap-up questions you should complete. Attach additional pages to answer the questions as needed.
- What is the most important idea that you learned in this lab? In two to three sentences, explain the concept and why it is important to know.
- What was the most challenging part of this lab? In two to three sentences, explain why it was challenging. If nothing challenged you in the lab, write about what you think challenged your classmates.
- What is one question that you have about what you learned in this lab? Write your question along with one to two sentences explaining why you think your question is important to ask.
- Review the learning objectives on page 1 of this lab. How would you rate your understanding or ability for each learning objective? Write one sentence that addresses each learning objective.
- Sketch a concept map that includes the key ideas from this lab. Include at least five of the terms shown in bold-faced type.
- Create an advertisement to educate your peers on the important information that you learned in this lab. Include at least three key terms in your advertisement. The advertisement should be about half a page in size (about 4 inches by 6 inches).
- One way to think of physical geography is that it is the study of the relationships among variables that impact the Earth's surface. Select two variables discussed in this lab and describe how they are related.
- How does what you learned in this lab relate to your everyday life? In two to three sentences, explain a concept that you learned in this lab and how it relates to your day-to-day actions.
- How does what you learned in this lab relate to current events?
- Write the title, source, and date of a news item that relates to this lab.
- In two to three sentences, discuss how the news item relates to what you have learned in this lab.
- In one to two sentences, discuss whether or not the news item accurately represents the science that you learned. Tip: consider whether or not the news item includes the complexity of the topic.
- Search O*NET OnLine to find an occupation that is relevant to the topics presented in today's lab. Your lab instructor may provide you with possible keywords to type in the Occupation Quick Search field on the O*NET website.
- What is the name of occupation that you found?
- Write two to three sentences that summarize the most important information that you learned about this occupation.
- What is one question that you would want to ask a person with this occupation?
[122] Text adapted from USGS
[130] Text and data from Worldmapper is licensed under CC BY-NC-SA 4.0
[137] Text from the Environmental Protection Agency (EPA)