
1.7: Lab 7 - Cyclones
- Page ID
- 25331
\( \newcommand{\vecs}[1]{\overset { \scriptstyle \rightharpoonup} {\mathbf{#1}} } \)
\( \newcommand{\vecd}[1]{\overset{-\!-\!\rightharpoonup}{\vphantom{a}\smash {#1}}} \)
\( \newcommand{\id}{\mathrm{id}}\) \( \newcommand{\Span}{\mathrm{span}}\)
( \newcommand{\kernel}{\mathrm{null}\,}\) \( \newcommand{\range}{\mathrm{range}\,}\)
\( \newcommand{\RealPart}{\mathrm{Re}}\) \( \newcommand{\ImaginaryPart}{\mathrm{Im}}\)
\( \newcommand{\Argument}{\mathrm{Arg}}\) \( \newcommand{\norm}[1]{\| #1 \|}\)
\( \newcommand{\inner}[2]{\langle #1, #2 \rangle}\)
\( \newcommand{\Span}{\mathrm{span}}\)
\( \newcommand{\id}{\mathrm{id}}\)
\( \newcommand{\Span}{\mathrm{span}}\)
\( \newcommand{\kernel}{\mathrm{null}\,}\)
\( \newcommand{\range}{\mathrm{range}\,}\)
\( \newcommand{\RealPart}{\mathrm{Re}}\)
\( \newcommand{\ImaginaryPart}{\mathrm{Im}}\)
\( \newcommand{\Argument}{\mathrm{Arg}}\)
\( \newcommand{\norm}[1]{\| #1 \|}\)
\( \newcommand{\inner}[2]{\langle #1, #2 \rangle}\)
\( \newcommand{\Span}{\mathrm{span}}\) \( \newcommand{\AA}{\unicode[.8,0]{x212B}}\)
\( \newcommand{\vectorA}[1]{\vec{#1}} % arrow\)
\( \newcommand{\vectorAt}[1]{\vec{\text{#1}}} % arrow\)
\( \newcommand{\vectorB}[1]{\overset { \scriptstyle \rightharpoonup} {\mathbf{#1}} } \)
\( \newcommand{\vectorC}[1]{\textbf{#1}} \)
\( \newcommand{\vectorD}[1]{\overrightarrow{#1}} \)
\( \newcommand{\vectorDt}[1]{\overrightarrow{\text{#1}}} \)
\( \newcommand{\vectE}[1]{\overset{-\!-\!\rightharpoonup}{\vphantom{a}\smash{\mathbf {#1}}}} \)
\( \newcommand{\vecs}[1]{\overset { \scriptstyle \rightharpoonup} {\mathbf{#1}} } \)
\( \newcommand{\vecd}[1]{\overset{-\!-\!\rightharpoonup}{\vphantom{a}\smash {#1}}} \)
- Identify the major types of air masses and the air masses that influence North America.
- Differentiate between cold and warm fronts.
- Describe the progression of a midlatitude cyclone.
- Identify the conditions that lead to tropical cyclones.
- Analyze the track of a hurricane.
Introduction
In the previous lab, you learned about humidity in the air and what happens to humidity as the temperature cools. You were introduced to the four main lifting mechanisms (orographic, convergent, convective, and frontal) that cause air to be forced upwards and cool. In this lab you will expand your knowledge of these processes by exploring the development of storm systems, called cyclones. Cyclones are low pressure systems and in this lab you will learn about two very distinct types of cyclones: midlatitude cyclones and tropical cyclones. The lab begins with an investigation of air masses, which will help you to understand how midlatitude cyclones form.
Part A. Air Masses
Air masses have specific and distinct characteristics from the atmosphere that surrounds them. This is specifically true in relation to their humidity and their temperature. Meteorologists have developed a type of coding to identify the overall humidity and temperature. This closely relates to their source region. Continental (c) air masses form over land masses. Maritime (m) air masses form over water bodies. Air masses that form in polar regions are designated with a P and air masses that form in tropical regions are designated with a T.
- What would the general temperature and humidity conditions be for the following types of air masses?
- cP:
- mP:
- mT:
- Refer to Figure 7.1, which shows the source region and direction of most of the air masses that influence the weather conditions of North America.
- Label each of the air masses (cP; cT; mP; or mT).

- What two major air masses influence the weather of California?
- Which air masses have the greatest impact on weather along the central part of the United States?
 Pin It! Air Masses
You will notice in Figure 7.1 that colder air masses (in the Northern hemisphere) are to the north while warmer air masses are towards the south. The line between these air masses is always present, although the line will move further north in the summer and further south in the winter. It is along this boundary line that you will find frontal lifting and midlatitude cyclones.
Part B. Fronts and Frontal Lifting
The place where two different air masses make contact is referred to as a front. In the previous lab, frontal lifting was identified as one of the lifting mechanisms. Although they are in contact, air masses often will retain their individual characteristics. There are several standardized methods for symbolizing different fronts. When the two air masses are next to each other, but are not moving, this is referred to as a stationary front. The symbol that would be found on a meteorology map includes the line of contact with blue triangles radiating from one side (representing the cold air mass) and red half-circles radiating from the other side (representing the warm air mass) as illustrated in Figure 7.2.

If either air mass begins to move, it is referred to as a cold front (if the cold air mass is advancing) or a warm front (if the warm air mass is advancing). Cold fronts are drawn as a line with blue triangles indicating the direction of movement of the front, as illustrated in Figure 7.3.

Warm fronts are symbolized as a line with red half-circles radiating in the direction that the front is moving, as illustrated in Figure 7.4.

- Based on the diagram of air masses in Figure 7.1, where would you most likely see these fronts developing in the United States?
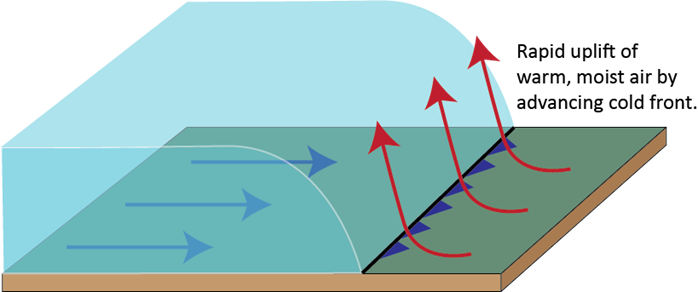
It is important to remember that warm air is typically less dense than cold air. Thus, when they are forced towards each other, in either a warm or a cold front, the cold, usually dry, dense air will remain at the surface and the warm, humid air will rise. That rising humid air cools as it rises, condensation occurs, and clouds form, which may lead to precipitation.
The speed and severity of rising will vary based on the presence of a cold front (Figure 7.5) or a warm front (Figure 7.6).

- Compare Figures 7.5 and 7.6.
- Along a _____________ front you will find the warm, humid air rapidly being forced up, leading to more severe storms.
- Along a _____________ front, the warm, humid air more gradually slides up and over the cooler, more dense air mass, leading to mild storms.
The collision of very cold air and warm, humid air can generate very significant storm systems, specifically in cold fronts. Based on data from 1982 to 2011, the National Weather Service’s Storm Prediction Center mapped tornado probabilities for the date of May 13 (Figure 7.7). Probabilities of 80% or more closely match the location of Tornado Alley, which consistently experiences a high frequency of tornadoes every year.

- Refer to Figure 7.7.
- In one sentence, describe the location of Tornado Alley.
- Refer back to Figure 7.1 (shown earlier in the lab). What influence do you think the colliding air masses have on the high probability of tornadoes occurring in Tornado Alley? Explain your response in one to two sentences.
- Use Your Critical Thinking Skills: Why do you think California has so few tornadoes? Explain your response in one to two sentences.
Part C. Midlatitude Cyclonic Storm Progression
As you discovered above, two opposing air masses meet at the midlatitudes. Although this line of contact will migrate north or south based on the season, it is along this contact line where we see storms developing. The description below will discuss and diagram the storm progression of a typical midlatitude cyclone in the northern hemisphere.
Stage 1: Stationary Front
While cold air from the north and warm, humid air from the south are in contact, there is not always a storm raging! At times, the two fronts are simply in contact. This is referred to as a stationary front. You will note in Figure 7.8 that north of the line is dominated by continental polar air and that south of the line is dominated by maritime tropical air.

- How would the air pressure differ between the north side of a stationary front versus the south side of the same front? Explain your response in one to two sentences.
- Storms typically include cloud formation and precipitation. Which air mass contains the greater amount of humidity?
Stage 2: Cyclogenesis
A storm begins when there is a slight instability along the line. Instability, in this case, refers to a lift, or rise in the air. This creates a low pressure system.
Recall from a previous lab that the Coriolis effect is the apparent deflection of winds due to Earth’s rotation. As winds move over the Earth’s surface, winds are deflected to the right in the northern hemisphere (clockwise) and to the left in the southern hemisphere (counterclockwise). At the surface, this causes winds to move out of an anticyclone in a clockwise direction in the northern hemisphere.
- In the northern hemisphere, would the Coriolis effect cause surface-level winds to move into a low pressure system in a clockwise or counterclockwise direction?
The diagram below (Figure 7.9) illustrates the initial formation of a midlatitude cyclonic storm. This stage is referred to as cyclogenesis.
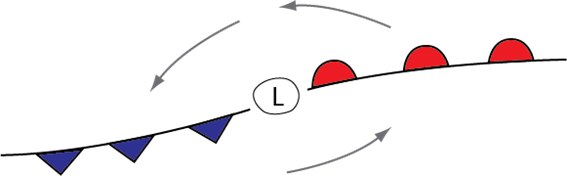
Typically across North America these initial low pressure systems move from west to east due to the prevailing westerlies. In California, many of the storm systems develop off the Pacific coast and move inland. You will note from Figure 7.9 (above) that as the rotation within the system begins, there is the development of a cold front and warm front. Although these diagrams illustrate the movement of these fronts from a top-down perspective, keep in mind the lifting and movement of air because of these two fronts, as discussed in the previous section.
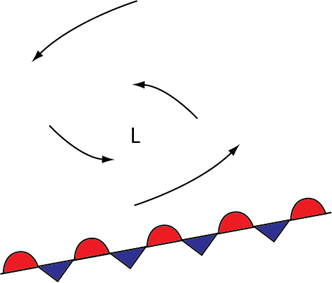
Stage 3: Open Stage
While the entire rotation and low pressure system moves from west to east, the fronts are also moving, pushing, and forcing their respective air masses around. Cold fronts typically will move faster than warm fronts. You will note in Figure 7.10 that the low pressure system has developed even stronger and that the cold front has moved further south in its rotation around the low pressure center.

- Cold fronts typically move faster than warm fronts. If the cold front rotates faster around the central low pressure, what would you expect to happen to the two different fronts? Explain your response in one to two sentences.
Stage 4: Occluded Front
Eventually, the cold front does catch up to the warm front. That line is referred to an occluded front and is symbolized with the triangles and half circles facing the same direction. This is illustrated in Figure 7.11.

Remember that the initial creation of the storm began with the development of a low pressure system. In the occluded stage, the low pressure system has been pinched off and is now surrounded by continental polar (cold and dry) air. You may recall that colder air, with its higher density, tends to have a higher surface pressure. This leads to the final, dissolving stage of the storm system.
Stage 5: Dissipating Stage
With the low pressure isolated to the north, the storm system may pull in surrounding air, but that air is cold, dry, and dense. The more dense air will cause the low pressure system to dissipate or die out, as illustrated in Figure 7.12.
Although the storm is practically over, you will note the stationary front has developed once again. This provides the setting for this whole storm development process to start once more.
- Review the five stages of midlatitude cyclones.
- List the initial conditions needed to cause a midlatitude cyclone to form:
- List the ending conditions that cause a midlatitude cyclone to dissipate:
Part D. Tropical Cyclones
You previously learned about several lifting mechanisms:
➢ You examined the change in temperature and humidity as an air mass is lifted over a mountain during orographic lifting.
➢ In Part B of this lab you learned about the process of frontal lifting.
In this section of the lab, you will learn about storm development in the warmer, tropical areas. These are extraordinary examples of convectional lifting.
While they are only found over warm waters, tropical cyclones are found in many different regions. In the United States, we are primarily impacted by tropical cyclones in the Atlantic Ocean and Gulf of Mexico. These are called hurricanes. Around the globe, you will find tropical cyclones referred to as tropical cyclones in Southeast Asia, willy willies in Australia, and typhoons in the western Pacific.
Figure 7.13 is an ocean circulation map that shows warm currents in red arrows.

- Based on the temperature of the ocean currents off the Pacific and Atlantic coasts (Figure 7.13), why do we find much greater tropical storm development in the Atlantic Ocean influencing the United States? Why don’t we see many in California? Explain your responses in two to three sentences.
If you have spent much time in Florida or in other warm, humid tropical areas, you are aware of what real humidity is like. When a low pressure system develops over tropical waters, the warm air begins to rise and cool by expansion. Once the dew point temperature is reached, the vast amount of water vapor begins to condense. This releases a huge amount of latent heat. That latent heat causes additional lift, strengthening the low pressure system. The Coriolis effect causes rotational spin. Tropical cyclones depend on access to the tropical ocean and the vast amount of humidity in their overlying air. Once these systems move over land, they typically weaken. However, these have been some of the most destructive storms along the coastal regions of the southeast United States.
Tropical cyclones are categorized based on the wind speeds found in those storms using the Saffir-Simpson Hurricane Severity Scale (Table 7.1). Beginning on June 1st of each year, the annual storm season begins. Each tropical storm is given a name, beginning with the letter A; each subsequent storm is given a name beginning with subsequent letters in the alphabet. For example, in 2019, the storms over the Atlantic were named Andrea then Barry, followed by Chantal, Dorian, Erin and so forth. Each storm basin (tropical waters in the Atlantic Ocean, Pacific Ocean, etc.) has their own sequence of storm names.
| Tropical Cyclone Classification | Wind Speed in meters per second (m/s) | Wind Speed in knots (kn) | Wind Speed in miles per hour (mph) | Wind Speed in kilometers per hour (km/h) |
|---|---|---|---|---|
| Hurricane Category 5 | ≥ 70 m/s | ≥ 137 kn | ≥ 157 mph | ≥ 252 km/h |
| Hurricane Category 4 | 58–70 m/s | 113–136 kn | 130–156 mph | 209–251 km/h |
| Hurricane Category 3 | 50–58 m/s | 96–112 kn | 111–129 mph | 178–208 km/h |
| Hurricane Category 2 | 43–49 m/s | 83–95 kn | 96–110 mph | 154–177 km/h |
| Hurricane Category 1 | 33–42 m/s | 64–82 kn | 74–95 mph | 119–153 km/h |
| Tropical Storm | 18–32 m/s | 34–63 kn | 39–73 mph | 63–118 km/h |
| Tropical Depression | ≤ 17 m/s | ≤ 33 kn | ≤ 38 mph | ≤ 62 km/h |
Hurricane Paths
If you mention hurricanes to most Americans, the one that comes to mind is Hurricane Katrina. This was a very severe storm in 2005 that especially devastated New Orleans. Because of their local geography, a significant portion of the city was inundated with water. The suffering of the people as portrayed through the media was striking and unforgettable. The storm brought to light the need for communities throughout the U.S. to be prepared for natural disasters.
In Table 7.2 below, you will find a series of readings from Hurricane Katrina.
- Complete Table 7.2 by determining the storm category (the far-right column) based on the wind speed by referencing Table 7.1 above.
| Date | Time | Approx. Degrees North | Approx. Degrees West | Pressure (mb) | Wind Speed (knots) | Category |
|---|---|---|---|---|---|---|
| Aug 23, 2005 | 1800 | 23 | 75 | 1008 | 30 | |
| Aug 24, 2005 | 1800 | 25 | 77 | 1003 | 40 | |
| Aug 25, 2005 | 1800 | 26 | 80 | 988 | 60 | |
| Aug 26, 2005 | 1800 | 25 | 83 | 968 | 85 | |
| Aug 27, 2005 | 1800 | 25 | 85 | 948 | 100 | |
| Aug 28, 2005 | 1800 | 26 | 89 | 902 | 150 | |
| Aug 29, 2005 | 1800 | 31 | 90 | 948 | 80 | |
| Aug 30, 2005 | 1800 | 37 | 87 | 990 | 30 | |
| Aug 31, 2005 | 600 | 40 | 83 | 996 | 25 |
- Refer to Table 7.2. What relationship do you notice between pressure and wind speed?
- Based on the provided coordinates in Table 7.2, plot the daily location of Hurricane Katrina on the map provided below (Figure 7.14). Using colored pencils, code each point according to the category of storm. Create a legend in the space below that shows the color used for each storm category. With a black line, connect each of the points to mark the storm's trajectory.

- Compare the direction of travel of the storm between the 23rd to the 26th with the projection of the storm between the 27th to 30th. List the differences that you notice.
- Did the storm travel the same speed each day? What trends in storm speed do you see? Explain your response in two to three sentences.
Another tropical storm which had a significant impact on Houston and the surrounding areas was Hurricane Harvey in 2017. As you will note in the mapping exercise below, it stayed in that region for multiple days. At times, it seemed to repeat the pattern of coming inland to rain, going back over the warm waters to recharge, and coming back in once again with more rain. Some areas received more than 40 inches of rain within those few days.
In Table 7.3 below, you will find a series of readings from Hurricane Harvey.
- Complete the far-right column of Table 7.3 by determining the storm category based on the wind speed. You should refer to the Saffir-Simpson Hurricane Severity Scale (Table 7.1, shown above) to complete the Category column.
| Date | Time | Approx. Degrees North | Approx. Degrees West | Pressure (mb) | Wind Speed (knots) | Category |
|---|---|---|---|---|---|---|
| Aug 16, 2017 | 1200 | 14 | 47 | 1010 | 25 | |
| Aug 17, 2017 | 1200 | 13 | 53 | 1008 | 30 | |
| Aug 18, 2017 | 1200 | 13 | 60 | 1004 | 40 | |
| Aug 19, 2017 | 1200 | 14 | 68 | 1006 | 30 | |
| Aug 20, 2017 | 1200 | 14 | 75 | 1006 | 30 | |
| Aug 21, 2017 | 1200 | 16 | 83 | 1008 | 25 | |
| Aug 22, 2017 | 1200 | 19 | 89 | 1010 | 25 | |
| Aug 23, 2017 | 1200 | 21 | 92 | 1006 | 30 | |
| Aug 24, 2017 | 1200 | 24 | 93 | 986 | 60 | |
| Aug 25, 2017 | 1200 | 26 | 96 | 949 | 95 | |
| Aug 26, 2017 | 1200 | 29 | 97 | 978 | 65 | |
| Aug 27, 2017 | 1200 | 29 | 97 | 998 | 35 | |
| Aug 28, 2017 | 1200 | 29 | 96 | 997 | 40 | |
| Aug 29, 2017 | 1200 | 28 | 96 | 995 | 40 | |
| Aug 30, 2017 | 1200 | 30 | 93 | 992 | 40 | |
| Aug 31, 2017 | 1200 | 32 | 92 | 1001 | 20 | |
| Sep 1, 2017 | 1200 | 36 | 87 | 1002 | 25 | |
| Sep 2, 2017 | 1200 | 38 | 85 | 1013 | 15 |
- Based on the provided coordinates in Table 7.3, plot the daily location of Hurricane Harvey on the map provided below (Figure 7.15). Using colored pencils, code each point according to the category of storm. Use the same colors as you did for question 14 (Figure 7.14) and add a legend to the map. With a black line, connect each of the points to mark the storm's trajectory.

- Comparing your two maps (Figures 7.14 and 7.15), how does the storm path of Hurricane Harvey differ from Hurricane Katrina? How does the speed compare between the two storms? List the differences that you notice.
- Do you observe any other differences or similarities between these two storms? Explain your response in two to three sentences.
 Check It Out! Explore Other Hurricanes
The National Oceanic and Atmospheric Agency (NOAA) has provided an online tool to discover and explore hurricanes.
Part E. Wrap-Up
Consult with your geography lab instructor to find out which of the following wrap-up questions you should complete. Attach additional pages to answer the questions as needed.
- What is the most important idea that you learned in this lab? In two to three sentences, explain the concept and why it is important to know.
- What was the most challenging part of this lab? In two to three sentences, explain why it was challenging. If nothing challenged you in the lab, write about what you think challenged your classmates.
- What is one question that you have about what you learned in this lab? Write your question along with one to two sentences explaining why you think your question is important to ask.
- Review the learning objectives on page 1 of this lab. How would you rate your understanding or ability for each learning objective? Write one sentence that addresses each learning objective.
- Sketch a concept map that includes the key ideas from this lab. Include at least five of the terms shown in bold-faced type.
- Create an advertisement to educate your peers on the important information that you learned in this lab. Include at least three key terms in your advertisement. The advertisement should be about half a page in size (about 4 inches by 6 inches).
- One way to think of physical geography is that it is the study of the relationships among variables that impact the Earth's surface. Select two variables discussed in this lab and describe how they are related.
- How does what you learned in this lab relate to your everyday life? In two to three sentences, explain a concept that you learned in this lab and how it relates to your day-to-day actions.
- How does what you learned in this lab relate to current events?
- Write the title, source, and date of a news item that relates to this lab.
- In two to three sentences, discuss how the news item relates to what you have learned in this lab.
- In one to two sentences, discuss whether or not the news item accurately represents the science that you learned. Tip: consider whether or not the news item includes the complexity of the topic.
- Search O*NET OnLine to find an occupation that is relevant to the topics presented in today's lab. Your lab instructor may provide you with possible keywords to type in the Occupation Quick Search field on the O*NET website.
- What is the name of occupation that you found?
- Write two to three sentences that summarize the most important information that you learned about this occupation.
- What is one question that you would want to ask a person with this occupation?