
8.7: Measuring Earthquakes
- Page ID
- 28270

\( \newcommand{\vecs}[1]{\overset { \scriptstyle \rightharpoonup} {\mathbf{#1}} } \)
\( \newcommand{\vecd}[1]{\overset{-\!-\!\rightharpoonup}{\vphantom{a}\smash {#1}}} \)
\( \newcommand{\id}{\mathrm{id}}\) \( \newcommand{\Span}{\mathrm{span}}\)
( \newcommand{\kernel}{\mathrm{null}\,}\) \( \newcommand{\range}{\mathrm{range}\,}\)
\( \newcommand{\RealPart}{\mathrm{Re}}\) \( \newcommand{\ImaginaryPart}{\mathrm{Im}}\)
\( \newcommand{\Argument}{\mathrm{Arg}}\) \( \newcommand{\norm}[1]{\| #1 \|}\)
\( \newcommand{\inner}[2]{\langle #1, #2 \rangle}\)
\( \newcommand{\Span}{\mathrm{span}}\)
\( \newcommand{\id}{\mathrm{id}}\)
\( \newcommand{\Span}{\mathrm{span}}\)
\( \newcommand{\kernel}{\mathrm{null}\,}\)
\( \newcommand{\range}{\mathrm{range}\,}\)
\( \newcommand{\RealPart}{\mathrm{Re}}\)
\( \newcommand{\ImaginaryPart}{\mathrm{Im}}\)
\( \newcommand{\Argument}{\mathrm{Arg}}\)
\( \newcommand{\norm}[1]{\| #1 \|}\)
\( \newcommand{\inner}[2]{\langle #1, #2 \rangle}\)
\( \newcommand{\Span}{\mathrm{span}}\) \( \newcommand{\AA}{\unicode[.8,0]{x212B}}\)
\( \newcommand{\vectorA}[1]{\vec{#1}} % arrow\)
\( \newcommand{\vectorAt}[1]{\vec{\text{#1}}} % arrow\)
\( \newcommand{\vectorB}[1]{\overset { \scriptstyle \rightharpoonup} {\mathbf{#1}} } \)
\( \newcommand{\vectorC}[1]{\textbf{#1}} \)
\( \newcommand{\vectorD}[1]{\overrightarrow{#1}} \)
\( \newcommand{\vectorDt}[1]{\overrightarrow{\text{#1}}} \)
\( \newcommand{\vectE}[1]{\overset{-\!-\!\rightharpoonup}{\vphantom{a}\smash{\mathbf {#1}}}} \)
\( \newcommand{\vecs}[1]{\overset { \scriptstyle \rightharpoonup} {\mathbf{#1}} } \)
\( \newcommand{\vecd}[1]{\overset{-\!-\!\rightharpoonup}{\vphantom{a}\smash {#1}}} \)
\(\newcommand{\avec}{\mathbf a}\) \(\newcommand{\bvec}{\mathbf b}\) \(\newcommand{\cvec}{\mathbf c}\) \(\newcommand{\dvec}{\mathbf d}\) \(\newcommand{\dtil}{\widetilde{\mathbf d}}\) \(\newcommand{\evec}{\mathbf e}\) \(\newcommand{\fvec}{\mathbf f}\) \(\newcommand{\nvec}{\mathbf n}\) \(\newcommand{\pvec}{\mathbf p}\) \(\newcommand{\qvec}{\mathbf q}\) \(\newcommand{\svec}{\mathbf s}\) \(\newcommand{\tvec}{\mathbf t}\) \(\newcommand{\uvec}{\mathbf u}\) \(\newcommand{\vvec}{\mathbf v}\) \(\newcommand{\wvec}{\mathbf w}\) \(\newcommand{\xvec}{\mathbf x}\) \(\newcommand{\yvec}{\mathbf y}\) \(\newcommand{\zvec}{\mathbf z}\) \(\newcommand{\rvec}{\mathbf r}\) \(\newcommand{\mvec}{\mathbf m}\) \(\newcommand{\zerovec}{\mathbf 0}\) \(\newcommand{\onevec}{\mathbf 1}\) \(\newcommand{\real}{\mathbb R}\) \(\newcommand{\twovec}[2]{\left[\begin{array}{r}#1 \\ #2 \end{array}\right]}\) \(\newcommand{\ctwovec}[2]{\left[\begin{array}{c}#1 \\ #2 \end{array}\right]}\) \(\newcommand{\threevec}[3]{\left[\begin{array}{r}#1 \\ #2 \\ #3 \end{array}\right]}\) \(\newcommand{\cthreevec}[3]{\left[\begin{array}{c}#1 \\ #2 \\ #3 \end{array}\right]}\) \(\newcommand{\fourvec}[4]{\left[\begin{array}{r}#1 \\ #2 \\ #3 \\ #4 \end{array}\right]}\) \(\newcommand{\cfourvec}[4]{\left[\begin{array}{c}#1 \\ #2 \\ #3 \\ #4 \end{array}\right]}\) \(\newcommand{\fivevec}[5]{\left[\begin{array}{r}#1 \\ #2 \\ #3 \\ #4 \\ #5 \\ \end{array}\right]}\) \(\newcommand{\cfivevec}[5]{\left[\begin{array}{c}#1 \\ #2 \\ #3 \\ #4 \\ #5 \\ \end{array}\right]}\) \(\newcommand{\mattwo}[4]{\left[\begin{array}{rr}#1 \amp #2 \\ #3 \amp #4 \\ \end{array}\right]}\) \(\newcommand{\laspan}[1]{\text{Span}\{#1\}}\) \(\newcommand{\bcal}{\cal B}\) \(\newcommand{\ccal}{\cal C}\) \(\newcommand{\scal}{\cal S}\) \(\newcommand{\wcal}{\cal W}\) \(\newcommand{\ecal}{\cal E}\) \(\newcommand{\coords}[2]{\left\{#1\right\}_{#2}}\) \(\newcommand{\gray}[1]{\color{gray}{#1}}\) \(\newcommand{\lgray}[1]{\color{lightgray}{#1}}\) \(\newcommand{\rank}{\operatorname{rank}}\) \(\newcommand{\row}{\text{Row}}\) \(\newcommand{\col}{\text{Col}}\) \(\renewcommand{\row}{\text{Row}}\) \(\newcommand{\nul}{\text{Nul}}\) \(\newcommand{\var}{\text{Var}}\) \(\newcommand{\corr}{\text{corr}}\) \(\newcommand{\len}[1]{\left|#1\right|}\) \(\newcommand{\bbar}{\overline{\bvec}}\) \(\newcommand{\bhat}{\widehat{\bvec}}\) \(\newcommand{\bperp}{\bvec^\perp}\) \(\newcommand{\xhat}{\widehat{\xvec}}\) \(\newcommand{\vhat}{\widehat{\vvec}}\) \(\newcommand{\uhat}{\widehat{\uvec}}\) \(\newcommand{\what}{\widehat{\wvec}}\) \(\newcommand{\Sighat}{\widehat{\Sigma}}\) \(\newcommand{\lt}{<}\) \(\newcommand{\gt}{>}\) \(\newcommand{\amp}{&}\) \(\definecolor{fillinmathshade}{gray}{0.9}\)Seismographs
People feel approximately 1 million earthquakes a year, usually when they are close to the source and the earthquake registers at least moment magnitude 2.5. Major earthquakes of moment magnitude 7.0 and higher are extremely rare. The U. S. Geological Survey (USGS) Earthquakes Hazards Program has a real-time map showing the location and magnitude of recent earthquakes around the world.
To accurately study seismic waves, geologists use seismographs that can measure even the slightest ground vibrations. Early 20th-century seismograms use a weighted pen (pendulum) suspended by a long spring above a recording device fixed solidly to the ground. The recording device is a rotating drum mounted with a continuous strip of paper. During an earthquake, the suspended pen moves and records ground movement on the paper strip. The resulting graph is a seismogram. Digital versions use magnets, wire coils, electrical sensors, and digital signals instead of mechanical pens, springs, drums, and paper.
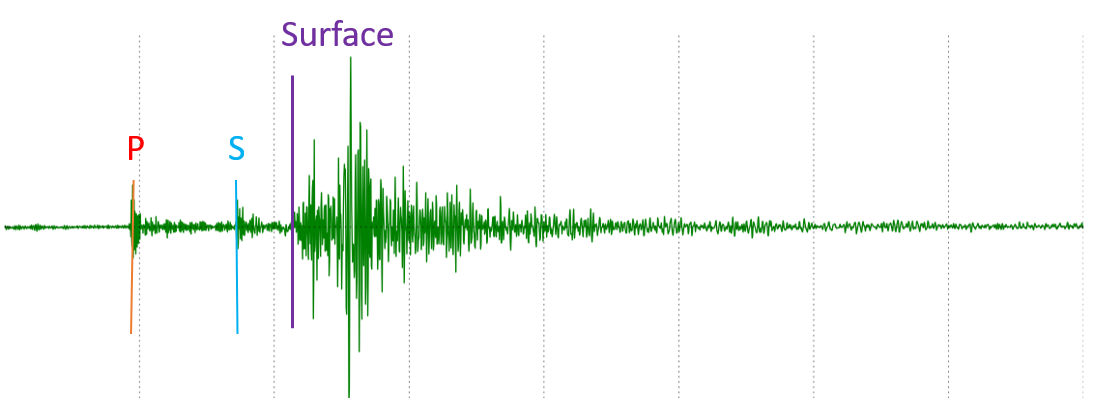
To pinpoint the location of an earthquake epicenter, seismologists use the differences in arrival times of the P, S, and surface waves. After an earthquake, P waves will appear first on a seismogram because they are the fastest, followed by S waves which are slower, and finally surface waves, which have the largest amplitude (height). It is important to note that surface waves lose energy quickly, so they are not measurable at great distances from the epicenter. These time differences determine the distance but not the direction of the epicenter. By using wave arrival times recorded on seismographs at multiple stations, seismologists can apply triangulation to pinpoint the location of the epicenter of an earthquake. At least three seismograph stations are needed for triangulation. The distance from each station to the epicenter is plotted as the radius of a circle. The epicenter is demarked where the circles intersect. This is much easier to show in a video; one is provided in your course materials.
Earthquake Magnitude and Intensity
Richter Scale
Magnitude is the measure of the energy released by an earthquake. The Richter scale (ML), the first and most well-known magnitude scale, was developed by Charles F. Richter (1900-1985) at the California Institute of Technology. This was the magnitude scale used historically by early seismologists. Used by early seismologists, Richter magnitude (ML) is determined from the maximum amplitude of the pen tracing on the seismogram recording. Adjustments for epicenter distance from the seismograph are made using the arrival-time differences of S and P waves [7].
The Richter Scale is logarithmic, based on powers of 10. This means an increase of one Richter unit represents a 10-fold increase in seismic-wave amplitude or in other words, a magnitude 6 earthquake shakes the ground 10 times more than a magnitude 5. However, the actual energy released for each magnitude unit is 32 times greater, which means a magnitude 6 earthquake releases 32 times more energy than a magnitude 5.
The Richter Scale was developed for earthquakes in Southern California, using local seismographs. It has limited applications for larger distances and very large earthquakes. Therefore, most agencies no longer use the Richter Scale. The moment magnitude (MW), which is measured using seismic arrays and generates values comparable to the Richter Scale, is more accurate for measuring earthquakes across the Earth, including large earthquakes, although they require more time to calculate.
Moment Magnitude Scale
The Moment Magnitude scale depicts the absolute size of earthquakes, comparing information from multiple locations and using a measurement of actual energy released calculated from the cross-sectional area of rupture, amount of slippage, and the rigidity of the rocks. Because each earthquake occurs in a unique geologic setting and the rupture area is often hard to measure, estimates of moment magnitude can take days or even months to calculate.
Like the Richter Scale, the moment magnitude scale is logarithmic. The magnitude values of the two scales are approximately equal, except for very large earthquakes. Both scales are used for reporting earthquake magnitude. The Richter Scale provides a quick magnitude estimate immediately following the quake and thus, is usually reported in news accounts, even though scientific calculations now use moment magnitudes.
Mercalli Scale
The Mercalli scale measures the intensity of an earthquake by observing its effect on people, the environment, and the earth's surface. The effects experienced are influenced by many factors such as distance to the epicenter, quality of the construction, and the geologic materials underfoot. While it is not objective like the Richter and Moment Magnitude scales, it does give meaningful information to non scientists who want to get an idea of the size of the event. It uses an intensity rating from I-XII where I is the smallest event and XII is the largest.
| Intensity | Shaking | Description/Damage |
|---|---|---|
| I | Not felt | Not felt except by a very few under especially favorable conditions. |
| II | Weak | Felt only by a few persons at rest, especially on upper floors of buildings. |
| III | Weak | Felt quite noticeably by persons indoors, especially on upper floors of buildings. Many people do not recognize it as an earthquake. Standing motor cars may rock slightly. Vibrations similar to the passing of a truck. Duration estimated. |
| IV | Light | Felt indoors by many, outdoors by few during the day. At night, some awakened. Dishes, windows, doors disturbed; walls make cracking sound. Sensation like heavy truck striking building. Standing motor cars rocked noticeably. |
| V | Moderate | Felt by nearly everyone; many awakened. Some dishes, windows broken. Unstable objects overturned. Pendulum clocks may stop. |
| VI | Strong | Felt by all, many frightened. Some heavy furniture moved; a few instances of fallen plaster. Damage slight. |
| VII | Very strong | Damage negligible in buildings of good design and construction; slight to moderate in well-built ordinary structures; considerable damage in poorly built or badly designed structures; some chimneys broken. |
| VIII | Severe | Damage slight in specially designed structures; considerable damage in ordinary substantial buildings with partial collapse. Damage great in poorly built structures. Fall of chimneys, factory stacks, columns, monuments, walls. Heavy furniture overturned. |
| IX | Violent | Damage considerable in specially designed structures; well-designed frame structures thrown out of plumb. Damage great in substantial buildings, with partial collapse. Buildings shifted off foundations. |
| X | Extreme | Some well-built wooden structures destroyed; most masonry and frame structures destroyed with foundations. Rails bent. |
Table. Abridged Mercalli Scale from USGS General Interest Publication 1989-288-913.
ShakeMaps
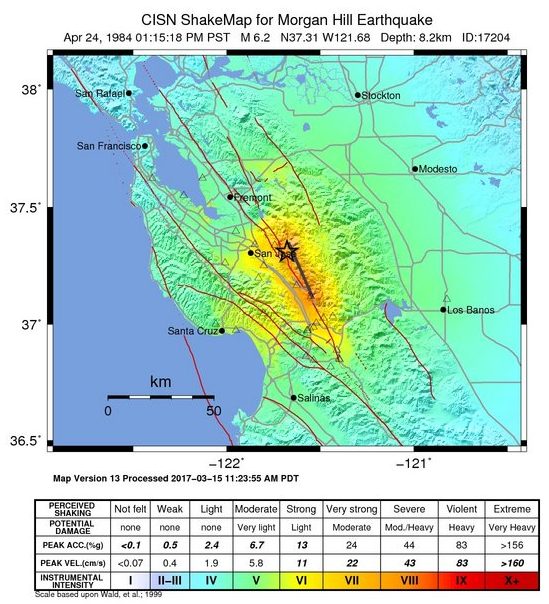
Shake maps, written ShakeMaps by the USGS, use high-quality, computer-interpolated data from seismograph networks to show areas of intense shaking. Shake maps are useful in the crucial minutes after an earthquake, as they show emergency personnel where the greatest damage likely occurred and help them locate possibly damaged gas lines and other utility facilities.