
8.2.5: Yearly-averaged sediment transport
- Page ID
- 16385

\( \newcommand{\vecs}[1]{\overset { \scriptstyle \rightharpoonup} {\mathbf{#1}} } \)
\( \newcommand{\vecd}[1]{\overset{-\!-\!\rightharpoonup}{\vphantom{a}\smash {#1}}} \)
\( \newcommand{\id}{\mathrm{id}}\) \( \newcommand{\Span}{\mathrm{span}}\)
( \newcommand{\kernel}{\mathrm{null}\,}\) \( \newcommand{\range}{\mathrm{range}\,}\)
\( \newcommand{\RealPart}{\mathrm{Re}}\) \( \newcommand{\ImaginaryPart}{\mathrm{Im}}\)
\( \newcommand{\Argument}{\mathrm{Arg}}\) \( \newcommand{\norm}[1]{\| #1 \|}\)
\( \newcommand{\inner}[2]{\langle #1, #2 \rangle}\)
\( \newcommand{\Span}{\mathrm{span}}\)
\( \newcommand{\id}{\mathrm{id}}\)
\( \newcommand{\Span}{\mathrm{span}}\)
\( \newcommand{\kernel}{\mathrm{null}\,}\)
\( \newcommand{\range}{\mathrm{range}\,}\)
\( \newcommand{\RealPart}{\mathrm{Re}}\)
\( \newcommand{\ImaginaryPart}{\mathrm{Im}}\)
\( \newcommand{\Argument}{\mathrm{Arg}}\)
\( \newcommand{\norm}[1]{\| #1 \|}\)
\( \newcommand{\inner}[2]{\langle #1, #2 \rangle}\)
\( \newcommand{\Span}{\mathrm{span}}\) \( \newcommand{\AA}{\unicode[.8,0]{x212B}}\)
\( \newcommand{\vectorA}[1]{\vec{#1}} % arrow\)
\( \newcommand{\vectorAt}[1]{\vec{\text{#1}}} % arrow\)
\( \newcommand{\vectorB}[1]{\overset { \scriptstyle \rightharpoonup} {\mathbf{#1}} } \)
\( \newcommand{\vectorC}[1]{\textbf{#1}} \)
\( \newcommand{\vectorD}[1]{\overrightarrow{#1}} \)
\( \newcommand{\vectorDt}[1]{\overrightarrow{\text{#1}}} \)
\( \newcommand{\vectE}[1]{\overset{-\!-\!\rightharpoonup}{\vphantom{a}\smash{\mathbf {#1}}}} \)
\( \newcommand{\vecs}[1]{\overset { \scriptstyle \rightharpoonup} {\mathbf{#1}} } \)
\( \newcommand{\vecd}[1]{\overset{-\!-\!\rightharpoonup}{\vphantom{a}\smash {#1}}} \)
\(\newcommand{\avec}{\mathbf a}\) \(\newcommand{\bvec}{\mathbf b}\) \(\newcommand{\cvec}{\mathbf c}\) \(\newcommand{\dvec}{\mathbf d}\) \(\newcommand{\dtil}{\widetilde{\mathbf d}}\) \(\newcommand{\evec}{\mathbf e}\) \(\newcommand{\fvec}{\mathbf f}\) \(\newcommand{\nvec}{\mathbf n}\) \(\newcommand{\pvec}{\mathbf p}\) \(\newcommand{\qvec}{\mathbf q}\) \(\newcommand{\svec}{\mathbf s}\) \(\newcommand{\tvec}{\mathbf t}\) \(\newcommand{\uvec}{\mathbf u}\) \(\newcommand{\vvec}{\mathbf v}\) \(\newcommand{\wvec}{\mathbf w}\) \(\newcommand{\xvec}{\mathbf x}\) \(\newcommand{\yvec}{\mathbf y}\) \(\newcommand{\zvec}{\mathbf z}\) \(\newcommand{\rvec}{\mathbf r}\) \(\newcommand{\mvec}{\mathbf m}\) \(\newcommand{\zerovec}{\mathbf 0}\) \(\newcommand{\onevec}{\mathbf 1}\) \(\newcommand{\real}{\mathbb R}\) \(\newcommand{\twovec}[2]{\left[\begin{array}{r}#1 \\ #2 \end{array}\right]}\) \(\newcommand{\ctwovec}[2]{\left[\begin{array}{c}#1 \\ #2 \end{array}\right]}\) \(\newcommand{\threevec}[3]{\left[\begin{array}{r}#1 \\ #2 \\ #3 \end{array}\right]}\) \(\newcommand{\cthreevec}[3]{\left[\begin{array}{c}#1 \\ #2 \\ #3 \end{array}\right]}\) \(\newcommand{\fourvec}[4]{\left[\begin{array}{r}#1 \\ #2 \\ #3 \\ #4 \end{array}\right]}\) \(\newcommand{\cfourvec}[4]{\left[\begin{array}{c}#1 \\ #2 \\ #3 \\ #4 \end{array}\right]}\) \(\newcommand{\fivevec}[5]{\left[\begin{array}{r}#1 \\ #2 \\ #3 \\ #4 \\ #5 \\ \end{array}\right]}\) \(\newcommand{\cfivevec}[5]{\left[\begin{array}{c}#1 \\ #2 \\ #3 \\ #4 \\ #5 \\ \end{array}\right]}\) \(\newcommand{\mattwo}[4]{\left[\begin{array}{rr}#1 \amp #2 \\ #3 \amp #4 \\ \end{array}\right]}\) \(\newcommand{\laspan}[1]{\text{Span}\{#1\}}\) \(\newcommand{\bcal}{\cal B}\) \(\newcommand{\ccal}{\cal C}\) \(\newcommand{\scal}{\cal S}\) \(\newcommand{\wcal}{\cal W}\) \(\newcommand{\ecal}{\cal E}\) \(\newcommand{\coords}[2]{\left\{#1\right\}_{#2}}\) \(\newcommand{\gray}[1]{\color{gray}{#1}}\) \(\newcommand{\lgray}[1]{\color{lightgray}{#1}}\) \(\newcommand{\rank}{\operatorname{rank}}\) \(\newcommand{\row}{\text{Row}}\) \(\newcommand{\col}{\text{Col}}\) \(\renewcommand{\row}{\text{Row}}\) \(\newcommand{\nul}{\text{Nul}}\) \(\newcommand{\var}{\text{Var}}\) \(\newcommand{\corr}{\text{corr}}\) \(\newcommand{\len}[1]{\left|#1\right|}\) \(\newcommand{\bbar}{\overline{\bvec}}\) \(\newcommand{\bhat}{\widehat{\bvec}}\) \(\newcommand{\bperp}{\bvec^\perp}\) \(\newcommand{\xhat}{\widehat{\xvec}}\) \(\newcommand{\vhat}{\widehat{\vvec}}\) \(\newcommand{\uhat}{\widehat{\uvec}}\) \(\newcommand{\what}{\widehat{\wvec}}\) \(\newcommand{\Sighat}{\widehat{\Sigma}}\) \(\newcommand{\lt}{<}\) \(\newcommand{\gt}{>}\) \(\newcommand{\amp}{&}\) \(\definecolor{fillinmathshade}{gray}{0.9}\)In Sect. 8.2.4, we discussed the longshore transport rate for a single wave state (represented by its root-mean-squared wave height and wave period) and examined the effect of the angle of incidence on the transport rates. The maximum computed transport rate (for a deep water wave angle of \(43^{\circ}\)) amounts to \(0.38\ m^3/s\). In the (unrealistic) situation that this wave condition is present all year round, we would find a net longshore transport of order \(10 \times 10^6\ m^3\) per year.
In order to obtain a realistic estimate of the long-term average annual longshore sediment transport rate we need to take the variability of the wave climate into account. Wave heights, periods, and angles are weather dependent. Different wave heights and periods result in different transport magnitudes. Changes in the wave angle may lead to transports that not only have different magnitudes but opposite directions as well.
The wave climate variability can be taken into account by schematization of the wave climate in several classes (see Sect. 3.6). This requires that the wave climate is divided into sectors of for instance \(30^{\circ}\), 0.5s \(T_p\), 0.5m \(H_s\) with a certain percentage of occurrence. For morphological computations often such a full wave climate is then reduced to a limited number of wave conditions. For the wave to be representative of the full climate, they must reflect the dominant wave directions and also represent a morphological criterion of interest. Such a criterion could for instance be that the net longshore sediment transport at some coastal sections for the reduced climate must be identical to the net transport rate for the full climate. A reduced wave climate typically has 10 conditions, but sometimes a single representative wave condition is chosen that reproduces the net longshore transport rate of the full climate. The net longshore transport rate is defined as the residual transport rate as a result of all conditions and is generally much smaller than the gross longshore transport rates up and down the coast. Of course, for a single wave condition, the gross and net longshore transport rates are identical.
As an example we consider the wave climate for the Dutch coast, which is characterised by relatively short period waves (of about \(5\ s\)). Waves offshore exceed \(2\ m\) approximately 10% of the time and \(3\ m\) approximately 2% of the time. Most waves arrive from the southwest to the northwest directions (such that the average wave incidence is almost normal to the coast). The highest waves are from the northwest direction because of the longer fetches in this sector. Swell is also predominantly from the northwest direction. The orientation of the central Dutch coast is approximately \(N-S\) (e.g. \(7^{\circ}N\) at Egmond, or \(277^{\circ}N\) for the shore-normal direction, and \(15^{\circ}N\) at IJmuiden). Along this coast, storms arriving from the northwest generate longshore currents and a southwards longshore transport. Conversely, waves from the southwest result in a northward directed transport.
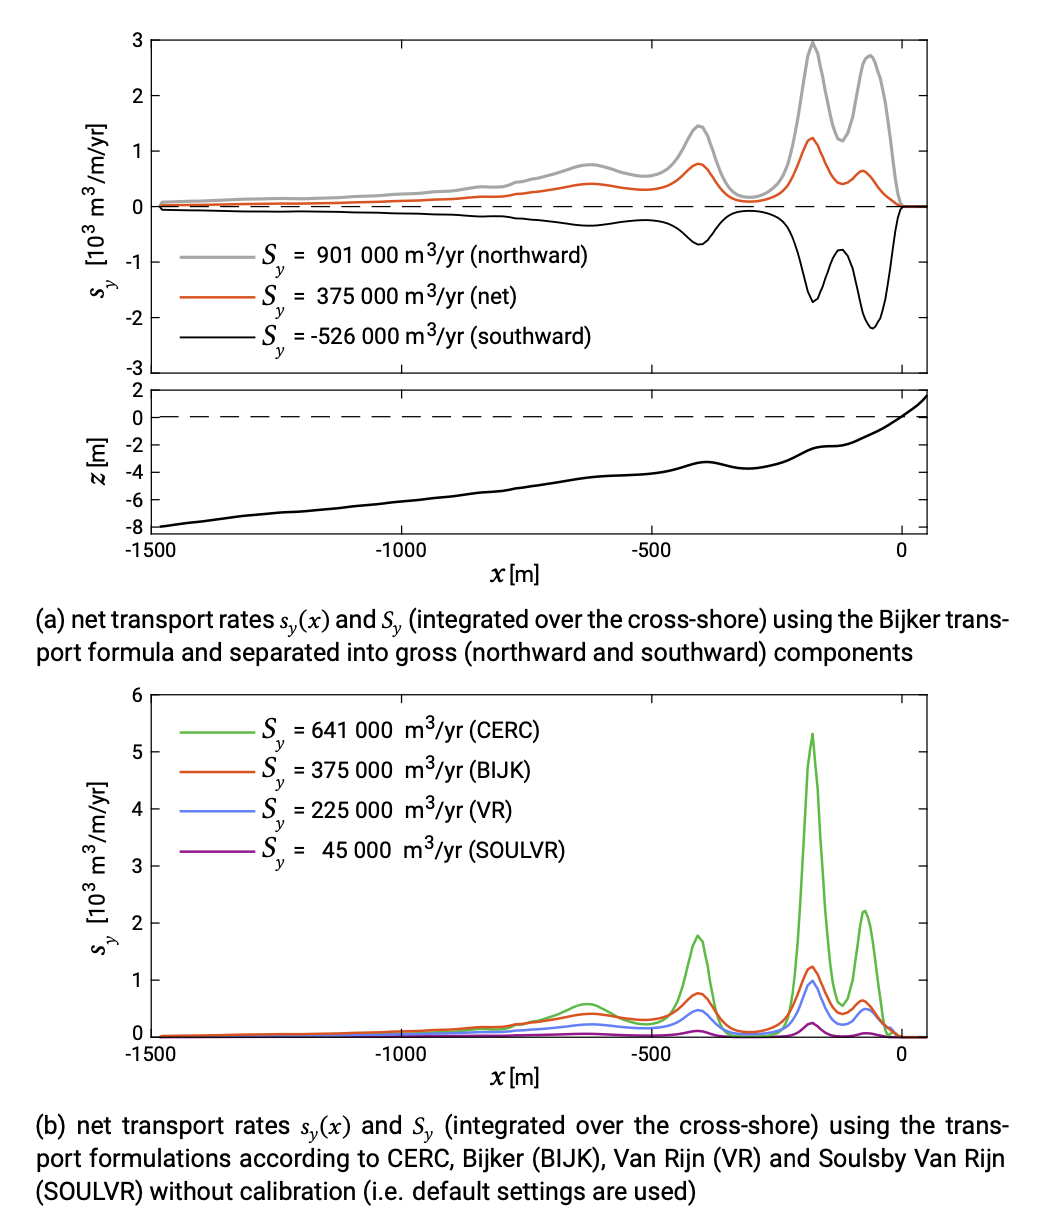
Figure 8.5 shows the cross-shore distribution of the longshore transport around Noord-wijk according to model computations with Unibest-CL+. A distinction is made between northward and southward transport. For engineering purposes, we are interested in the gross transport rates as well as in the net transport rate (which is directed northward for most of the central Dutch coast).
Gradients in net transport rates determine the long-term evolution of a stretch of coast. Gross transport rates are important to determine the coastal response near breakwaters and groynes. This is because these structures provide shadow zones on either side for part of the wave conditions (see Sect. 8.4.2). Especially when the gross longshore transport rates along a coast are quite similar in magnitude, the magnitude (and direction!) of the net longshore transport is very difficult to determine with sufficient accuracy. This is the result of the subtraction of two large and inaccurate numbers. Note further that net longshore transport rates (per metre width) are generally much higher than the net cross-shore transport rates (per metre width).
A strongly reduced wave climate for the Dutch coast, taking into account the two dominant directions, may for instance consist of the following two wave conditions:
- From southwesterly directions (say \(225^{\circ}N\)), occurring 20% of the time and with \(H_s = 1.7\ m\) and \(T_p = 5\ s\);
- From northwesterly directions (say \(315^{\circ}N\)), occurring 8% of the time and with \(H_s = 1.8\ m\), \(T_p = 6\ s\).
For a coastline orientation of about \(15^{\circ}N\) and hence a shore-normal of \(285^{\circ}N\) (IJmuiden) this means angles of wave incidence in deep water of \(60^{\circ}\) and \(-30^{\circ}\) for condition 1 and 2 respectively. This would yield (using Eq. 8.2.4.1 as in Example 8.2.4.1) a net northward directed sediment transport of \(250\ 000\ m^3/yr\) as a result of:
- Northward transport of \(\pm 530\ 000\ m^3/yr\);
- Southward transport of \(\pm 280\ 000\ m^3/yr\).
Note that we have chosen the two conditions such that: 1) they reflect the prevailing wave conditions; and 2) the net transport magnitude and direction correspond with estimates based on sediment balance considerations. As a reference: the net yearly transport in the central part of the Dutch coast (from Wassenaar to Zandvoort) is thought to be around \(200\ 000\ m^3/yr\) northwards. We could further fine-tune our wave conditions to arrive at the figure of \(200\ 000\ m^3/yr\) rather than \(250\ 000\ m^3/yr\). This is the process of defining a morphologically representative reduced wave climate. Note that in practice we would generally take more conditions into account.