4.2.2: Atmospheric circulation and wind patterns
- Page ID
- 16311
\( \newcommand{\vecs}[1]{\overset { \scriptstyle \rightharpoonup} {\mathbf{#1}} } \)
\( \newcommand{\vecd}[1]{\overset{-\!-\!\rightharpoonup}{\vphantom{a}\smash {#1}}} \)
\( \newcommand{\id}{\mathrm{id}}\) \( \newcommand{\Span}{\mathrm{span}}\)
( \newcommand{\kernel}{\mathrm{null}\,}\) \( \newcommand{\range}{\mathrm{range}\,}\)
\( \newcommand{\RealPart}{\mathrm{Re}}\) \( \newcommand{\ImaginaryPart}{\mathrm{Im}}\)
\( \newcommand{\Argument}{\mathrm{Arg}}\) \( \newcommand{\norm}[1]{\| #1 \|}\)
\( \newcommand{\inner}[2]{\langle #1, #2 \rangle}\)
\( \newcommand{\Span}{\mathrm{span}}\)
\( \newcommand{\id}{\mathrm{id}}\)
\( \newcommand{\Span}{\mathrm{span}}\)
\( \newcommand{\kernel}{\mathrm{null}\,}\)
\( \newcommand{\range}{\mathrm{range}\,}\)
\( \newcommand{\RealPart}{\mathrm{Re}}\)
\( \newcommand{\ImaginaryPart}{\mathrm{Im}}\)
\( \newcommand{\Argument}{\mathrm{Arg}}\)
\( \newcommand{\norm}[1]{\| #1 \|}\)
\( \newcommand{\inner}[2]{\langle #1, #2 \rangle}\)
\( \newcommand{\Span}{\mathrm{span}}\) \( \newcommand{\AA}{\unicode[.8,0]{x212B}}\)
\( \newcommand{\vectorA}[1]{\vec{#1}} % arrow\)
\( \newcommand{\vectorAt}[1]{\vec{\text{#1}}} % arrow\)
\( \newcommand{\vectorB}[1]{\overset { \scriptstyle \rightharpoonup} {\mathbf{#1}} } \)
\( \newcommand{\vectorC}[1]{\textbf{#1}} \)
\( \newcommand{\vectorD}[1]{\overrightarrow{#1}} \)
\( \newcommand{\vectorDt}[1]{\overrightarrow{\text{#1}}} \)
\( \newcommand{\vectE}[1]{\overset{-\!-\!\rightharpoonup}{\vphantom{a}\smash{\mathbf {#1}}}} \)
\( \newcommand{\vecs}[1]{\overset { \scriptstyle \rightharpoonup} {\mathbf{#1}} } \)
\( \newcommand{\vecd}[1]{\overset{-\!-\!\rightharpoonup}{\vphantom{a}\smash {#1}}} \)
\(\newcommand{\avec}{\mathbf a}\) \(\newcommand{\bvec}{\mathbf b}\) \(\newcommand{\cvec}{\mathbf c}\) \(\newcommand{\dvec}{\mathbf d}\) \(\newcommand{\dtil}{\widetilde{\mathbf d}}\) \(\newcommand{\evec}{\mathbf e}\) \(\newcommand{\fvec}{\mathbf f}\) \(\newcommand{\nvec}{\mathbf n}\) \(\newcommand{\pvec}{\mathbf p}\) \(\newcommand{\qvec}{\mathbf q}\) \(\newcommand{\svec}{\mathbf s}\) \(\newcommand{\tvec}{\mathbf t}\) \(\newcommand{\uvec}{\mathbf u}\) \(\newcommand{\vvec}{\mathbf v}\) \(\newcommand{\wvec}{\mathbf w}\) \(\newcommand{\xvec}{\mathbf x}\) \(\newcommand{\yvec}{\mathbf y}\) \(\newcommand{\zvec}{\mathbf z}\) \(\newcommand{\rvec}{\mathbf r}\) \(\newcommand{\mvec}{\mathbf m}\) \(\newcommand{\zerovec}{\mathbf 0}\) \(\newcommand{\onevec}{\mathbf 1}\) \(\newcommand{\real}{\mathbb R}\) \(\newcommand{\twovec}[2]{\left[\begin{array}{r}#1 \\ #2 \end{array}\right]}\) \(\newcommand{\ctwovec}[2]{\left[\begin{array}{c}#1 \\ #2 \end{array}\right]}\) \(\newcommand{\threevec}[3]{\left[\begin{array}{r}#1 \\ #2 \\ #3 \end{array}\right]}\) \(\newcommand{\cthreevec}[3]{\left[\begin{array}{c}#1 \\ #2 \\ #3 \end{array}\right]}\) \(\newcommand{\fourvec}[4]{\left[\begin{array}{r}#1 \\ #2 \\ #3 \\ #4 \end{array}\right]}\) \(\newcommand{\cfourvec}[4]{\left[\begin{array}{c}#1 \\ #2 \\ #3 \\ #4 \end{array}\right]}\) \(\newcommand{\fivevec}[5]{\left[\begin{array}{r}#1 \\ #2 \\ #3 \\ #4 \\ #5 \\ \end{array}\right]}\) \(\newcommand{\cfivevec}[5]{\left[\begin{array}{c}#1 \\ #2 \\ #3 \\ #4 \\ #5 \\ \end{array}\right]}\) \(\newcommand{\mattwo}[4]{\left[\begin{array}{rr}#1 \amp #2 \\ #3 \amp #4 \\ \end{array}\right]}\) \(\newcommand{\laspan}[1]{\text{Span}\{#1\}}\) \(\newcommand{\bcal}{\cal B}\) \(\newcommand{\ccal}{\cal C}\) \(\newcommand{\scal}{\cal S}\) \(\newcommand{\wcal}{\cal W}\) \(\newcommand{\ecal}{\cal E}\) \(\newcommand{\coords}[2]{\left\{#1\right\}_{#2}}\) \(\newcommand{\gray}[1]{\color{gray}{#1}}\) \(\newcommand{\lgray}[1]{\color{lightgray}{#1}}\) \(\newcommand{\rank}{\operatorname{rank}}\) \(\newcommand{\row}{\text{Row}}\) \(\newcommand{\col}{\text{Col}}\) \(\renewcommand{\row}{\text{Row}}\) \(\newcommand{\nul}{\text{Nul}}\) \(\newcommand{\var}{\text{Var}}\) \(\newcommand{\corr}{\text{corr}}\) \(\newcommand{\len}[1]{\left|#1\right|}\) \(\newcommand{\bbar}{\overline{\bvec}}\) \(\newcommand{\bhat}{\widehat{\bvec}}\) \(\newcommand{\bperp}{\bvec^\perp}\) \(\newcommand{\xhat}{\widehat{\xvec}}\) \(\newcommand{\vhat}{\widehat{\vvec}}\) \(\newcommand{\uhat}{\widehat{\uvec}}\) \(\newcommand{\what}{\widehat{\wvec}}\) \(\newcommand{\Sighat}{\widehat{\Sigma}}\) \(\newcommand{\lt}{<}\) \(\newcommand{\gt}{>}\) \(\newcommand{\amp}{&}\) \(\definecolor{fillinmathshade}{gray}{0.9}\)Near the equator where the average solar radiation is greatest, the air is warmed at the surface and rises. It attains a maximum vertical altitude of about 14 kilometres (top of the troposphere1) and then begins flowing horizontally to the North and South Poles. This creates the band of low air pressure known as the Intertropical Convergence Zone (ITCZ). Because air moves from high surface pressure toward low surface pressure, the ITCZ draws in surface air from higher latitudes resulting in surface winds towards the equator.

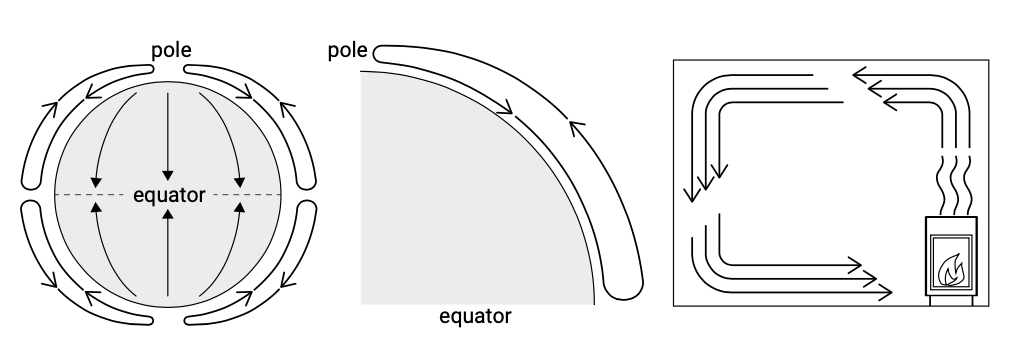
If the earth did not rotate, and if its surface would be entirely uniform with respect to transparency to solar radiation, heat capacity and thermal conductivity, then we might expect a simple convection cell circulation to exist within the troposphere in each hemisphere (Fig. 4.3). Each cell would have a horizontal dimension of the order of \(10^4\) km compared with a vertical dimension of only some 10 km.

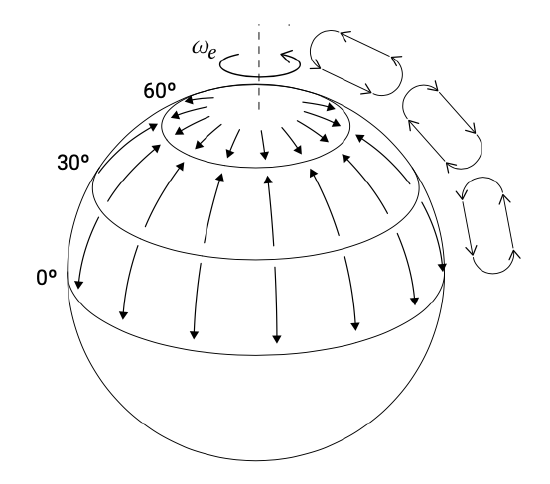
In reality, due to the rotation of the earth, the cells on the Northern and Southern Hemispheres break up in three smaller cells each (Fig. 4.4).
The earth rotation results in the so-called Coriolis effect (see Intermezzo 3.1). It causes currents and atmospheric flows to deviate to the right (starboard side) on the NH and to the left (port side) on the SH. Due to the Coriolis effect, the air in the upper atmosphere is deflected when moving away from the equator.
By about 30° of latitude (north and south) the air begins to flow from west to east (this is the subtropical jet stream) causing an accumulation of air in the upper atmosphere. To compensate for this accumulation, some of the air in the upper atmosphere sinks back to the surface creating the subtropical high pressure zone.
From this zone, the surface air travels in two directions:

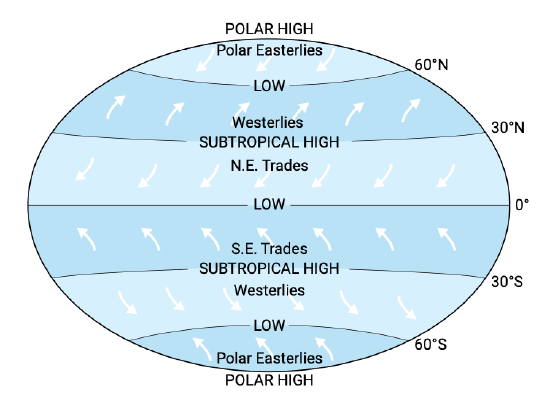
- Back toward the equator creating the trade winds or tropical easterlies (Fig.4.5). These trade winds are deflected by the Coriolis effect resulting in the northeast trades (NH, right deflection) and the southeast trades (SH, left deflection);
- Towards the poles producing the westerlies that are also deflected by Coriolis.
Roughly at 60° north and south latitude, the subtropical westerlies collide with cold air travelling from the poles (polar easterlies). This collision results in the uplift of air and the creation of subpolar low pressure zones (and associated mid-latitude cyclones).
After it reaches the top of the troposphere part of this lifted air is directed towards the polar highs and part is directed towards lower latitudes.
In Fig. 4.5 we can thus clearly distinguish regions with mainly westerly winds at latitudes between 30° and 60°, which we know extremely well in the Netherlands. These are strong and variable winds. Also the regions with mainly NE and SE trade winds between the equator and 30° are apparent. Trade winds are moderate but persistent throughout the year. They mainly occur over the oceans, since near the continents they are generally overruled by tropical and subtropical seasonal winds called mon-soons (see below). The polar easterlies are moderate as well and blow over land (Antarctica) or ice (Arctic area) for the larger part of the year. The area near the ITCZ where the wind climate is predominantly calm is called doldrums. However, the tropics can experience tropical storms which develop over sea and ocean areas with high surface temperatures. Depending on the location these tropical storms are called hurricanes (near the Americas), cyclones (near India and Africa) or typhoons (near SE-Asia and Australia). The storms follow a path, which is only partly predictable, and are stopped only after crossing into a continent. Another cyclonic source are the east coast cyclones that form off the east coasts (of USA, Australia, Brazil, Africa) between 25° and 35° N and S.

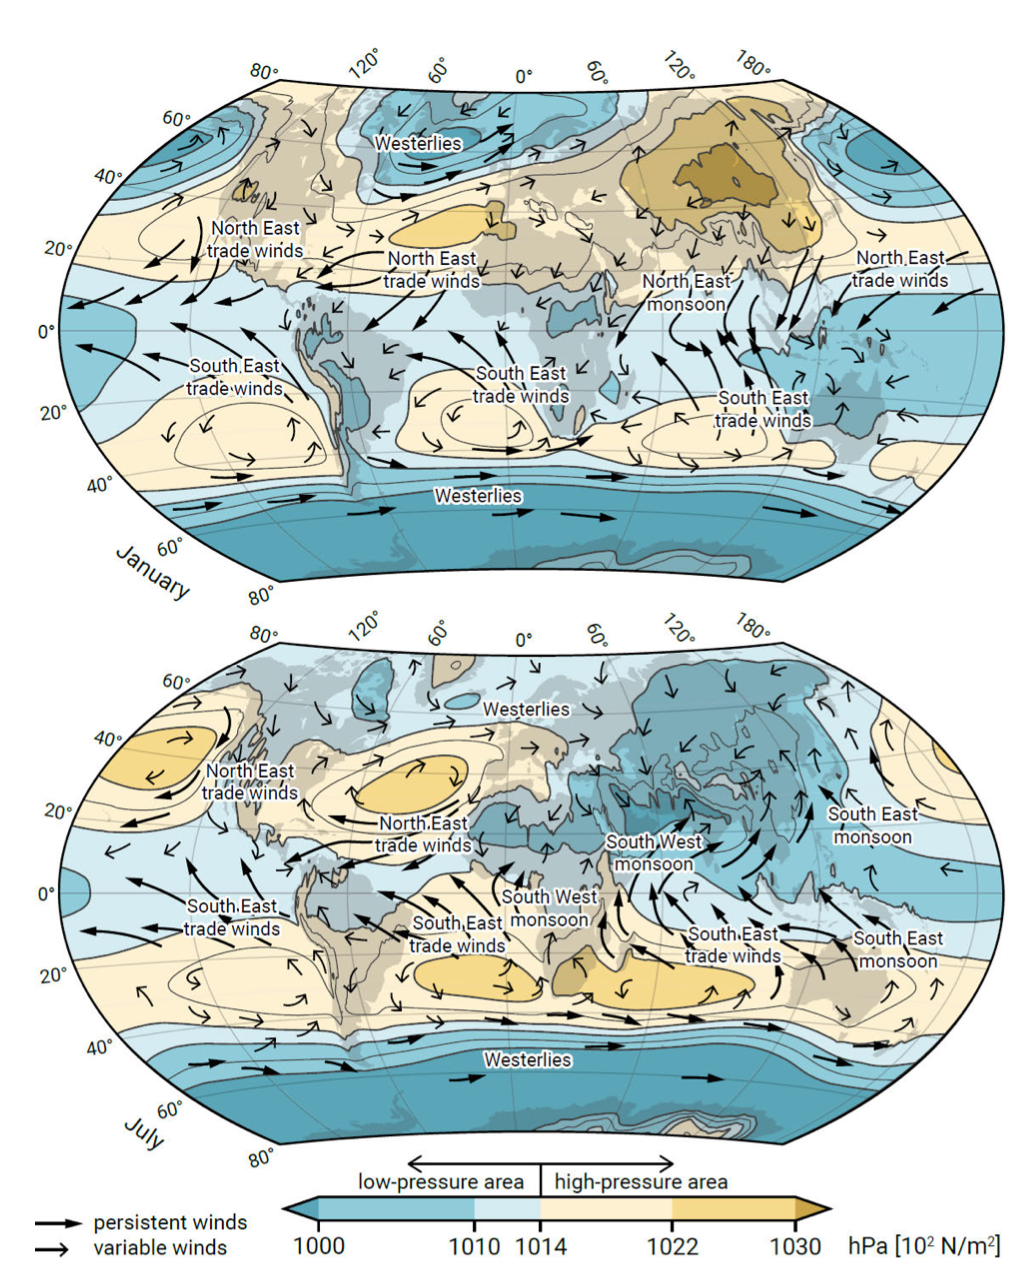
When the non-uniformity of the earth’s surface is introduced, the situation becomes considerably more complex. Due to the presence of land masses, the large-scale pressure belts are broken up in several areas of low and high pressure (see Fig. 4.6). Both the topography of a certain area (mountains affect the pressure distribution) and the differential warming of the oceans and the land play a role. Resulting typical wind pat- terns for the months of January and July are also shown in Fig. 4.6. We can recognise westerlies and trade winds as well as seasonally reversing winds called monsoons.
The westerlies are the strongest winds, especially around 50° to 60° N and S. Their seasonality is largest in the Northern Hemisphere where the differential warming of oceans and continents strongly influences the location of Highs and Lows (due to the larger presence of land mass in the NH). Especially the Asian land mass causes significant deviations from the large-scale pressure and wind belts (compare Fig. 4.5 and in Fig. 4.6).
It can further be clearly observed that some tropical areas are dominated by trade winds (blowing in the same direction throughout the year), whereas other areas in the tropics and subtropics are dominated by seasonally reversing monsoons. These monsoons are the result of the larger amplitude of the seasonal cycle of land temperature compared to that of nearby oceans. This is evident in for instance SE Asia, where the Asian continent warms up in July, thus creating a Low above China, causing a SW wind blowing from the sea to the land. In January, when the water of the Indian Ocean maintains a higher temperature than the continent, the situation is reversed, causing a NE wind. The SW summer monsoon (blowing from the sea to the land) is warm and humid and the NE winter monsoon (blowing from the land towards the sea) is relatively cold and dry2. The above holds for large continental land masses (like Asia), but also N and S America and Africa have a monsoon. For minor land masses onshore winds may be experienced in winter. Monsoons are moderate but persistent winds.
Summarising, the zonal wind systems are determined by large-scale pressure belts as a result of latitude dependent heating of the earth. We can distinguish between:
- Polar easterlies at high latitudes (>70°);
- Strong westerlies at mid-latitudes (30°–70°);
- Extensive, but moderate trade winds in the subtropics (10°–30°);
- Quieter doldrums around the equator (10°N–10°S).
These winds blow in the same direction throughout the year, but vary spatially and temporally with the seasons. The trade winds and in particular the westerlies are the most important in supplying energy to the coastal system. Although the trade winds are not as strong as the westerlies, they blow over large areas throughout the year.
Regional and local effects are:
- The seasonally reversing monsoons due to changes in heating of continents and oceans;
- Cyclones (tropical and east coast cyclones);
- Land and sea breezes that arise from differences in temperature of land and sea
1. Troposphere is the upper part of the atmosphere where the temperature decreases with increasing altitude.
2. Similarly, differences between day and night land-sea temperatures can locally generate an onshore breeze during the day (sea breeze) and an offshore breeze (land breeze) at night.


