
7.6: What is the math behind these physical descriptions of the GOES data products?
- Page ID
- 3394

\( \newcommand{\vecs}[1]{\overset { \scriptstyle \rightharpoonup} {\mathbf{#1}} } \)
\( \newcommand{\vecd}[1]{\overset{-\!-\!\rightharpoonup}{\vphantom{a}\smash {#1}}} \)
\( \newcommand{\id}{\mathrm{id}}\) \( \newcommand{\Span}{\mathrm{span}}\)
( \newcommand{\kernel}{\mathrm{null}\,}\) \( \newcommand{\range}{\mathrm{range}\,}\)
\( \newcommand{\RealPart}{\mathrm{Re}}\) \( \newcommand{\ImaginaryPart}{\mathrm{Im}}\)
\( \newcommand{\Argument}{\mathrm{Arg}}\) \( \newcommand{\norm}[1]{\| #1 \|}\)
\( \newcommand{\inner}[2]{\langle #1, #2 \rangle}\)
\( \newcommand{\Span}{\mathrm{span}}\)
\( \newcommand{\id}{\mathrm{id}}\)
\( \newcommand{\Span}{\mathrm{span}}\)
\( \newcommand{\kernel}{\mathrm{null}\,}\)
\( \newcommand{\range}{\mathrm{range}\,}\)
\( \newcommand{\RealPart}{\mathrm{Re}}\)
\( \newcommand{\ImaginaryPart}{\mathrm{Im}}\)
\( \newcommand{\Argument}{\mathrm{Arg}}\)
\( \newcommand{\norm}[1]{\| #1 \|}\)
\( \newcommand{\inner}[2]{\langle #1, #2 \rangle}\)
\( \newcommand{\Span}{\mathrm{span}}\) \( \newcommand{\AA}{\unicode[.8,0]{x212B}}\)
\( \newcommand{\vectorA}[1]{\vec{#1}} % arrow\)
\( \newcommand{\vectorAt}[1]{\vec{\text{#1}}} % arrow\)
\( \newcommand{\vectorB}[1]{\overset { \scriptstyle \rightharpoonup} {\mathbf{#1}} } \)
\( \newcommand{\vectorC}[1]{\textbf{#1}} \)
\( \newcommand{\vectorD}[1]{\overrightarrow{#1}} \)
\( \newcommand{\vectorDt}[1]{\overrightarrow{\text{#1}}} \)
\( \newcommand{\vectE}[1]{\overset{-\!-\!\rightharpoonup}{\vphantom{a}\smash{\mathbf {#1}}}} \)
\( \newcommand{\vecs}[1]{\overset { \scriptstyle \rightharpoonup} {\mathbf{#1}} } \)
\( \newcommand{\vecd}[1]{\overset{-\!-\!\rightharpoonup}{\vphantom{a}\smash {#1}}} \)
\(\newcommand{\avec}{\mathbf a}\) \(\newcommand{\bvec}{\mathbf b}\) \(\newcommand{\cvec}{\mathbf c}\) \(\newcommand{\dvec}{\mathbf d}\) \(\newcommand{\dtil}{\widetilde{\mathbf d}}\) \(\newcommand{\evec}{\mathbf e}\) \(\newcommand{\fvec}{\mathbf f}\) \(\newcommand{\nvec}{\mathbf n}\) \(\newcommand{\pvec}{\mathbf p}\) \(\newcommand{\qvec}{\mathbf q}\) \(\newcommand{\svec}{\mathbf s}\) \(\newcommand{\tvec}{\mathbf t}\) \(\newcommand{\uvec}{\mathbf u}\) \(\newcommand{\vvec}{\mathbf v}\) \(\newcommand{\wvec}{\mathbf w}\) \(\newcommand{\xvec}{\mathbf x}\) \(\newcommand{\yvec}{\mathbf y}\) \(\newcommand{\zvec}{\mathbf z}\) \(\newcommand{\rvec}{\mathbf r}\) \(\newcommand{\mvec}{\mathbf m}\) \(\newcommand{\zerovec}{\mathbf 0}\) \(\newcommand{\onevec}{\mathbf 1}\) \(\newcommand{\real}{\mathbb R}\) \(\newcommand{\twovec}[2]{\left[\begin{array}{r}#1 \\ #2 \end{array}\right]}\) \(\newcommand{\ctwovec}[2]{\left[\begin{array}{c}#1 \\ #2 \end{array}\right]}\) \(\newcommand{\threevec}[3]{\left[\begin{array}{r}#1 \\ #2 \\ #3 \end{array}\right]}\) \(\newcommand{\cthreevec}[3]{\left[\begin{array}{c}#1 \\ #2 \\ #3 \end{array}\right]}\) \(\newcommand{\fourvec}[4]{\left[\begin{array}{r}#1 \\ #2 \\ #3 \\ #4 \end{array}\right]}\) \(\newcommand{\cfourvec}[4]{\left[\begin{array}{c}#1 \\ #2 \\ #3 \\ #4 \end{array}\right]}\) \(\newcommand{\fivevec}[5]{\left[\begin{array}{r}#1 \\ #2 \\ #3 \\ #4 \\ #5 \\ \end{array}\right]}\) \(\newcommand{\cfivevec}[5]{\left[\begin{array}{c}#1 \\ #2 \\ #3 \\ #4 \\ #5 \\ \end{array}\right]}\) \(\newcommand{\mattwo}[4]{\left[\begin{array}{rr}#1 \amp #2 \\ #3 \amp #4 \\ \end{array}\right]}\) \(\newcommand{\laspan}[1]{\text{Span}\{#1\}}\) \(\newcommand{\bcal}{\cal B}\) \(\newcommand{\ccal}{\cal C}\) \(\newcommand{\scal}{\cal S}\) \(\newcommand{\wcal}{\cal W}\) \(\newcommand{\ecal}{\cal E}\) \(\newcommand{\coords}[2]{\left\{#1\right\}_{#2}}\) \(\newcommand{\gray}[1]{\color{gray}{#1}}\) \(\newcommand{\lgray}[1]{\color{lightgray}{#1}}\) \(\newcommand{\rank}{\operatorname{rank}}\) \(\newcommand{\row}{\text{Row}}\) \(\newcommand{\col}{\text{Col}}\) \(\renewcommand{\row}{\text{Row}}\) \(\newcommand{\nul}{\text{Nul}}\) \(\newcommand{\var}{\text{Var}}\) \(\newcommand{\corr}{\text{corr}}\) \(\newcommand{\len}[1]{\left|#1\right|}\) \(\newcommand{\bbar}{\overline{\bvec}}\) \(\newcommand{\bhat}{\widehat{\bvec}}\) \(\newcommand{\bperp}{\bvec^\perp}\) \(\newcommand{\xhat}{\widehat{\xvec}}\) \(\newcommand{\vhat}{\widehat{\vvec}}\) \(\newcommand{\uhat}{\widehat{\uvec}}\) \(\newcommand{\what}{\widehat{\wvec}}\) \(\newcommand{\Sighat}{\widehat{\Sigma}}\) \(\newcommand{\lt}{<}\) \(\newcommand{\gt}{>}\) \(\newcommand{\amp}{&}\) \(\definecolor{fillinmathshade}{gray}{0.9}\)In Lesson 6, we derived an equation (Schwarzschild’s equation) for the change in radiance as a function of path between an infrared source and an observer:
\[\frac{d I}{d s}=\kappa_{a}\left(P_{e}-I\right)\]
where I is the directed beam of radiation (or radiance) along the path between the object and the observer, Pe is the Planck function radiance at the temperatures of the air (really the greenhouse gases in the air) along the path, and κa is the absorptivity of the air along the path.
Let’s apply this equation to the point-of-view of an Earth-observing satellite. Define ττ (tau) as the optical path between the satellite (τ=0)(τ=0) and some arbitrary point along the optical path given by ττ . We are not using Earth’s surface as the zero point as we often do, but instead, we are using the satellite as the zero point and letting the distance, s, and thus the optical path, change from there. The change in the optical path equals:
\[d \tau=-\kappa_{a} d s\]
because ds is going down and becoming more negative while the optical path \(d \tau\) grows. \(\kappa_{a}\) is just the absorptivity (m-1).
Integrating both sides from the satellite to some distance s from the satellite:
\[\int_{\text {satellie }}^{s} d \tau=\tau(s)=-\int_{\text {satellie }}^{s} \kappa_{a}\left(s^{\prime}\right) d s^{\prime}=\int_{s}^{\text {satellite }} \kappa_{a}\left(s^{\prime}\right) d s^{\prime}\]
To make it easier to understand what is going on, we will switch the variable in [6.15] from the distance ds to the optical path dt, because it is the optical path, not the actual distance, that determines what the satellite detects.
\(\frac{d I}{-d s}=\kappa_{a}\left(P_{e}-I\right.\) where s is from the satellite going down (negative)
or
\(\frac{d I}{d \tau}=\left(P_{e}-I\right)\) from the point-of-view of the satellite.
This equation can be integrated to give the radiance observed by the satellite at an optical depth τiτi looking down at Earth:
\[I\left(\tau=0, \text { at the satellite) }=I\left(\tau_{i}\right) \exp \left(-\tau_{i}\right)+\int_{0}^{\tau_{i}} P_{e} \exp (-\tau) d \tau\right.\]
So, what does this mean?
- The left-hand side is the radiance that the satellite observes.
- The first term on the right-hand side is a source’s radiance that is absorbed along the path according to Beer’s Law. I(τ)I(τ) could be the radiance emitted by Earth’s surface and exp(−τi) exp(−τi) the transmittance from Earth’s surface to the satellite.
- The second term on the right hand side is the emitted radiance of the atmosphere integrated over all points along the path, with transmission between each point of emission and the satellite accounted for by the exponential factor exp(−τ)exp(−τ) . For example, for the water vapor channel, Pe is the emission of radiance at the water vapor channel wavelength from some point along the path and exp(−τ)exp(−τ) represents the transmission of that radiance through all the other water vapor along the path between the emission point and the satellite.
- The satellite simply will not detect much radiance from an object, solid or gas, if the optical path, ττ , between it and the satellite is 3 or more because exp(-3) = 0.05.
- Remember that Pe depends on temperature (equation 6-7), so that Pe will be smaller at higher altitudes where the temperature is lower.
We have neglected scattering in these equations. Molecular scattering is insignificant at infrared and longer (for example, microwave) wavelengths. Cloud particle and aerosol scattering is important at visible and near-infrared \((1-4 \mu m)\) wavelengths, but less so at thermal infrared \((4-50 \mu m)\) wavelengths, where absorption dominates. In the thermal infrared, water clouds have an absorptivity, hence emissivity, close to 1 and emit according to the Planck function (Equation 6.3).
Looking back at a figure from Lesson 6, we can see at which wavelengths the greenhouse gases in the atmosphere, mostly water vapor and carbon dioxide, absorb and thus emit and at which wavelengths there are windows with low absorptivity that allow most infrared irradiance to leave Earth's surface and go out into space as indicated by the blue-filled spectral intensity (i.e., irradiance). Note that much of Earth's infrared irradiance is absorbed by the atmosphere. The radiation from the atmosphere is not included in the blue curve-filled curve called "Upgoing Thermal Radiation." This window extends from \(\sim 8 \mu m\) to \(\sim 13 \mu m\), with ozone absorption occurring in a fairly narrow band around 9.6\(\mu \mathrm{m}\).
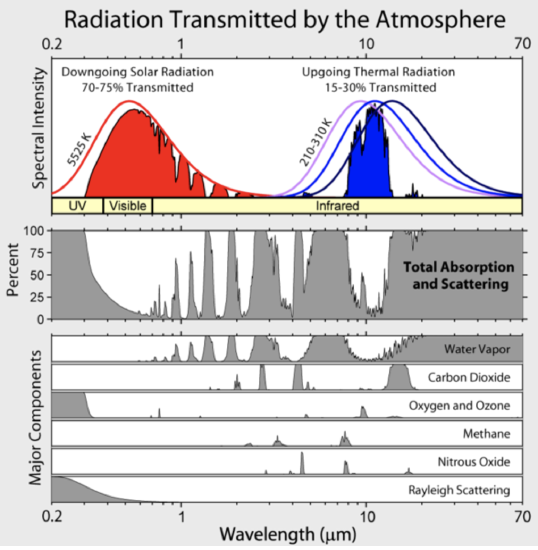
Credit: Robert A Rohde, Global Warming Art, via Wikimedia Commons
Satellites observe irradiance from both Earth's surface and from the atmosphere at different pressure levels (see figure below). The radiance observed in the \(\sim 8 \mu m\) to \(\sim 13 \mu m\) is coming from Earth's surface and has a temperature of about 295 K, or 22 oC. Note that the GOES weather satellite IR band \((10.2 \mu m-11 \mu m)\) is looking at the lowest opaque surface, which because the scene was clear, that surface was the ocean. At wavelengths lower than 8\(\mu m\), note that the radiance is coming from a source that is colder and, in fact, is coming from water vapor with an average temperature of 260 K when the absorptivity is a little weaker near 8\(\mu m\) and the radiance from the water vapor near 6\(\mu m\) has a temperature of 240 K. Because lower temperatures are related to higher altitudes, the satellite observed water vapor at lower altitudes near 8\(\mu m\) and water vapor at higher altitudes near 6\(\mu m\). Thus, the satellite can observe radiance from different depths in the atmosphere by using different wavelengths. Another example is the strong carbon dioxide and water vapor absorption near 15\(\mu m\) . At wavelengths near \(13 \mu m,\) the satellite is observing radiance mostly from CO2 and H2O from lower in the atmosphere because the emissivity of CO2 is less at those wavelengths. At wavelengths nearer 15\(\mu m\), the CO2 emissivity is much greater and the satellite is observing CO2 and H2O radiance from temperatures below 220 K and therefore much higher in the atmosphere, actually at the tropopause. Note the very narrow spike right in the middle of this strongly absorbing (and thus emitting) CO2absorption band. Why does the temperature go up? Answer: In this most strongly absorbing part of the band the satellite is seeing the CO2 radiance is coming from the stratosphere, which is warmer than the tropopause. Just to note - it's not that the CO2 and H2O at lower altitudes are not emitting in the 15 \(\mu m\)band - they are, but all of that radiance is being absorbed by the CO2 and H2O between the lower layers and the satellite and then these higher layers of CO2 and H2O are radiating, but only the layer that has no significant absorption above it can be observed by the satellite.
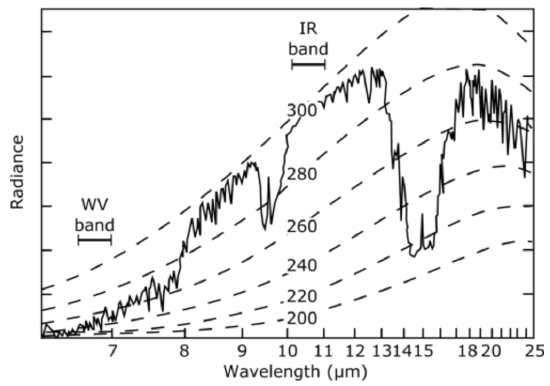
Infrared spectrum of Earth observed by a satellite. The spectrum extends from 6.0 µmµm to 25 µmµm for clear air over the tropical Western Pacific. Dashed lines are the Planck functions for objects at different temperatures from 300 K to 200 K. Where the measured radiance matches the dashed line the radiance came from water vapor and carbon dioxide at that temperature. Thus, if you know the atmospheric temperature profile, then you can guess at the altitude from which the radiance is coming (on average).
Credit: W. Brune (data from NOAA Star Center for Satellite Applications and Research)
Watch the following video (2:46) on infrared spectrum analysis:
Infrared Spectrum Analysis
- Click here for transcript of the Infrared Spectrum Analysis video.
-
Let's examine the wavelength spectrum of radiance observed by satellite looking down at a location on Earth. Because the absorptivity [INAUDIBLE] of different gases changes dramatically from 6 to 25 microns, the satellite is observing radiance from different types of matter at different wavelengths. The radiance depends on temperature. So once we know the radiance, we know the temperature of the object that is radiating. The Planck distribution functions spectral radiance is plotted per curves of different temperatures from 200 kelvin to 300 kelvin. Thus the radiance gives us the object's temperature. And since we have a rough idea about the temperature profile of the atmosphere, we can make a pretty good guess at the height of the radiating object and what is actually radiating, whether it be Earth's surface or a gas, like water vapor, carbon dioxide, or ozone. Between 8 and 13 microns, no infrared gas absorbs very well in the atmosphere, except for ozone around 9.6 microns. Note that the radiance in this window came from matter at a temperature near 300 kelvin or 27 degrees C. From the satellite's position, this radiance is known to come from the ocean, the Pacific. At the edges of the strong water vapor absorption bend at 6 microns, say, at about 7 and 1/2 microns, note that the radiating temperature is about 260 kelvin. This radiance must be coming from water vapor at 10,000 to 20,000 feet altitude. At 6 microns, the temperature is quite a bit lower. And so therefore, this radiance comes from water vapor at a much greater altitude in the atmosphere. In the CO2 absorption band near 15 microns, the radiance is equivalent to a temperature of 220 kelvin, which is from CO2 near the tropopause since this is the lowest radiating temperature that we see. Note that little spike in the middle of this strongly-absorbing CO2 band. It is coming from CO2 that is warmer than the tropopause, but we know that it must be coming from above the tropopause because the center of the CO2 band absorbs the strongest and thus, this radiance must be becoming from the CO2 higher than above the tropopause. It must be coming from the stratosphere. This makes sense that the stratosphere is warmer than the tropopause. So we can actually learn a lot about what is being observed simply by looking at a satellite thermal infrared spectrum, like this one.
Look at another scene, which is the top of a thunderstorm in the tropical western Pacific. Remember that reasonably thick clouds are opaque in the infrared and therefore act as infrared irradiance sources that radiate at the temperature of their altitude. The cloud's radiance was equivalent to Planck distribution function irradiance with a temperature of 220–210 K. This temperature occurs at an altitude just below the tropical tropopause, which means that this storm cloud reached altitudes of 14–16 km. Note that in the middle of the 15\(\mu m\) CO2 absorption band the satellite observed only the CO2 in the stratosphere (there is essentially no water vapor in the stratosphere). We know this because the radiance temperature is higher and the absorption is so strong that the radiance must be coming from higher altitudes closer to the satellite.

Infrared spectrum of Earth observed by a satellite. The spectrum extends from 6.5 µmµm to 25 µmµm for a thunderstorm over the tropical Western Pacific. Dashed lines are the Plank functions for objects at different temperatures from 300 K to 200 K. Remember that clouds are opaque in the infrared and therefore radiate with the Planck distribution function spectral irradiance.
Credit: W. Brune (data from NOAA Star Center for Satellite Applications and Research)
Let’s put all of this together.
- Water vapor, carbon dioxide, and ozone have banded absorption in the thermal infrared due to vibrational–rotational transitions governed by quantum mechanical rules.
- As the absorption decreases, the emissivity decreases. Thus, weakly absorbing gases are also weakly emitting at the same wavelength.
- By looking at different wavelengths either inside, outside, or near absorption bands, a satellite can detect radiation emitted at different heights within the atmosphere.
- In the middle of an absorption band, where the absorption is greatest, the optical path is also the greatest; at these wavelengths a satellite detects only the emissions from the nearest (and highest) layers because the lower ones produce radiation that is absorbed before reaching the satellite.
- In wavelength “windows” between absorption bands, the absorption is small so that the satellite can detect radiation emitted all the way down to the Earth’s surface.
- On the edges of absorption bands, for which the absorption is weak but still significant, satellites detect radiation emitted from the middle troposphere but not from the surface .
- The total radiance is strongly dependent on temperature:
\[I_{s}=\sigma T^{4}\]
- Thus, if a satellite detects only radiation emitted from the upper troposphere as a result of strong absorption below, its recorded radiance will correspond to temperatures of the upper troposphere (~ 200–220 K).
- If the satellite detects radiation emitted all the way down to Earth’s surface, then it will record a radiance with temperatures approaching that of the Earth’s surface.
- The water vapor \((6.7 \mu m)\) channel contains wavelengths at which water vapor absorption is fairly strong, and so it records radiation emitted from the middle troposphere but not below because there is always enough water vapor to absorb irradiance emitted by Earth's surface or the water vapor near Earth's surface. Because the distribution of water vapor is highly variable in time, horizontal position, and vertical position, satellites detect radiance originating from different depths in the atmosphere at different times and places. Basically, with a knowledge of temperature profiles and recorded radiances across the water vapor channel, the optical depths that result from water vapor can be retrieved and the relative humidities determined.
As I said earlier, by observing the CO2 radiance at different wavelengths, the satellite can be sampling CO2 radiance from different altitudes (see figure below . The top panel is the radiance from 12\(\mu m\) to 18\(\mu m\) centered on the strong 15\(\mu m \mathrm{CO}_{2}\) absorption band. Look at the wavelengths marked 1 through
4. The bottom left panel in the figure shows the absorptivity from the top of the atmosphere to a given pressure level as a function of pressure level at these four wavelengths. Note that for the most strongly absorbed wavelength, 1, the radiance of all the CO2 and H2O below a pressure level of about 150 hPa is completely absorbed. Thus, very little of the radiation received by the satellite comes from below this pressure level. On the other hand, very little of the radiance received from the satellite comes from above the 0.1 hPa pressure level because the absorptivity (and hence emissivity) there is zero. Thus, the radiance reaching space must primarily come from between the 150 and 0.1 hPa pressure levels. The panel on the lower right shows the relative contribution of each pressure level to the radiance that reaches space. For wavelength 1, we see that almost all radiance comes from the stratosphere.
Look at equation 7.6 to see that the absorption of lower layers is exponential so that there are no sharp layers that emit radiance at each wavelength, but instead, the radiance the satellite observes at any wavelength comes from a band that has soft edges. If we look at the wavelength at 2, 3, and 4, we see that the CO2 and H2O radiance comes from further down in the atmosphere. For wavelength 4, the satellite is observing radiance from Earth's surface as well as from the CO2 and H2O below about 500 hPa, whereas for the wavelength marked 3, the radiance is only slightly from Earth's surface—mostly from CO2and H2O in the middle troposphere.
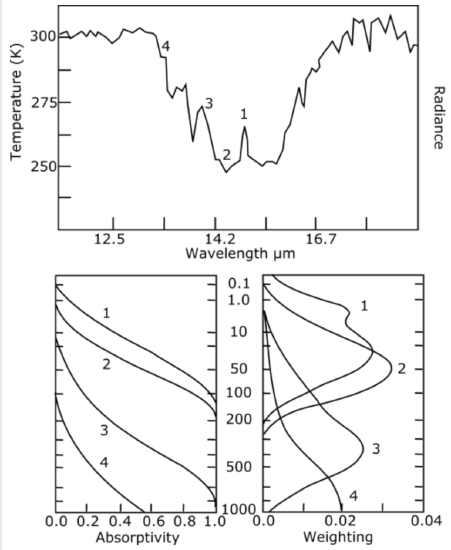
Top panel: Infrared spectrum of Earth observed by a satellite between about 12 imand 18\(\mu n\) Numbers 1 through 4 indicate wavelengths of decreasing absorption (i.e., 1 indicates a strongly absorbing wavelength and 4 indicates a weakly absorbing wavelength). Bottom left panel: Absorptivity from the top of the atmosphere to a given pressure level as a function of pressure level (hPa) for the four wavelengths indicated in the top panel. Bottom right panel: The weighting function for each of the four wavelengths, which gives the relative contribution of each pressure level to the radiance that makes it to space.
Credit: W. Brune (data from NOAA Star Center for Satellite Applications and Research)
Discussion Activity: Greenhouse Gases and Climate Change
(3 discussion points)
This week's discussion topic asks you to reflect on the impact of this lesson's material on your own thinking. Please answer the following question:
How has studying this lesson altered your thoughts about greenhouse gases and climate change?
If it has not, say why not.
Your posts need not be long, but they should tie back to the material in Lesson 7 (and Lesson 6).
- You can access the Greenhouse Gases and Climate Change Discussion in Canvas.
- Post a response that answers the question above in a thoughtful manner that draws upon course material and outside sources.
- Keep the conversation going! Comment on at least one other person's post. Your comment should include follow-up questions and/or analysis that might offer further evidence or reveal flaws.
This discussion will be worth 3 discussion points. I will use the following rubric to grade your participation:
Discussion Activity Grading Rubric
| Evaluation | Explanation | Available Points |
|---|---|---|
| Not Completed | Student did not complete the assignment by the due date. | 0 |
| Student completed the activity with adequate thoroughness. | Posting answers the discussion question in a thoughtful manner, including some integration of course material. | 1 |
| Student completed the activity with additional attention to defending his/her position. | Posting thoroughly answers the discussion question and is backed up by references to course content as well as outside sources. | 2 |
| Student completed a well-defended presentation of his/her position, and provided thoughtful analysis of at least one other student’s post. | In addition to a well-crafted and defended post, the student has also engaged in thoughtful analysis/commentary on at least one other student’s post as well. | 3 |
Quiz 7-2: Satellite remote sensing.
- Please note: there is no practice quiz for Quiz 7-2 because the questions and answers follow directly from the text.
- When you feel you are ready, take Quiz 7-2 in Canvas. You will be allowed to take this quiz only once. Good luck!