
17.10: Downslope Winds
- Page ID
- 10598

\( \newcommand{\vecs}[1]{\overset { \scriptstyle \rightharpoonup} {\mathbf{#1}} } \)
\( \newcommand{\vecd}[1]{\overset{-\!-\!\rightharpoonup}{\vphantom{a}\smash {#1}}} \)
\( \newcommand{\dsum}{\displaystyle\sum\limits} \)
\( \newcommand{\dint}{\displaystyle\int\limits} \)
\( \newcommand{\dlim}{\displaystyle\lim\limits} \)
\( \newcommand{\id}{\mathrm{id}}\) \( \newcommand{\Span}{\mathrm{span}}\)
( \newcommand{\kernel}{\mathrm{null}\,}\) \( \newcommand{\range}{\mathrm{range}\,}\)
\( \newcommand{\RealPart}{\mathrm{Re}}\) \( \newcommand{\ImaginaryPart}{\mathrm{Im}}\)
\( \newcommand{\Argument}{\mathrm{Arg}}\) \( \newcommand{\norm}[1]{\| #1 \|}\)
\( \newcommand{\inner}[2]{\langle #1, #2 \rangle}\)
\( \newcommand{\Span}{\mathrm{span}}\)
\( \newcommand{\id}{\mathrm{id}}\)
\( \newcommand{\Span}{\mathrm{span}}\)
\( \newcommand{\kernel}{\mathrm{null}\,}\)
\( \newcommand{\range}{\mathrm{range}\,}\)
\( \newcommand{\RealPart}{\mathrm{Re}}\)
\( \newcommand{\ImaginaryPart}{\mathrm{Im}}\)
\( \newcommand{\Argument}{\mathrm{Arg}}\)
\( \newcommand{\norm}[1]{\| #1 \|}\)
\( \newcommand{\inner}[2]{\langle #1, #2 \rangle}\)
\( \newcommand{\Span}{\mathrm{span}}\) \( \newcommand{\AA}{\unicode[.8,0]{x212B}}\)
\( \newcommand{\vectorA}[1]{\vec{#1}} % arrow\)
\( \newcommand{\vectorAt}[1]{\vec{\text{#1}}} % arrow\)
\( \newcommand{\vectorB}[1]{\overset { \scriptstyle \rightharpoonup} {\mathbf{#1}} } \)
\( \newcommand{\vectorC}[1]{\textbf{#1}} \)
\( \newcommand{\vectorD}[1]{\overrightarrow{#1}} \)
\( \newcommand{\vectorDt}[1]{\overrightarrow{\text{#1}}} \)
\( \newcommand{\vectE}[1]{\overset{-\!-\!\rightharpoonup}{\vphantom{a}\smash{\mathbf {#1}}}} \)
\( \newcommand{\vecs}[1]{\overset { \scriptstyle \rightharpoonup} {\mathbf{#1}} } \)
\(\newcommand{\longvect}{\overrightarrow}\)
\( \newcommand{\vecd}[1]{\overset{-\!-\!\rightharpoonup}{\vphantom{a}\smash {#1}}} \)
\(\newcommand{\avec}{\mathbf a}\) \(\newcommand{\bvec}{\mathbf b}\) \(\newcommand{\cvec}{\mathbf c}\) \(\newcommand{\dvec}{\mathbf d}\) \(\newcommand{\dtil}{\widetilde{\mathbf d}}\) \(\newcommand{\evec}{\mathbf e}\) \(\newcommand{\fvec}{\mathbf f}\) \(\newcommand{\nvec}{\mathbf n}\) \(\newcommand{\pvec}{\mathbf p}\) \(\newcommand{\qvec}{\mathbf q}\) \(\newcommand{\svec}{\mathbf s}\) \(\newcommand{\tvec}{\mathbf t}\) \(\newcommand{\uvec}{\mathbf u}\) \(\newcommand{\vvec}{\mathbf v}\) \(\newcommand{\wvec}{\mathbf w}\) \(\newcommand{\xvec}{\mathbf x}\) \(\newcommand{\yvec}{\mathbf y}\) \(\newcommand{\zvec}{\mathbf z}\) \(\newcommand{\rvec}{\mathbf r}\) \(\newcommand{\mvec}{\mathbf m}\) \(\newcommand{\zerovec}{\mathbf 0}\) \(\newcommand{\onevec}{\mathbf 1}\) \(\newcommand{\real}{\mathbb R}\) \(\newcommand{\twovec}[2]{\left[\begin{array}{r}#1 \\ #2 \end{array}\right]}\) \(\newcommand{\ctwovec}[2]{\left[\begin{array}{c}#1 \\ #2 \end{array}\right]}\) \(\newcommand{\threevec}[3]{\left[\begin{array}{r}#1 \\ #2 \\ #3 \end{array}\right]}\) \(\newcommand{\cthreevec}[3]{\left[\begin{array}{c}#1 \\ #2 \\ #3 \end{array}\right]}\) \(\newcommand{\fourvec}[4]{\left[\begin{array}{r}#1 \\ #2 \\ #3 \\ #4 \end{array}\right]}\) \(\newcommand{\cfourvec}[4]{\left[\begin{array}{c}#1 \\ #2 \\ #3 \\ #4 \end{array}\right]}\) \(\newcommand{\fivevec}[5]{\left[\begin{array}{r}#1 \\ #2 \\ #3 \\ #4 \\ #5 \\ \end{array}\right]}\) \(\newcommand{\cfivevec}[5]{\left[\begin{array}{c}#1 \\ #2 \\ #3 \\ #4 \\ #5 \\ \end{array}\right]}\) \(\newcommand{\mattwo}[4]{\left[\begin{array}{rr}#1 \amp #2 \\ #3 \amp #4 \\ \end{array}\right]}\) \(\newcommand{\laspan}[1]{\text{Span}\{#1\}}\) \(\newcommand{\bcal}{\cal B}\) \(\newcommand{\ccal}{\cal C}\) \(\newcommand{\scal}{\cal S}\) \(\newcommand{\wcal}{\cal W}\) \(\newcommand{\ecal}{\cal E}\) \(\newcommand{\coords}[2]{\left\{#1\right\}_{#2}}\) \(\newcommand{\gray}[1]{\color{gray}{#1}}\) \(\newcommand{\lgray}[1]{\color{lightgray}{#1}}\) \(\newcommand{\rank}{\operatorname{rank}}\) \(\newcommand{\row}{\text{Row}}\) \(\newcommand{\col}{\text{Col}}\) \(\renewcommand{\row}{\text{Row}}\) \(\newcommand{\nul}{\text{Nul}}\) \(\newcommand{\var}{\text{Var}}\) \(\newcommand{\corr}{\text{corr}}\) \(\newcommand{\len}[1]{\left|#1\right|}\) \(\newcommand{\bbar}{\overline{\bvec}}\) \(\newcommand{\bhat}{\widehat{\bvec}}\) \(\newcommand{\bperp}{\bvec^\perp}\) \(\newcommand{\xhat}{\widehat{\xvec}}\) \(\newcommand{\vhat}{\widehat{\vvec}}\) \(\newcommand{\uhat}{\widehat{\uvec}}\) \(\newcommand{\what}{\widehat{\wvec}}\) \(\newcommand{\Sighat}{\widehat{\Sigma}}\) \(\newcommand{\lt}{<}\) \(\newcommand{\gt}{>}\) \(\newcommand{\amp}{&}\) \(\definecolor{fillinmathshade}{gray}{0.9}\)Consider a wintertime situation of a layer of cold air under warm, with a synoptic weather pattern forcing strong winds toward a mountain range. Flow over ridge-top depends on cold-air depth, and on the strength of the temperature jump between the two layers. If conditions are right, fast winds, generically called fall winds, can descend along the lee slope. Sometimes these downslope winds are fast enough to cause significant destruction to buildings, and to affect air and land transportation. Downslope wind storms can be caused by mountain waves (previously discussed), bora winds, and foehns.
17.10.1. Bora
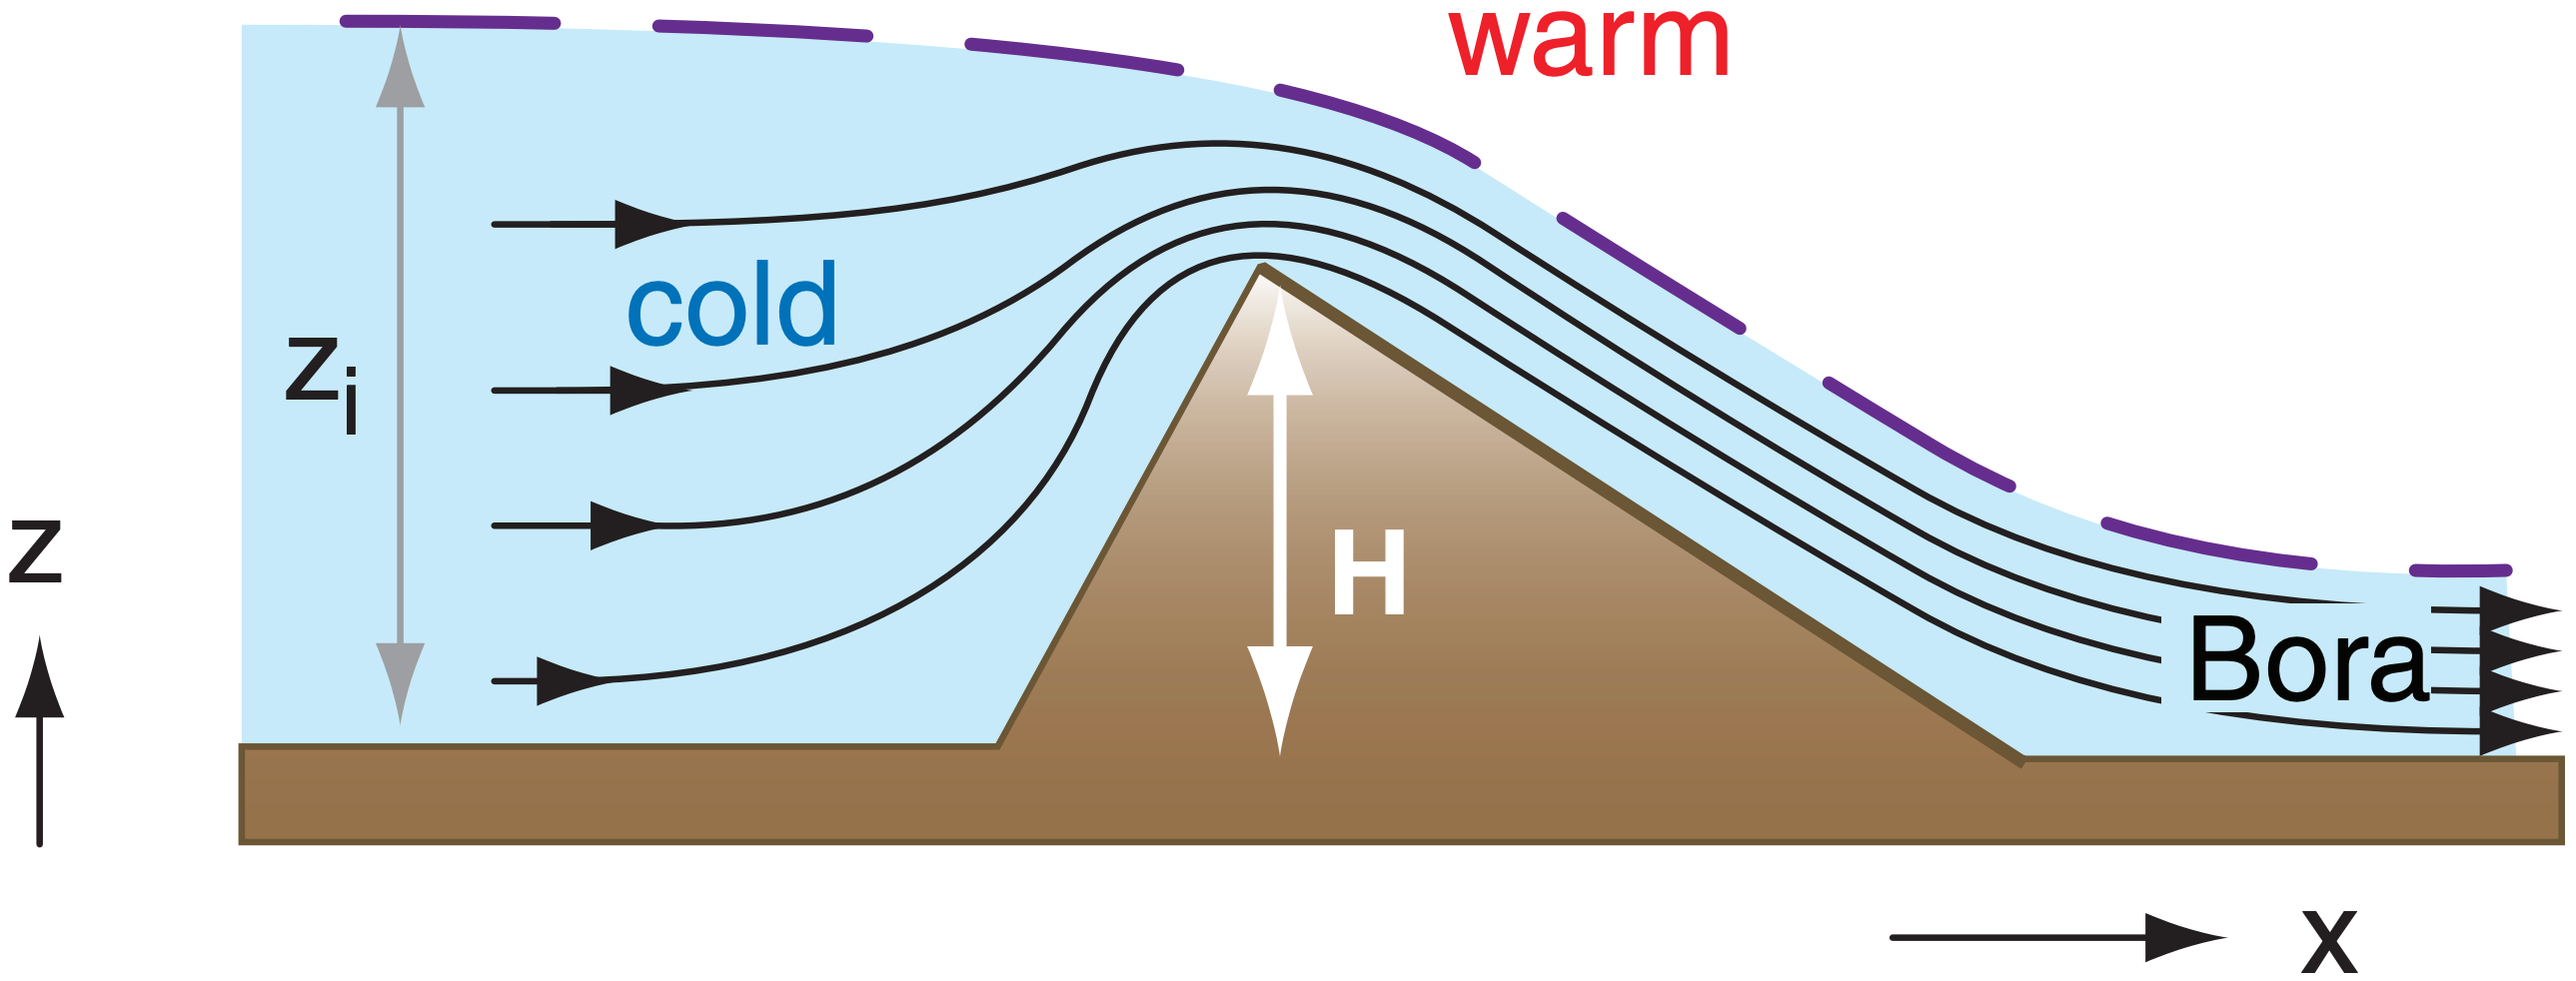
If the fast-moving cold air upstream is deeper than the ridge height H (Fig. 17.36), then very fast (hurricane force) cold winds can descend down the lee side. This phenomena is called a Bora. The winds accelerate in the constriction between mountain and the overlying inversion, and pressure drops according to the Venturi effect. The lower pressure upsets hydrostatic balance and draws the cold air layer downward, causing fast winds to hug the slope.
The overlying warmer air is also drawn down by this same pressure drop. Because work must be done to lower this warm air against buoyancy, Bernoulli’s equation tells us that the Bora winds decelerate slightly on the way down. Once the winds reach the lowland, they are still destructive and much faster than the winds upstream of the mountain, but are slower than the winds at ridge top. See the Sample Application for Bernoulli’s equation and Bora.
Boras were originally named for the cold fall wind along the Dalmatian coast of Croatia and Bosnia in winter, when cold air from Russia crosses the mountains and descends southwest toward the Adriatic Sea. The name Bora is used generally now for any cold fall wind having similar dynamics.
For situations where the average mountain ridge height is greater than zi but the mountain pass is lower than zi , boras can start in the pass (as a gap wind) and continue down the lee slope.
The difference between katabatic and Bora winds is significant. Katabatic winds are driven by the local thermal structure, and form during periods of weak synoptic forcing such as in high-pressure areas of fair weather and light winds. Over mid-latitude land, katabatic winds exist only at night and are usually weak, while on the slopes of Antarctica they can exist for days and can become strong. Boras are driven by the inertia of strong upstream winds that form in regions of low pressure and strong horizontal pressure gradient. They can last for several days. Although both phenomena are cold downslope winds, they are driven by different dynamics.
Sample Application
For the Bora situation of Fig. 17.36, the inversion of strength 6°C is 1200 m above the upstream lowland. Ridge top is 1000 m above the valley floor. If upstream winds are 10 m s–1, find the Bora wind speed in the lee lowlands.
Find the Answer
Given: H = 1 km, zi = 1.2 km, ∆θv = 6°C, Ms = 10 m s–1. Assume |g|/Tv = 0.0333 m·s–2·K–1
Find: MBora = ? m s–1
Volume conservation similar to eq. (17.23) gives ridge top winds Md:
\(\ M_{d}=\dfrac{z_{i}}{z_{i}-H} \cdot M_{s}=60 \mathrm{m} / \mathrm{s}\)
Assume Bora thickness = constant = zi – H .
Follow the streamline indicated by the thick dashed line in Fig. 17.36. Assume ending pressure equals starting pressure on this streamline.
Use Bernoulli’s eq. (17.37):
\(\ \left[\dfrac{1}{2} M^{2}+|g| \dfrac{\Delta \theta_{v}}{T_{v}} \cdot z\right]_{r i d g e t o p}=\left[\dfrac{1}{2} M^{2}+|g| \dfrac{\Delta \theta_{v}}{T_{v}} \cdot z\right]_{B o r a}\)
Combine the above eqs. Along the streamline, zridgetop = zi , and zBora = zi – H. Thus ∆z = H. Solve for MBora:
\(\ M_{B o r a}=\left[\left(\dfrac{z_{i}}{z_{i}-H}\right)^{2} \cdot M_{s}^{2}-2 \cdot \dfrac{|g|}{T_{v}} \cdot \Delta \theta_{v} \cdot H\right]^{1 / 2}\)
Finally, we can plug in the numbers: MBora =\(\ \sqrt{\left(\dfrac{1.2 \mathrm{km}}{0.2 \mathrm{km}}\right)^{2}\left(10 \dfrac{\mathrm{m}}{\mathrm{s}}\right)^{2}-2 \cdot\left(0.033 \dfrac{\mathrm{m}}{\mathrm{s}^{2} \mathrm{K}}\right) \cdot(6 \mathrm{K}) \cdot(1000 \mathrm{m})}\)
\(\ =\sqrt{(3600-400) m^{2} s^{-1}}=\underline{\bf{56.6 m s^{-1}}}\)
Check: Units OK. Physics OK.
Exposition: Winds at ridge top were 60 m s–1. Although the Bora winds at the lee lowlands are weaker than ridge top, they are still strong and destructive. Most of the wind speed up was due to volume conservation, with only a minor decrease given by Bernoulli’s equation. This decrease is because kinetic energy associated with wind speed must be expended to do work against gravity by moving warm inversion air downward.
17.10.2. Foehns and Chinooks
A warm, dry downslope wind is called a Foehn. Foehn wind onset can be accompanied by a very rapid temperature increase at the surface. If the warm and dry air flows over snowy ground, it rapidly melts and sublimates the snow (“snow eater”). In summer, the hot Foehn exacerbates forest fires.
Foehn winds were originally named for the southerly winds from Italy that blow over the Alps and descend in Austria, Germany, and Switzerland. Other names in different parts of the world are chinook (east of the Rocky Mountains in N. America), Santa Ana (S. California), zonda (Argentina), austru (Romania), and aspre (France). Foehns can be created by different processes in different locations.
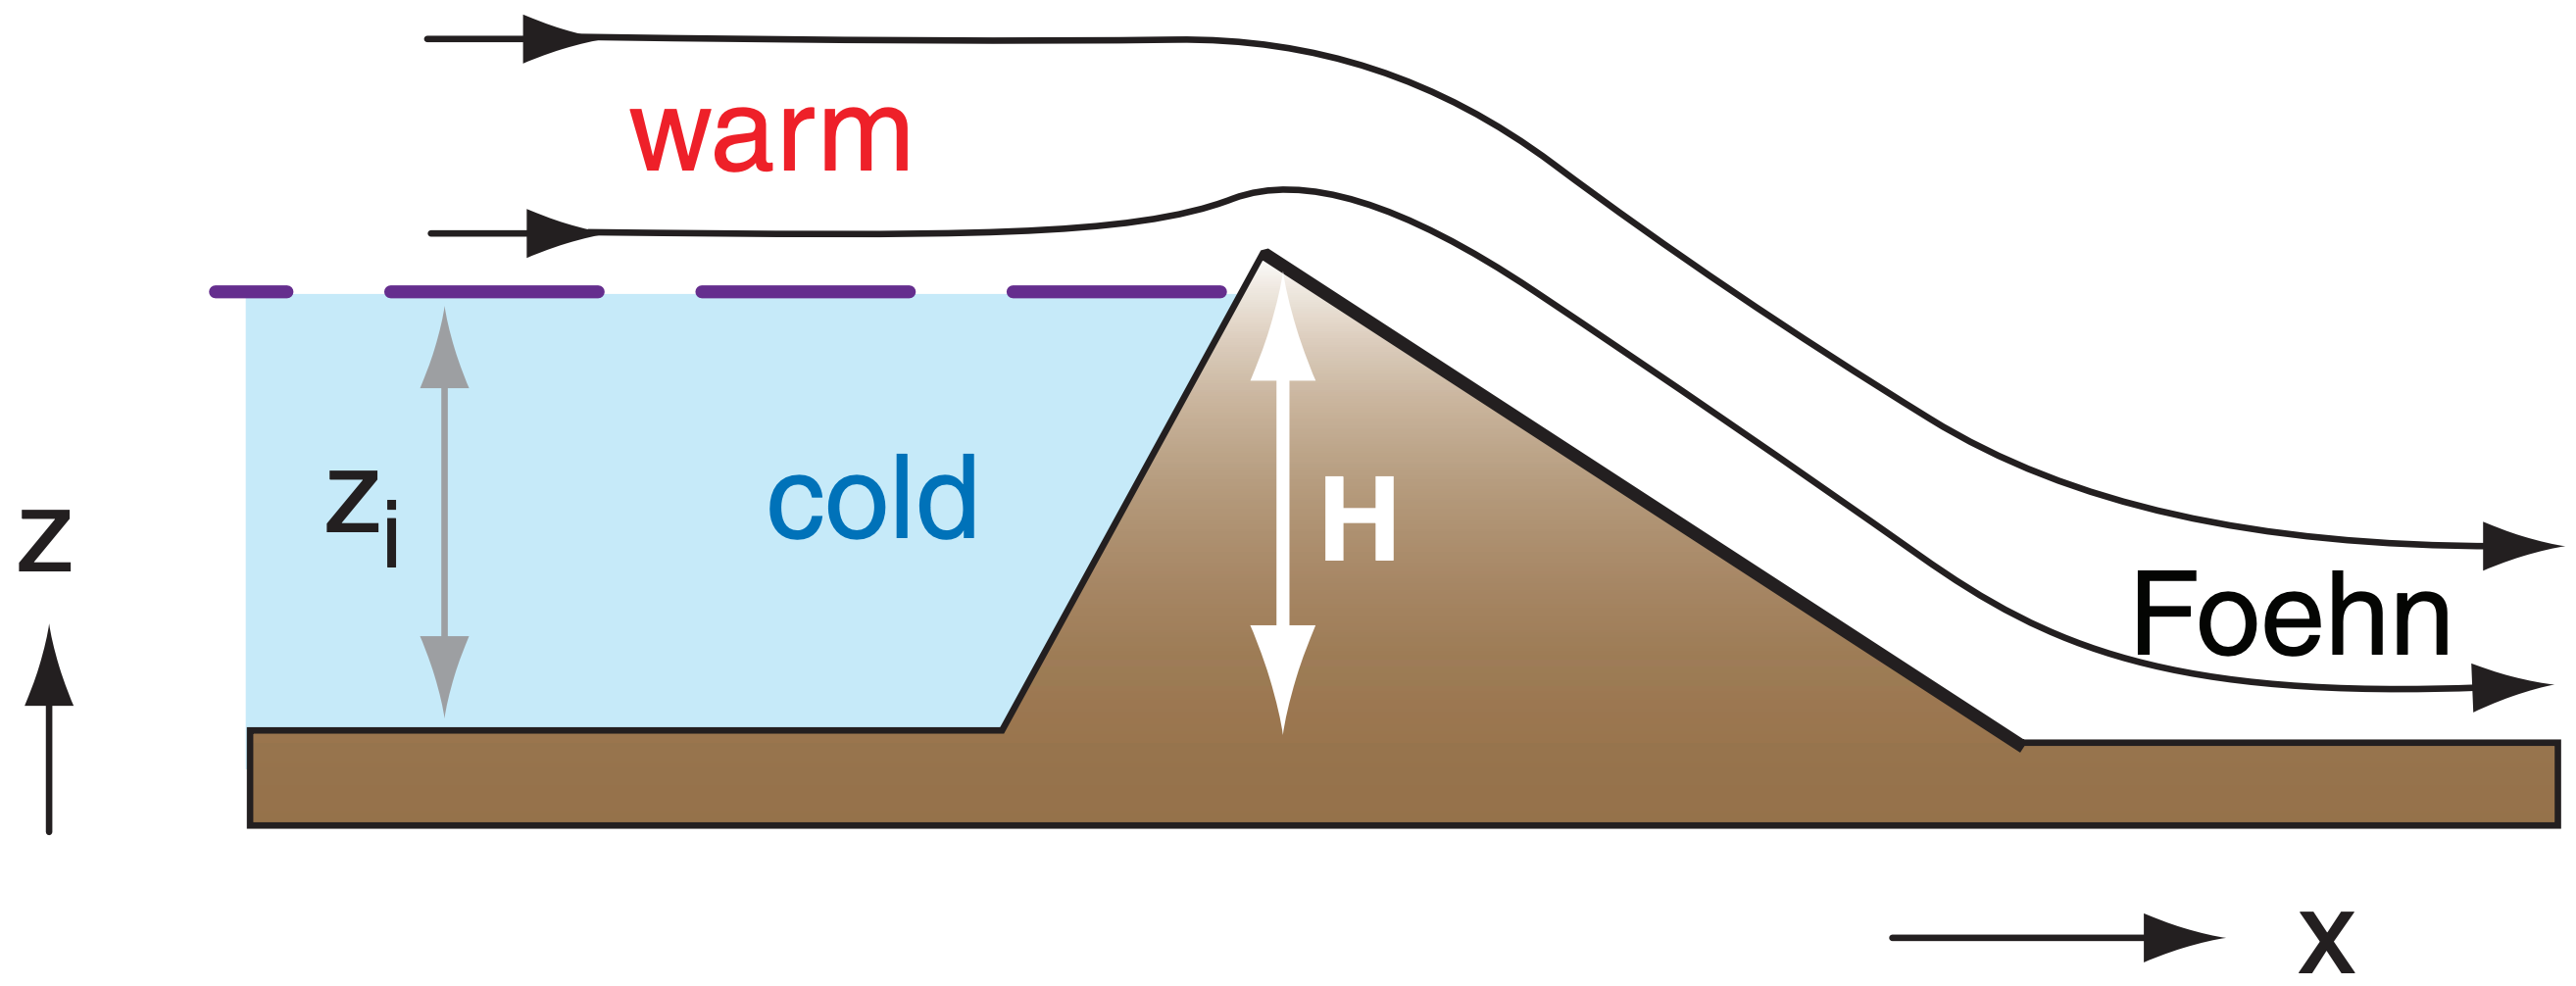
One mechanism for creating Foehn winds does not require clouds and precipitation. If the mountain height H is greater than the thickness zi of cold air upstream, then the cold air is dammed behind the mountain and does not flow over (Fig. 17.37). The strong warm winds aloft can flow over the ridge top, and can warm further upon descending adiabatically on the lee side.
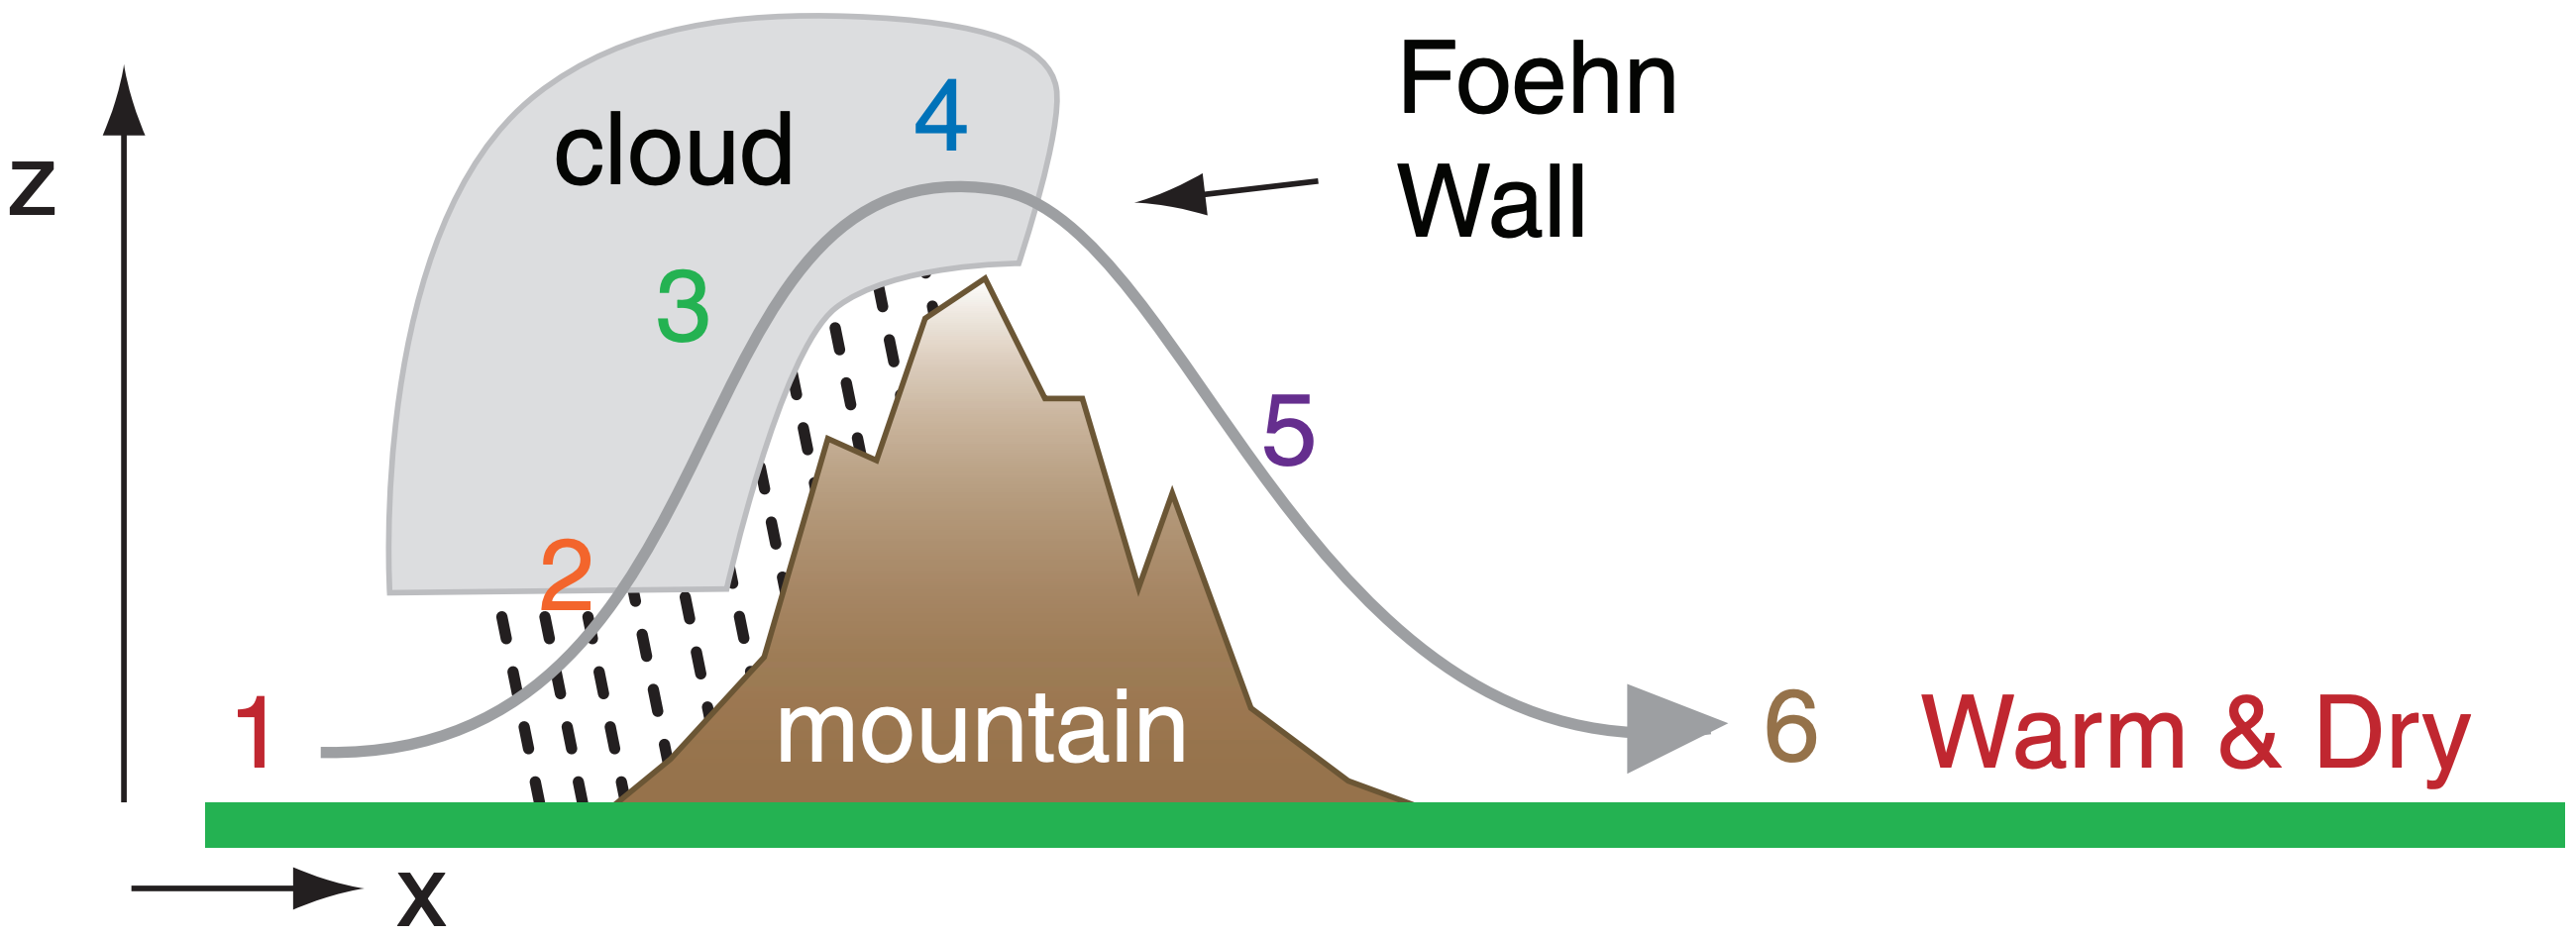
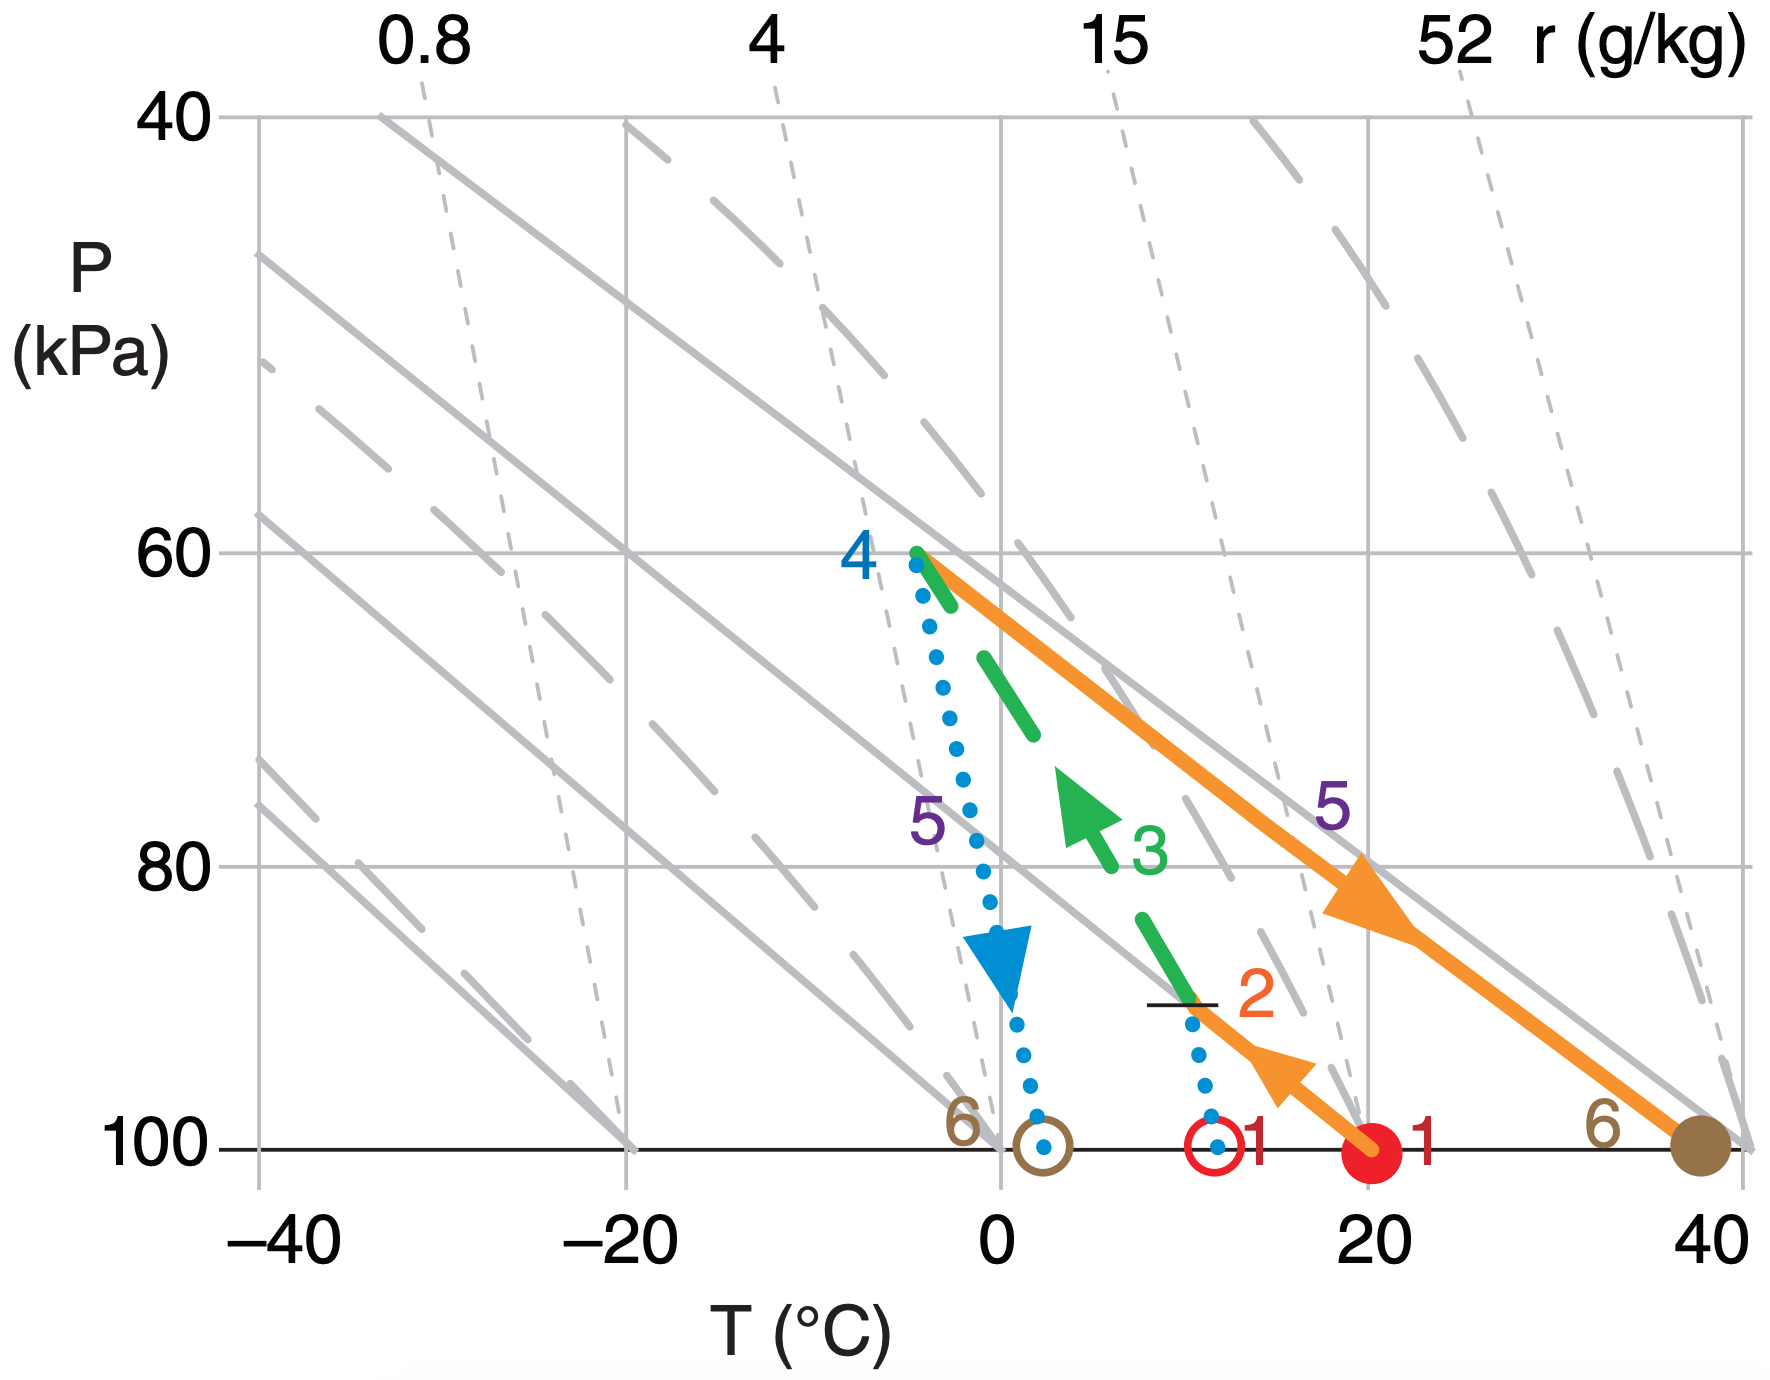
A second Foehn mechanism is based on net latent heating associated with condensation and precipitation on the upwind side of the mountain range. Consider an air parcel before it flows over a mountain, such as indicated at point (1) in Fig. 17.38. Suppose that the temperature is 20°C and dew point is 10°C initially, as indicated by the filled and open circles at point (1) in Fig. 17.39. This corresponds to about 50% relative humidity.
As the air rises along the windward slopes, it cools dry-adiabatically while conserving mixing ratio until the lifting condensation level (LCL) is reached (2). Further lifting is moist adiabatic (3) within the orographic cloud (a cloud caused by the terrain). Suppose that most of the condensed water falls out as precipitation on the windward slopes.
Over the summit (4), suppose that the air has risen to a height where the ambient pressure is 60 kPa. The air parcel now has a temperature of about –8°C. As it begins to descend down the lee side, any residual cloud droplets will quickly evaporate in the adiabatically warming air. The trailing edge of the orographic cloud is called a Foehn wall, because it looks like a wall of clouds when viewed from the lowlands downwind.
Continued descent will be dry adiabatic (5) because there are no liquid water drops to cause evaporative cooling. By the time the air reaches its starting altitude on the lee side (6), its temperature has warmed to about 35°C, with a dew point of about –2°C. This is roughly 10% relative humidity.
The net result of this process is: clouds and precipitation form on the windward slopes of the mountain, a Foehn wall forms just downwind of the mountain crest, and there is warming and drying in the lee lowlands.
A third Foehn mechanism is where obstacle wake turbulence (Fig. 17.30d) mixes warm air downward from an elevated temperature inversion.
Sample Application
Air from the Pacific Ocean (T =5°C, Td = 3°C, z = 0) flows over the Coast Mountains (z ≈ 3000 m), and descends toward the interior plateau of British Columbia, Canada (z ≈1000 m). Fig. 17.19 shows the topography of this region. Find the final T and Td.
Find the Answer
Given: T = 5 °C, Td = 3 °C, z = 0 m initially.
Find: T = ? °C, Td = ? ° at z = 1000 m finally.
Use the thermo diagram from chapter 5:
Use the thermo diagram to find that the initial mixing ratio is r ≈ 5 g kg–1. Clouds form as the air rises over the mountains, with base at zLCL = (0.125 km °C–1)·(5–3°C) = 0.25 km. From there to z = 3000 m, the air follows a moist adiabat, reaching T = Td ≈ –17°C.
Assuming all condensate falls out as precipitation on the windward side, the air then descends dry-adiabatically to the town of Williams Lake. The final state is: T ≈ 4°C at z = 1000 m, and Td ≈ –13°C.
Check: Units OK. Physics OK.
Exposition: The air is much drier (RH ≈ 25%) on the lee side, but nearly the same temperature as initially. This is typical of a foehn wind.