
1.13: Lab 13 - Plate Tectonics
- Page ID
- 25337
\( \newcommand{\vecs}[1]{\overset { \scriptstyle \rightharpoonup} {\mathbf{#1}} } \)
\( \newcommand{\vecd}[1]{\overset{-\!-\!\rightharpoonup}{\vphantom{a}\smash {#1}}} \)
\( \newcommand{\id}{\mathrm{id}}\) \( \newcommand{\Span}{\mathrm{span}}\)
( \newcommand{\kernel}{\mathrm{null}\,}\) \( \newcommand{\range}{\mathrm{range}\,}\)
\( \newcommand{\RealPart}{\mathrm{Re}}\) \( \newcommand{\ImaginaryPart}{\mathrm{Im}}\)
\( \newcommand{\Argument}{\mathrm{Arg}}\) \( \newcommand{\norm}[1]{\| #1 \|}\)
\( \newcommand{\inner}[2]{\langle #1, #2 \rangle}\)
\( \newcommand{\Span}{\mathrm{span}}\)
\( \newcommand{\id}{\mathrm{id}}\)
\( \newcommand{\Span}{\mathrm{span}}\)
\( \newcommand{\kernel}{\mathrm{null}\,}\)
\( \newcommand{\range}{\mathrm{range}\,}\)
\( \newcommand{\RealPart}{\mathrm{Re}}\)
\( \newcommand{\ImaginaryPart}{\mathrm{Im}}\)
\( \newcommand{\Argument}{\mathrm{Arg}}\)
\( \newcommand{\norm}[1]{\| #1 \|}\)
\( \newcommand{\inner}[2]{\langle #1, #2 \rangle}\)
\( \newcommand{\Span}{\mathrm{span}}\) \( \newcommand{\AA}{\unicode[.8,0]{x212B}}\)
\( \newcommand{\vectorA}[1]{\vec{#1}} % arrow\)
\( \newcommand{\vectorAt}[1]{\vec{\text{#1}}} % arrow\)
\( \newcommand{\vectorB}[1]{\overset { \scriptstyle \rightharpoonup} {\mathbf{#1}} } \)
\( \newcommand{\vectorC}[1]{\textbf{#1}} \)
\( \newcommand{\vectorD}[1]{\overrightarrow{#1}} \)
\( \newcommand{\vectorDt}[1]{\overrightarrow{\text{#1}}} \)
\( \newcommand{\vectE}[1]{\overset{-\!-\!\rightharpoonup}{\vphantom{a}\smash{\mathbf {#1}}}} \)
\( \newcommand{\vecs}[1]{\overset { \scriptstyle \rightharpoonup} {\mathbf{#1}} } \)
\( \newcommand{\vecd}[1]{\overset{-\!-\!\rightharpoonup}{\vphantom{a}\smash {#1}}} \)
\(\newcommand{\avec}{\mathbf a}\) \(\newcommand{\bvec}{\mathbf b}\) \(\newcommand{\cvec}{\mathbf c}\) \(\newcommand{\dvec}{\mathbf d}\) \(\newcommand{\dtil}{\widetilde{\mathbf d}}\) \(\newcommand{\evec}{\mathbf e}\) \(\newcommand{\fvec}{\mathbf f}\) \(\newcommand{\nvec}{\mathbf n}\) \(\newcommand{\pvec}{\mathbf p}\) \(\newcommand{\qvec}{\mathbf q}\) \(\newcommand{\svec}{\mathbf s}\) \(\newcommand{\tvec}{\mathbf t}\) \(\newcommand{\uvec}{\mathbf u}\) \(\newcommand{\vvec}{\mathbf v}\) \(\newcommand{\wvec}{\mathbf w}\) \(\newcommand{\xvec}{\mathbf x}\) \(\newcommand{\yvec}{\mathbf y}\) \(\newcommand{\zvec}{\mathbf z}\) \(\newcommand{\rvec}{\mathbf r}\) \(\newcommand{\mvec}{\mathbf m}\) \(\newcommand{\zerovec}{\mathbf 0}\) \(\newcommand{\onevec}{\mathbf 1}\) \(\newcommand{\real}{\mathbb R}\) \(\newcommand{\twovec}[2]{\left[\begin{array}{r}#1 \\ #2 \end{array}\right]}\) \(\newcommand{\ctwovec}[2]{\left[\begin{array}{c}#1 \\ #2 \end{array}\right]}\) \(\newcommand{\threevec}[3]{\left[\begin{array}{r}#1 \\ #2 \\ #3 \end{array}\right]}\) \(\newcommand{\cthreevec}[3]{\left[\begin{array}{c}#1 \\ #2 \\ #3 \end{array}\right]}\) \(\newcommand{\fourvec}[4]{\left[\begin{array}{r}#1 \\ #2 \\ #3 \\ #4 \end{array}\right]}\) \(\newcommand{\cfourvec}[4]{\left[\begin{array}{c}#1 \\ #2 \\ #3 \\ #4 \end{array}\right]}\) \(\newcommand{\fivevec}[5]{\left[\begin{array}{r}#1 \\ #2 \\ #3 \\ #4 \\ #5 \\ \end{array}\right]}\) \(\newcommand{\cfivevec}[5]{\left[\begin{array}{c}#1 \\ #2 \\ #3 \\ #4 \\ #5 \\ \end{array}\right]}\) \(\newcommand{\mattwo}[4]{\left[\begin{array}{rr}#1 \amp #2 \\ #3 \amp #4 \\ \end{array}\right]}\) \(\newcommand{\laspan}[1]{\text{Span}\{#1\}}\) \(\newcommand{\bcal}{\cal B}\) \(\newcommand{\ccal}{\cal C}\) \(\newcommand{\scal}{\cal S}\) \(\newcommand{\wcal}{\cal W}\) \(\newcommand{\ecal}{\cal E}\) \(\newcommand{\coords}[2]{\left\{#1\right\}_{#2}}\) \(\newcommand{\gray}[1]{\color{gray}{#1}}\) \(\newcommand{\lgray}[1]{\color{lightgray}{#1}}\) \(\newcommand{\rank}{\operatorname{rank}}\) \(\newcommand{\row}{\text{Row}}\) \(\newcommand{\col}{\text{Col}}\) \(\renewcommand{\row}{\text{Row}}\) \(\newcommand{\nul}{\text{Nul}}\) \(\newcommand{\var}{\text{Var}}\) \(\newcommand{\corr}{\text{corr}}\) \(\newcommand{\len}[1]{\left|#1\right|}\) \(\newcommand{\bbar}{\overline{\bvec}}\) \(\newcommand{\bhat}{\widehat{\bvec}}\) \(\newcommand{\bperp}{\bvec^\perp}\) \(\newcommand{\xhat}{\widehat{\xvec}}\) \(\newcommand{\vhat}{\widehat{\vvec}}\) \(\newcommand{\uhat}{\widehat{\uvec}}\) \(\newcommand{\what}{\widehat{\wvec}}\) \(\newcommand{\Sighat}{\widehat{\Sigma}}\) \(\newcommand{\lt}{<}\) \(\newcommand{\gt}{>}\) \(\newcommand{\amp}{&}\) \(\definecolor{fillinmathshade}{gray}{0.9}\)This lab contains potentially inaccessible interactive resources. Please work with your instructor and local campus resources to identify accommodations for these resources.
- Distinguish between oceanic and continental tectonic plates.
- Diagram a cross-section of the Earth.
- Identify the three types of plate tectonic boundaries.
- Explain how oceanic hotspots create chains of volcanic islands.
- Compare hotspots to plate tectonic boundary types.
- Identify geographic examples of different plate tectonic boundaries and hotspots.
- Explain why plate tectonics theory is the unifying theory of geology.
Introduction
The Earth’s crust is broken up into large slabs of slowly moving rock called tectonic plates. Plate tectonic movements cause earthquakes, volcanoes, and mountain building events. By understanding tectonic plates and the theory that explains their movement, you will be able to explain why different places experience earthquakes, why volcanoes are located where they are, and how the world’s mountain chains were created. For this reason, plate tectonics theory is known as the unifying theory of geology. An understanding of plate tectonics is fundamental to understanding the dynamic planet that we call home.
In the early 1960s, the emergence of the theory of plate tectonics started a revolution in the earth sciences. Since then, scientists have verified and refined this theory, and now have a much better understanding of how our planet has been shaped by plate tectonic processes. We now know that, directly or indirectly, plate tectonics influence nearly all geologic processes, past and present. Indeed, the notion that the entire Earth's surface is continually shifting has profoundly changed the way we view our world. People benefit from, and are at the mercy of, the forces and consequences of plate tectonics. With little or no warning, an earthquake or volcanic eruption can unleash bursts of energy far more powerful than anything we can generate. While we have no control over plate tectonic processes, we now have the knowledge to learn from them. The more we know about plate tectonics, the better we can appreciate the grandeur and beauty of the land upon which we live, as well as the occasional violent displays of the Earth's awesome power.[225]
Part A. Tectonic Plates
Tectonic plates, also called lithospheric plates, are the rigid outer surface of our planet. These plates push against each other, pull apart from each other, or slide past each other. Over 300 to 500 million-year cycles, tectonic plate movements cause the continents to collide to form one large landmass called a “supercontinent”. Pangaea, the most recent supercontinent in Earth’s history, formed approximately 335 million years ago and started breaking apart approximately 175 million years ago. Figure 13.1 shows a simplified map of Earth’s current major tectonic plates and their boundaries. The arrows on the map show the direction the plates are moving. Compare the plate tectonics map (Figure 13.1) to the world map (Figure 13.2). Notice that some of the tectonic plates have oceans above them while others are composed of the continents. These are the two main types of tectonic plates: continental and oceanic.


- Refer to Figure 13.1.
- What are the names of the large continental plates that surround the Pacific oceanic plate?
- What are the names of the smaller oceanic plates that surround the Pacific oceanic plate?
- Along the California coast, do the arrows show the oceanic Pacific Plate converging (arrows pointed into each other), diverging (arrows pointed away from each other), or sliding past (arrows pointed in opposite directions) in relation to the North American plate?
- What is the name of the oceanic plate that is found between the oceanic Pacific plate and the continental South American plate?
Part B. Earth’s Interior
In order to understand the movements of tectonic plates, we need to take a look at Earth’s interior. Figure 13.3 is a cross-section of the Earth.
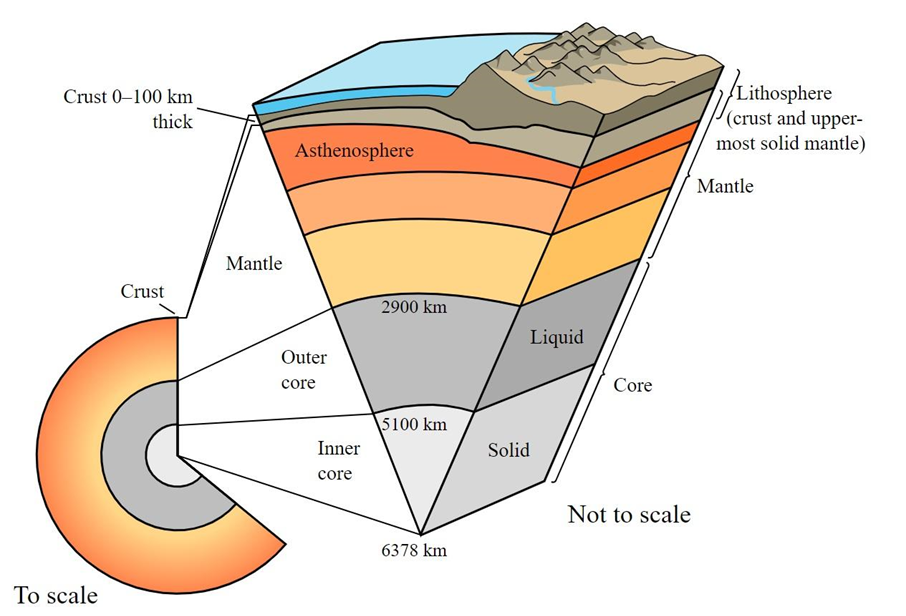
At the center of the Earth is a dense metallic core. The inner core is solid, while the outer core is liquid. Heat from the inner core causes the outer core to convect (recall that convection is the transfer of heat by movement). The Earth’s mantle surrounds the core, which also convects heat. While most of the mantle is solid rock, there is a layer of the upper mantle called the asthenosphere. The asthenosphere is partially molten, which means that it is partially melted. Sitting above the asthenosphere is a rigid part of the upper mantle.
The Earth’s crust is above the mantle. Oceanic crust is thinner and denser than the continental crust. The lithosphere is the rigid part of the upper mantle and the crust. The lithosphere averages approximately 100 kilometers (~62 miles) in thickness with an approximate minimum thickness of 40 kilometers (~25 miles) and an approximate maximum thickness of 280 kilometers (~174 miles). Oceanic lithosphere is thinner and denser than continental lithosphere. (Density is mass per unit volume). The oceanic crust averages approximately 6 kilometers (~4 miles) in thickness. The density of oceanic crust averages at 3.0 grams per centimeters cubed (g/cm3) and the continental crust has an average density of 2.7 g/cm3. For comparison, aluminum has the same average density as the continental crust: 2.7 g/cm3.
The lithosphere sits on top of the partially molten asthenosphere, so the lithospheric plates move because the asthenosphere moves and convects. This is the heart of plate tectonics theory; the rigid surface of the Earth (the upper-most part of the mantle and the crust, called tectonic plates or lithospheric plates) move according to movements in the asthenosphere.
- Sketch and label a cross-section of the Earth, as shown in Figure 13.3. Include the following components: solid inner core, liquid outer core, lower mantle, upper mantle, asthenosphere, upper-most solid mantle, oceanic crust, continental crust, and lithosphere. Tip: remember that the asthenosphere is a layer in the upper mantle that does not come in contact with the crust.
The Moho is the boundary between the crust and the mantle in the Earth. This is a depth where seismic waves change velocity; there is also a change in chemical composition. This is also called the Mohorovicic' discontinuity after the Croatian seismologist Andrija Mohorovicic' (1857-1936) who discovered it. The boundary is between 25 and 60 km deep beneath the continents and between 5 and 8 km deep beneath the ocean floor.[229]
- Use a highlighter to trace the Moho on the diagram you sketched for question 2 above.
To help you understand how movements in the asthenosphere cause tectonic plate movements, let’s take a look at one model of convection cells in the Earth’s mantle (Figure 13.4). Figure 13.4 represents the “whole mantle” convection model wherein the convection cells extend from the asthenosphere to the mantle-outer core boundary. Notice that at the center of the diagram the arrows point upward. This represents heat transferring upward from the outer core. As the heat moves toward the surface of the Earth, it diverges to form two distinct convection cells. The asthenosphere spreads in opposite directions from the center of the diagram, which causes the lithosphere above it to move apart, creating a ridge. On the outer edges of the convection cells, the lithosphere dives into the Earth, forming trenches. Note that the layers of the Earth are not drawn to scale in Figure 13.4.

- Tension is the stress that causes the lithosphere to pull apart. Where do you see the result of tension in Figure 13.4?
- Compression is the stress that causes the lithosphere to push together. Where do you see the result of compression in Figure 13.4?
 Check It Out! A Deeper Dive into Earth’s Layers
Watch this video called Layers of the Earth—What are they? How were they found? from IRIS Earthquake Science to learn how scientists have come to understand Earth’s interior. (Video length is 6:20).
A second model of convection, called the double-layered model (or the “layer cake” model), provides for two layers of convection (Figure 13.5). The top layer represents dynamic convection that occurs in the upper mantle to a depth of about 1,000 kilometers (~410 miles). The bottom layer represents less defined convection cells that move slowly from the lower mantle to the upper mantle. Note that the layers of the Earth are not drawn to scale in Figure 13.5.

Scientists are actively researching the convection cells in the mantle and asthenosphere in order to determine if one of these two models best represents the convection occurring inside the Earth. Some research points to a third model wherein all convection occurs shallowly in the asthenosphere. It’s possible that further research will provide another model of convection, or that no single model explains the convection cells. This is an exciting area of research that continues to inform our understanding of the planet we call home.
- Use Your Critical Thinking Skills: List the reasons why scientists debate the different convection models. Tip: consider the methods that scientists have to research deep into the Earth.
Part C. Tectonic Plate Boundaries
The edges where different tectonic plates meet are called plate tectonic boundaries. There are three types of boundaries as follows:
➢ Convergent, caused by compressional stress whereby plates are pushed towards each other.
➢ Divergent, caused by tensional stress whereby plates are pulled apart.
➢ Transform, caused by shear stress whereby plates slide past each other.
Remember that the reasons why a plate tectonic boundary is either convergent, divergent, or transform is due to the asthenosphere and the convection cells in the Earth’s mantle. When two convections cells converge, a convergent boundary is found. When two convection cells diverge, a divergent boundary is found.
In order to better understand the three main plate tectonic boundary types, you will access an online map and answer the following questions.[232]
Step 1
 Go to the Cracked Plates Earth Science GeoInquiry by Esri.
Step 2
Look at the legend on the left.
- What does a red line represent?
- What does a blue line represent?
- What does a dark gray line represent?
- Use three colors to draw and label the plate tectonic boundaries on the map provided in Appendix 13.1. Refer to Figure 13.1 to label each tectonic plate name. Be sure to include a legend.
Step 3
Zoom in on California.
- What type of tectonic plate boundary extends from the Gulf of California to Northern California?
Step 4
Use the measure tool to find the distance of the transform plate boundary from the U.S.-Mexico border to where it meets the Pacific Ocean west of Six Rivers National Forest in Northern California. Follow steps A through E to use the measure tool.
- Above the map, click on Measure.
- Click on the ruler icon to measure distance.
- Click on the location where the transform plate boundary begins at the U.S.-Mexico border.
- Click along the transform plate boundary, following the line of the boundary.
- Double-click once you reach where the transform plate boundary meets the Pacific Ocean.
- What is the approximate length of the transform plate boundary in California? Tip: be sure to indicate miles or kilometers in your answer. Note: this boundary represents the San Andreas Fault Complex.
- What type of tectonic plate boundary is found in Northern California (from Six Rivers National Forest to north of Eureka)?
- What type of tectonic plate boundary is found in the Gulf of California?
- Apply What You Learned: Do you think that Baja was once attached to mainland Mexico? Why or why not?
Step 5
Zoom out so that the world is in view.
Step 6
Click on Content on the left-side of the window.
Step 7
Click on "Global Quakes of Large Magnitude 5.8 or Greater" checkbox.
- Describe the patterns of earthquakes. Where are the earthquakes located? (Your response should be at least two sentences in length).
Step 8
Uncheck "Global Quakes of Large Magnitude 5.8 or Greater".
Step 9
Click on the "Absolute Plate Motions" checkbox. This is showing the distance in millimeters that a plate moves in one year.
- Which tectonic plate has the highest rates of plate movement?
- What is the range in millimeters shown for this tectonic plate?
Step 10
Uncheck "Absolute Plate Motions".
Step 11
Zoom in on South America and click on the "South American Quakes" checkbox.
Step 12
When you hover over the South American Quakes heading on the left (next to the checkbox), you see additional options. Click on the table icon to show the data table.
Step 13
Review the data in the table. Features means the number of earthquakes shown on the map.
- How many earthquakes (features) are shown?
Step 14
Click on Year and sort both ascending and descending so that you can see the range of years that the data includes.
- What years of data are included in the table?
Step 15
Click on Magnitude and sort by both ascending and descending so that you can see the range of magnitudes.
- What is the range of earthquake magnitudes included in the table?
Step 16
Click on Depth and sort both by ascending and descending so that you can see the range of depths (data is shown in kilometers).
- What is the range of earthquake depths included in the table?
Step 17
Analyze the location of the South American earthquakes.
- What type of plate tectonic boundary is found where most of the earthquakes occurred?
- Do all of the earthquakes occur right on the boundary?
Step 18
When you hover over the South American Quakes heading on the left (next to the checkbox), you see additional options. Click on the Change Style icon (it is the three shapes - triangle, square, and circle).
Step 19
Next to 1, change "Show location only" to "Depth".
Step 20
Click the blue "DONE" button.
Step 21
Analyze the location of the deepest earthquakes.
- Explain the location of the deepest earthquakes based on the plate tectonic boundary type. Include a labeled cross-section sketch of the boundary type.
Step 22
Uncheck the South American Quakes box and zoom out so that the world is in view.
- Zoom in on each mountain range and identify the plate tectonic boundary type to complete Table 13.1. Include whether the boundaries are between oceanic and/or continental plates. The first mountain range, the Andes Mountains, is completed as an example.
| Active Mountain Range | Continent | Tectonic Plate Boundary Type |
|---|---|---|
|
Andes Mountains |
South America |
Oceanic-continental convergent |
|
Himalayan Mountains |
||
|
Tian Shan Mountains |
||
|
Alaska Range |
Along with earthquake activity and the locations of mountain ranges, we can explain the locations of volcanoes around the world based on plate tectonics theory. Let’s look at another online map to look for spatial patterns of volcanic activity along plate boundaries.[233]
Step 1
 Go to the Plate Type Effect on Volcanoes Earth Science GeoInquiry by Esri.
Step 2
On the panel to the left of the map, there is an option to “Show Contents of Map” (hover your mouse over the icons to find it). Click the icon to show the contents of the map.
Step 3
Check the box next to Plate Boundaries.
Step 4
Underneath where it says Plate Boundaries, click on the icon on the far-left to view the legend (when you hover your mouse over the icon, it says Show Legend).
Step 5
Check the box next to Global Volcanoes.
Step 6
Underneath where it says Global Volcanoes, click on the icon on the far-left to view the legend (when you hover your mouse over the icon, it says Show Legend).
- Do the majority of volcanoes occur along plate tectonic boundaries?
- Which plate tectonic boundary type has the most volcanoes? Tip: use the Plate Boundaries legend and zoom in and out of the map to answer this question.
Step 7
Zoom in on California.
- Describe the locations of the two plate tectonic boundaries found in California.
Step 8
Zoom out so that you see the Pacific west coast of the United States from Washington state to California.
- What plate tectonic boundary type caused the Pacific Northwest volcanoes? Tip: include whether the tectonic plates are oceanic or continental.
Step 9
Scroll to the north and west on the maps so that Alaska and the Aleutian Islands are in view.
- What plate tectonic boundary type created the Aleutian Islands?
Step 10
Zoom out so that the Hawaiian Islands are in view.
- Are the Hawaiian Islands found on a plate tectonic boundary?
Part D. Hotspots
While the majority of earthquake and volcanic activity is found along tectonic plate boundaries, some occurs along hotspots. Hotspots are commonly intraplate features (not found along the boundaries of tectonic plates) where volcanic activity occurs. A hotspot is an area in the lithospheric plate where molten magma breaks through and creates a volcanic center: islands in the ocean and mountains on land. As the plate moves across the hotspot, the volcano center becomes extinct because it is no longer over an active magma source. Instead, the magma emerges through another area in the plate to create a new active volcano. Over time, the combination of moving plate and stationary hotspot creates a chain of islands or mountains (Figure 13.6). The classic definition of hotspots states they do not move, although recent evidence suggests that there may be exceptions.[234] Figure 13.6 shows how a chain of volcanoes is created as a tectonic plate moves over a hotspot. The diagram on the left shows the first volcano forming above the hotspot. The middle diagram shows new volcanoes forming as the tectonic plate moves across the stationary hotspot. The diagram on the right shows the chain of volcanoes as a new volcano forms above the hotspot.

Scientists are divided over how magma is generated in hotspots. Some suggest that hotspots originate from super-heated material from as deep as the core that reaches the Earth’s crust as a mantle plume. Others argue the molten material that feeds hotspots is sourced from the mantle. Of course, it is difficult to collect data from these deep-Earth features due to the extremely high pressure and temperature.10
How hotspots are initiated is another highly debated subject. The prevailing mechanism has hotspots starting in divergent boundaries during supercontinent rifting. Scientists have identified a number of current and past hotspots believed to have begun this way. Subducting slabs have also been named as causing mantle plumes and hotspot volcanism. Some geologists have suggested another geological process not involving plate tectonics may be involved, such as large space objects crashing into the Earth. Regardless of how they are formed, dozens are on the Earth. Some well-known examples include the Tahiti Islands, Afar Triangle, Easter Island, Iceland, Galapagos Islands, and Samoan Islands. The United States is home to two of the largest and best-studied hotspots: Hawai’i and Yellowstone.11 The locations of selected prominent hotspots are shown in Figure 13.7.

- Refer to Figure 13.7.
- How many hotspots are located within the Pacific oceanic tectonic plate?
- What is the name of the hotspot found on the continental North American plate?
Figure 13.8 shows the ages of the seafloor of the Pacific plate. By following the Hawaiian Islands to the Midway Atoll and Emperor Seamount, you are able to see how the Pacific plate has moved over the hotspot. The Hawaiian Islands are shown in red and atolls and seamounts extend linearly away from the hotspot. Atolls are islands formed from coral that once surrounded an island that is now weathered below sea level. Seamounts are islands below sea level—submarine mountains.
On Figure 13.8, the shape of the seamounts are outlined based on their shape at a water depth of two kilometers. Gray lines on the map are fracture zones, which are essentially cracks within the Pacific plate caused by tectonic activity. The black lines on the map that are labeled with Ma identify the age of the volcanoes of the Emperor Seamount in millions of years.
The map also shows the average plate movement of 85 millimeters per year (mm/yr) and 114 millimeters per year at different locations.

- Refer to Figure 13.8.
- What is the age range of the seafloor where the Emperor Seamounts are located?
- How many millions of years ago did the volcanoes that created the Emperor Seamounts erupt?
- Using your answers to questions a and b above and your understanding of hotspots, in one to two sentences explain how the Emperor Seamounts formed.
- The Midway Islands are approximately 2,400 kilometers from the Hawaiian Islands. If the Pacific Plate moves at an average rate of 85 millimeters per year, how long will it take for the Hawaiian Islands to move to where the Midway Islands are currently located? Tip: First, convert kilometers to millimeters by multiplying by 1,000,000. Second, divide this number by 85. Show your calculations.
 Check It Out! The Yellowstone Hotspot
Watch this video called Geology of Yellowstone and Heat Flow in the Earth created by Dr. Jay Chapman from the Geology and Geophysics Department at the University of Wyoming. The video helps to explain what caused the Yellowstone Hotspot and gives insights into how scientists study it.
Part E. Plate Tectonics Synthesis
Review the above information on the Earth’s interior, plate tectonic boundaries, and hotspots, and then answer the following questions.
- Why is it necessary to understand the layers of the Earth’s interior in order to understand plate tectonic boundaries types and hotspots? Explain your response in at least three sentences.
- Students often confuse the three plate tectonic boundary types (convergent, divergent, and transform) and hotspots. What are the similarities and differences between these geologic features? Tip: consider which boundary types are associated with mountains, volcanoes, and earthquakes. Explain your response in at least three sentences.
- Refer to Figures 13.1 and 13.5 and/or your labeled Appendix 13.1 map. Complete Table 13.2 with examples of each of the tectonic plate features. For the column on the right, name a specific geographic location. For example, the Nazca Plate-South American Plate boundary or the Galapagos Hotspot.
| Tectonic Plate Feature | Geographic Example |
|---|---|
| Oceanic-Oceanic Convergent Plate Boundary | |
| Oceanic-Continental Convergent Plate Boundary | |
| Continental-Continental Convergent Plate Boundary | |
| Oceanic Divergent Plate Boundary | |
| Continental Divergent Plate Boundary | |
| Oceanic Hotspot | |
| Continental Hotspot |
- Why do you think plate tectonics theory is called the unifying theory of geology? Explain your response in one to two sentences.
Part F. Wrap-Up
Consult with your geography lab instructor to find out which of the following wrap-up questions you should complete. Attach additional pages to answer the questions as needed.
- What is the most important idea that you learned in this lab? In two to three sentences, explain the concept and why it is important to know.
- What was the most challenging part of this lab? In two to three sentences, explain why it was challenging. If nothing challenged you in the lab, write about what you think challenged your classmates.
- What is one question that you have about what you learned in this lab? Write your question along with one to two sentences explaining why you think your question is important to ask.
- Review the learning objectives on page 1 of this lab. How would you rate your understanding or ability for each learning objective? Write one sentence that addresses each learning objective.
- Sketch a concept map that includes the key ideas from this lab. Include at least five of the terms shown in bold-faced type.
- Create an advertisement to educate your peers on the important information that you learned in this lab. Include at least three key terms in your advertisement. The advertisement should be about half a page in size (about 4 inches by 6 inches).
- One way to think of physical geography is that it is the study of the relationships among variables that impact the Earth's surface. Select two variables discussed in this lab and describe how they are related.
- How does what you learned in this lab relate to your everyday life? In two to three sentences, explain a concept that you learned in this lab and how it relates to your day-to-day actions.
- How does what you learned in this lab relate to current events?
- Write the title, source, and date of a news item that relates to this lab.
- In two to three sentences, discuss how the news item relates to what you have learned in this lab.
- In one to two sentences, discuss whether or not the news item accurately represents the science that you learned. Tip: consider whether or not the news item includes the complexity of the topic.
- Search O*NET OnLine to find an occupation that is relevant to the topics presented in today's lab. Your lab instructor may provide you with possible keywords to type in the Occupation Quick Search field on the O*NET website.
- What is the name of the occupation that you found?
- Write two to three sentences that summarize the most important information that you learned about this occupation.
- What is one question that you would want to ask a person with this occupation?
Appendix 13.1: World Map

[225] Text by USGS is in the public domain
[229] Text by USGS is in the public domain
[232] Adapted from Esri GeoInquiries
[233] Adapted from Esri GeoInquiries
[234] Text by C. Johnson, M.D. Affolter, P. Inkenbrandt & C. Mosher is licensed under CC BY-NC-SA 4.0