
2.1: Plants dominate in terms of biomass
- Page ID
- 25872
\( \newcommand{\vecs}[1]{\overset { \scriptstyle \rightharpoonup} {\mathbf{#1}} } \)
\( \newcommand{\vecd}[1]{\overset{-\!-\!\rightharpoonup}{\vphantom{a}\smash {#1}}} \)
\( \newcommand{\id}{\mathrm{id}}\) \( \newcommand{\Span}{\mathrm{span}}\)
( \newcommand{\kernel}{\mathrm{null}\,}\) \( \newcommand{\range}{\mathrm{range}\,}\)
\( \newcommand{\RealPart}{\mathrm{Re}}\) \( \newcommand{\ImaginaryPart}{\mathrm{Im}}\)
\( \newcommand{\Argument}{\mathrm{Arg}}\) \( \newcommand{\norm}[1]{\| #1 \|}\)
\( \newcommand{\inner}[2]{\langle #1, #2 \rangle}\)
\( \newcommand{\Span}{\mathrm{span}}\)
\( \newcommand{\id}{\mathrm{id}}\)
\( \newcommand{\Span}{\mathrm{span}}\)
\( \newcommand{\kernel}{\mathrm{null}\,}\)
\( \newcommand{\range}{\mathrm{range}\,}\)
\( \newcommand{\RealPart}{\mathrm{Re}}\)
\( \newcommand{\ImaginaryPart}{\mathrm{Im}}\)
\( \newcommand{\Argument}{\mathrm{Arg}}\)
\( \newcommand{\norm}[1]{\| #1 \|}\)
\( \newcommand{\inner}[2]{\langle #1, #2 \rangle}\)
\( \newcommand{\Span}{\mathrm{span}}\) \( \newcommand{\AA}{\unicode[.8,0]{x212B}}\)
\( \newcommand{\vectorA}[1]{\vec{#1}} % arrow\)
\( \newcommand{\vectorAt}[1]{\vec{\text{#1}}} % arrow\)
\( \newcommand{\vectorB}[1]{\overset { \scriptstyle \rightharpoonup} {\mathbf{#1}} } \)
\( \newcommand{\vectorC}[1]{\textbf{#1}} \)
\( \newcommand{\vectorD}[1]{\overrightarrow{#1}} \)
\( \newcommand{\vectorDt}[1]{\overrightarrow{\text{#1}}} \)
\( \newcommand{\vectE}[1]{\overset{-\!-\!\rightharpoonup}{\vphantom{a}\smash{\mathbf {#1}}}} \)
\( \newcommand{\vecs}[1]{\overset { \scriptstyle \rightharpoonup} {\mathbf{#1}} } \)
\( \newcommand{\vecd}[1]{\overset{-\!-\!\rightharpoonup}{\vphantom{a}\smash {#1}}} \)
The best estimates of the biomass of each taxon [8] analyzed are shown in Figure 3 [9]. The sum of the biomass across all taxa on Earth is estimated to be about 550 Gt C, of which:
- ≈80% (≈450 Gt C) are plants [10];
- ≈15% (≈70 Gt C) are bacteria, the second major component of biomass ;
- the remainder is due to other groups; in descending order: fungi (≈12 Gt C), archaea (≈8 Gt C), protists (≈4 Gt C), animals (≈2 Gt C) and viruses (≈0.2 Gt C).
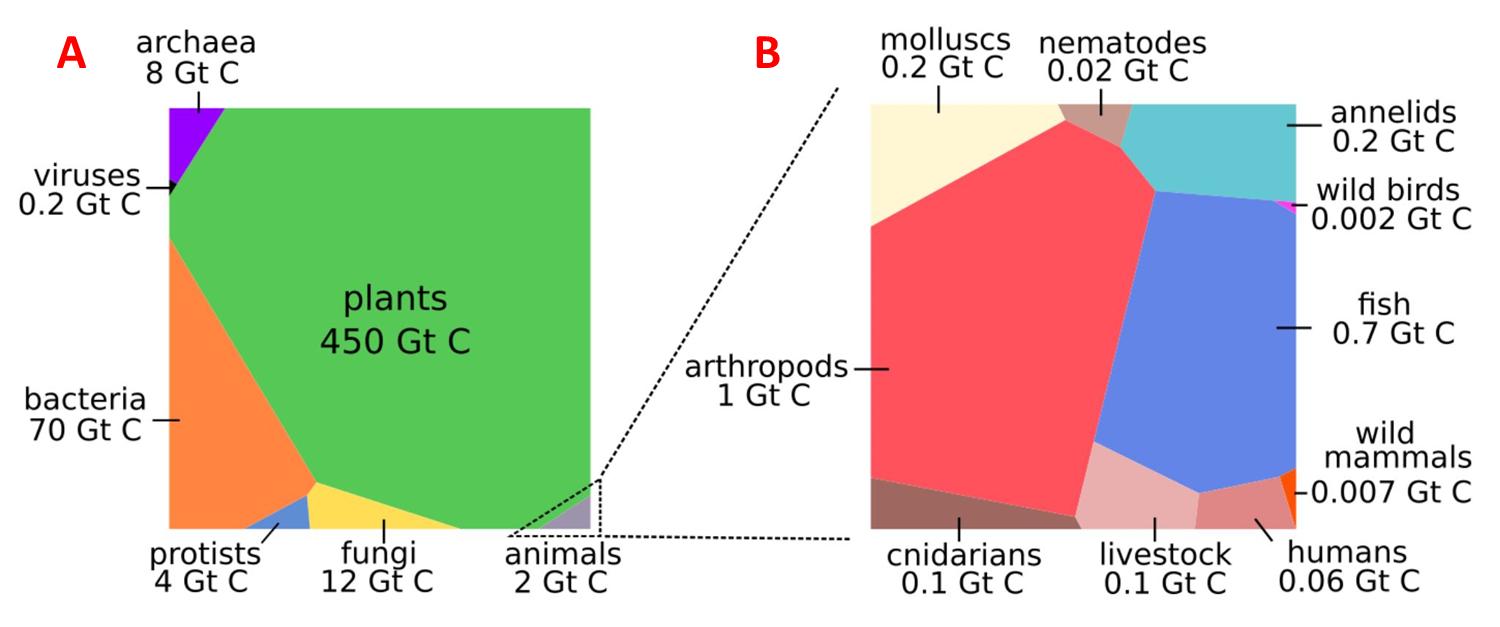
Figure \(\PageIndex{1}\). Graphical representation of global biomass distribution by taxa. (A) Absolute biomasses are represented using a Voronoi diagram where the area of each surface is proportional to the biomass of the group of living organisms considered. (B) Biomass of different groups of animals. Groups with negligible biomass are not shown. The diagrams were generated from the Proteomaps tool (see ref. [9]). Related groups such as vertebrates (birds, fish, mammals) are located next to each other. The contribution of reptiles and amphibians to the total animal biomass is negligible. [Source: diagram after Bar-On et al. ref [4]; Open Access article distributed under CC BY-NC-ND 4.0 license]
Estimates of global biomass vary according to the amount of information on which they are based and, consequently, their uncertainty (See Focus How to estimate global biomass?). One estimate with a relatively high degree of certainty is that of plants, which is based on many independent sources allowing a robust assessment of total plant biomass [11]. On the other hand, a typical case of greater uncertainties is illustrated by marine prokaryotes, whose cell concentrations are measured at various locations around the world and classified according to depth.
Thus, despite the large uncertainty associated with the total biomass of bacteria [10], plants are the dominant group in terms of biomass with a probability of ≈90%.
Plant biomass is dominated by terrestrial plants, specifically vascular plants, with only a minor contribution from bryophytes (e.g. mosses) and of all marine plant biomass. This plant biomass represents that of forest and non-forest ecosystems and takes into account the impacts of land-use change.[12] Plant tissues are composed of an extracellular scaffold made out of cell walls (mainly cellulose and lignin), enclosing a cytoplasmic network, termed the protoplasm. The ratio of protoplasm to cell wall varies between plant compartments, with leaves containing the least amount of supporting tissue, while the stems of woody plants (such as trees) are primarily composed of supporting tissue:
- ≈70% of the plant biomass are due to the stems and trunks of trees, and are therefore relatively metabolically inert;
- The remaining ≈30% is concentrated in highly metabolically active plant tissues (mainly leaves and metabolically active root parts).
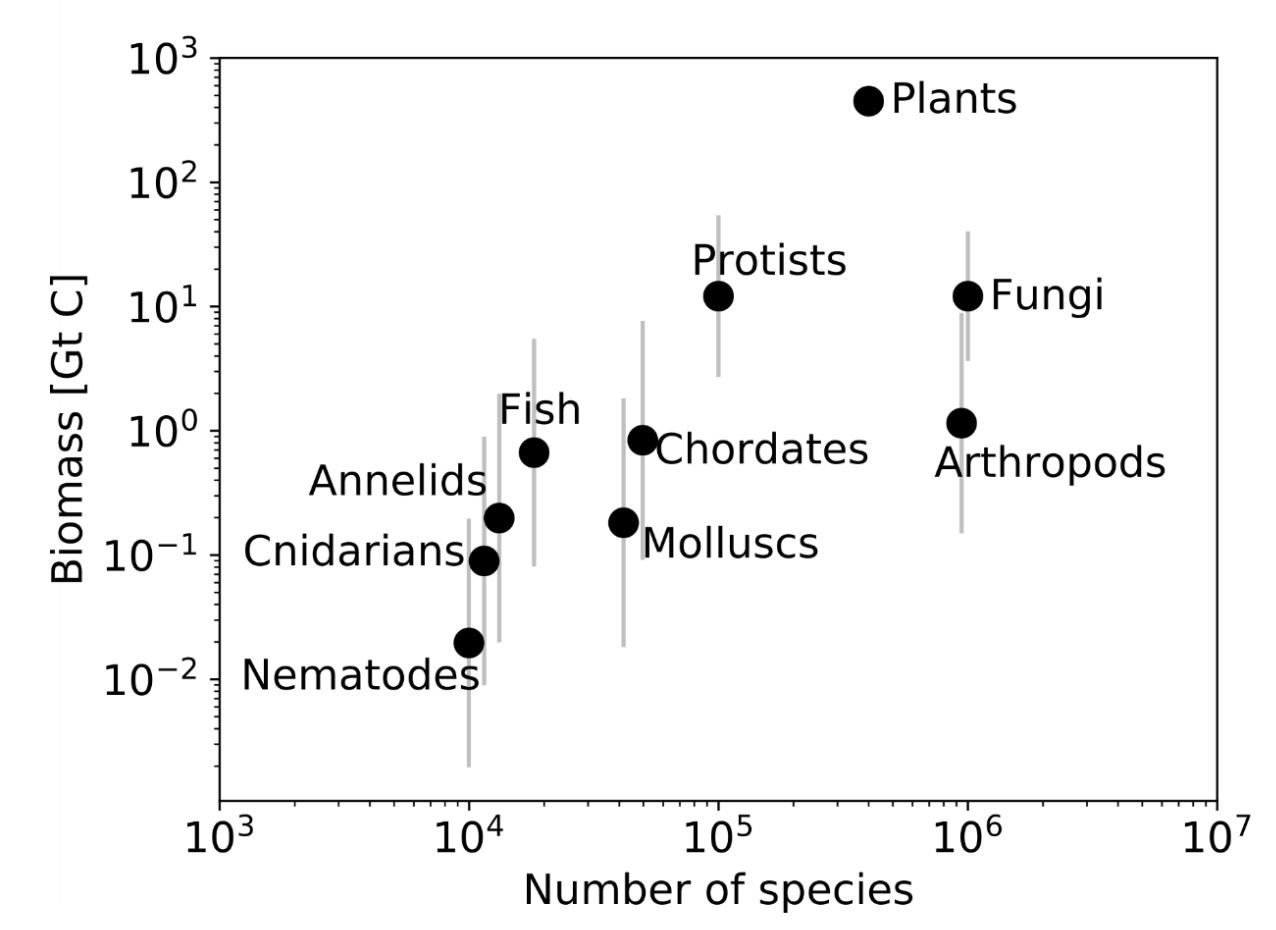
Figure \(\PageIndex{2}\). Relationship between species richness and biomass of different taxa. The total number of species in each taxon is plotted against the total biomass of the taxon. Error bars reflect our projection of uncertainty in the biomass estimate. [Source: diagram after Bar-On et al. ref [4]; Open Access article distributed undr CC BY-NC-ND 4.0 license]
Aboveground biomass (≈320 Gt C) accounts for ≈60% of the global biomass, with belowground biomass being mainly composed of plant roots (≈130 Gt C) and microbes residing in the soil and deep subsurface (≈100 Gt C).
Bacteria include about 90% of the biomass in deep subsurface (primarily in aquifers and beneath the seafloor), which have very slow metabolic activity and associated biomass carbon turnover times of months to thousands of years. Excluding these contributions, global biomass is still dominated by plants, consisting mainly of ≈150 Gt C of plant roots and leaves and ≈9 Gt C of terrestrial and marine bacteria whose contribution is nearly equal to the ≈12 Gt C of fungi.