
7.3.5: Episodic changes (dune erosion)
- Page ID
- 16377

\( \newcommand{\vecs}[1]{\overset { \scriptstyle \rightharpoonup} {\mathbf{#1}} } \)
\( \newcommand{\vecd}[1]{\overset{-\!-\!\rightharpoonup}{\vphantom{a}\smash {#1}}} \)
\( \newcommand{\id}{\mathrm{id}}\) \( \newcommand{\Span}{\mathrm{span}}\)
( \newcommand{\kernel}{\mathrm{null}\,}\) \( \newcommand{\range}{\mathrm{range}\,}\)
\( \newcommand{\RealPart}{\mathrm{Re}}\) \( \newcommand{\ImaginaryPart}{\mathrm{Im}}\)
\( \newcommand{\Argument}{\mathrm{Arg}}\) \( \newcommand{\norm}[1]{\| #1 \|}\)
\( \newcommand{\inner}[2]{\langle #1, #2 \rangle}\)
\( \newcommand{\Span}{\mathrm{span}}\)
\( \newcommand{\id}{\mathrm{id}}\)
\( \newcommand{\Span}{\mathrm{span}}\)
\( \newcommand{\kernel}{\mathrm{null}\,}\)
\( \newcommand{\range}{\mathrm{range}\,}\)
\( \newcommand{\RealPart}{\mathrm{Re}}\)
\( \newcommand{\ImaginaryPart}{\mathrm{Im}}\)
\( \newcommand{\Argument}{\mathrm{Arg}}\)
\( \newcommand{\norm}[1]{\| #1 \|}\)
\( \newcommand{\inner}[2]{\langle #1, #2 \rangle}\)
\( \newcommand{\Span}{\mathrm{span}}\) \( \newcommand{\AA}{\unicode[.8,0]{x212B}}\)
\( \newcommand{\vectorA}[1]{\vec{#1}} % arrow\)
\( \newcommand{\vectorAt}[1]{\vec{\text{#1}}} % arrow\)
\( \newcommand{\vectorB}[1]{\overset { \scriptstyle \rightharpoonup} {\mathbf{#1}} } \)
\( \newcommand{\vectorC}[1]{\textbf{#1}} \)
\( \newcommand{\vectorD}[1]{\overrightarrow{#1}} \)
\( \newcommand{\vectorDt}[1]{\overrightarrow{\text{#1}}} \)
\( \newcommand{\vectE}[1]{\overset{-\!-\!\rightharpoonup}{\vphantom{a}\smash{\mathbf {#1}}}} \)
\( \newcommand{\vecs}[1]{\overset { \scriptstyle \rightharpoonup} {\mathbf{#1}} } \)
\( \newcommand{\vecd}[1]{\overset{-\!-\!\rightharpoonup}{\vphantom{a}\smash {#1}}} \)
\(\newcommand{\avec}{\mathbf a}\) \(\newcommand{\bvec}{\mathbf b}\) \(\newcommand{\cvec}{\mathbf c}\) \(\newcommand{\dvec}{\mathbf d}\) \(\newcommand{\dtil}{\widetilde{\mathbf d}}\) \(\newcommand{\evec}{\mathbf e}\) \(\newcommand{\fvec}{\mathbf f}\) \(\newcommand{\nvec}{\mathbf n}\) \(\newcommand{\pvec}{\mathbf p}\) \(\newcommand{\qvec}{\mathbf q}\) \(\newcommand{\svec}{\mathbf s}\) \(\newcommand{\tvec}{\mathbf t}\) \(\newcommand{\uvec}{\mathbf u}\) \(\newcommand{\vvec}{\mathbf v}\) \(\newcommand{\wvec}{\mathbf w}\) \(\newcommand{\xvec}{\mathbf x}\) \(\newcommand{\yvec}{\mathbf y}\) \(\newcommand{\zvec}{\mathbf z}\) \(\newcommand{\rvec}{\mathbf r}\) \(\newcommand{\mvec}{\mathbf m}\) \(\newcommand{\zerovec}{\mathbf 0}\) \(\newcommand{\onevec}{\mathbf 1}\) \(\newcommand{\real}{\mathbb R}\) \(\newcommand{\twovec}[2]{\left[\begin{array}{r}#1 \\ #2 \end{array}\right]}\) \(\newcommand{\ctwovec}[2]{\left[\begin{array}{c}#1 \\ #2 \end{array}\right]}\) \(\newcommand{\threevec}[3]{\left[\begin{array}{r}#1 \\ #2 \\ #3 \end{array}\right]}\) \(\newcommand{\cthreevec}[3]{\left[\begin{array}{c}#1 \\ #2 \\ #3 \end{array}\right]}\) \(\newcommand{\fourvec}[4]{\left[\begin{array}{r}#1 \\ #2 \\ #3 \\ #4 \end{array}\right]}\) \(\newcommand{\cfourvec}[4]{\left[\begin{array}{c}#1 \\ #2 \\ #3 \\ #4 \end{array}\right]}\) \(\newcommand{\fivevec}[5]{\left[\begin{array}{r}#1 \\ #2 \\ #3 \\ #4 \\ #5 \\ \end{array}\right]}\) \(\newcommand{\cfivevec}[5]{\left[\begin{array}{c}#1 \\ #2 \\ #3 \\ #4 \\ #5 \\ \end{array}\right]}\) \(\newcommand{\mattwo}[4]{\left[\begin{array}{rr}#1 \amp #2 \\ #3 \amp #4 \\ \end{array}\right]}\) \(\newcommand{\laspan}[1]{\text{Span}\{#1\}}\) \(\newcommand{\bcal}{\cal B}\) \(\newcommand{\ccal}{\cal C}\) \(\newcommand{\scal}{\cal S}\) \(\newcommand{\wcal}{\cal W}\) \(\newcommand{\ecal}{\cal E}\) \(\newcommand{\coords}[2]{\left\{#1\right\}_{#2}}\) \(\newcommand{\gray}[1]{\color{gray}{#1}}\) \(\newcommand{\lgray}[1]{\color{lightgray}{#1}}\) \(\newcommand{\rank}{\operatorname{rank}}\) \(\newcommand{\row}{\text{Row}}\) \(\newcommand{\col}{\text{Col}}\) \(\renewcommand{\row}{\text{Row}}\) \(\newcommand{\nul}{\text{Nul}}\) \(\newcommand{\var}{\text{Var}}\) \(\newcommand{\corr}{\text{corr}}\) \(\newcommand{\len}[1]{\left|#1\right|}\) \(\newcommand{\bbar}{\overline{\bvec}}\) \(\newcommand{\bhat}{\widehat{\bvec}}\) \(\newcommand{\bperp}{\bvec^\perp}\) \(\newcommand{\xhat}{\widehat{\xvec}}\) \(\newcommand{\vhat}{\widehat{\vvec}}\) \(\newcommand{\uhat}{\widehat{\uvec}}\) \(\newcommand{\what}{\widehat{\wvec}}\) \(\newcommand{\Sighat}{\widehat{\Sigma}}\) \(\newcommand{\lt}{<}\) \(\newcommand{\gt}{>}\) \(\newcommand{\amp}{&}\) \(\definecolor{fillinmathshade}{gray}{0.9}\)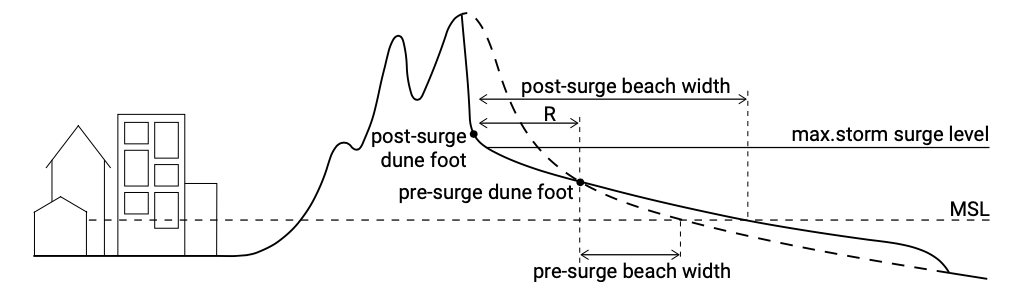
Dune erosion in the Netherlands and more generally along the southwest North Sea coasts takes place during storm surges when the mean water level increases and waves can reach the dune face and impact it (Fig. 7.16). Eroded sand from the dunes (a sort of episodic avalanching process) is transported offshore by a strong undertow. The combination of a strong undertow and high concentrations of suspended sediment in the proximity of the dunes, leads to a large offshore transport capacity. Further seaward the transport capacity of the flow decreases and the sediment starts to settle forming a new coastal profile that better fits the storm surge conditions. The newly developed foreshore is more efficient in dissipating the energy associated with the incoming waves and consequently dune erosion rates decrease as the storm progresses.
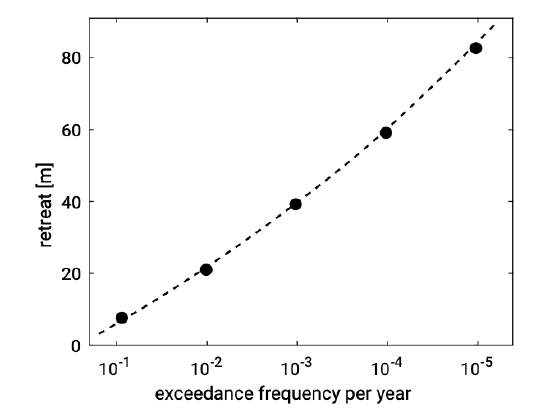
During a severe storm surge, with design conditions of offshore water levels approximately \(5\ m\) to \(6\ m\) above MSL and with severe wave conditions (cf. wave heights \(H_s \approx 7\ m\) to \(9\ m\) and peak periods \(T_p \approx 12\ s\) to \(18\ s\) ), the dunes will erode quickly and fiercely. Existing design rules in the Netherlands allow for erosion rates of \(80\ m\) to \(100\ m\) of dune retreat during design storm conditions (Fig. 7.17). This figure presents retreat rates for lower design conditions as well.
Figure 7.16 suggests that a new equilibrium profile is formed that fits the extreme conditions. Indeed this has been the basis of the ‘erosion profile’ approach of Vellinga (1986), who extended earlier work of Van de Graaff (1977). The difference with the dynamic equilibrium profile methods of Bruun and Dean is that the timescale is different. This erosion profile method is presently still used for the basic assessment of the safety of the Dutch dunes (ENW, 2007).
For sediments with a \(D_{50}\) between \(90\ \mu m\) and \(225\ \mu m\), Vellinga conducted a comprehensive set of experiments on different scales, and derived a scale relation showing the effect of grain size on the erosion profile shape:
\[\dfrac{n_l}{n_h} = \left (\dfrac{n_h}{n_w^2} \right )^{0.28}\label{eq7.3.5.1}\]
where \(n_x\) represents the ratio between two cases with different scales of a variable \(x\). If a small-scale physical model is made to represent reality (the ‘prototype’), this scaling relation can be used to derive the physical model dimensions and grain diameter. Note that in a scale series, the prototype can be a larger scale model.
The following scales are specified in Eq. \(\ref{eq7.3.5.1}\):
| \(n_l\) | ratio between a horizontal distance in prototype and the equivalent distance in the model |
| \(n_h\) | ratio between water depth in prototype and the water depth in the model |
| \(n_w\) | ratio between fall velocity of bottom material in prototype and fall velocity of bottom material in model |
Using the scale relation Eq. \(\ref{eq7.3.5.1}\), Vellinga derived for the shape of the erosion profile (the post-storm profile):
\[h = A (x')^{0.78}\label{eq7.3.5.2}\]
This equation relates the water depth h to the offshore distance \(x'\) through a dimensional shape factor \(A\), which can also be derived from Eq. \(\ref{eq7.3.5.1}\):
\[A = 0.39 w_s^{0.44}\label{eq7.3.5.3}\]
where \(w_s\) is in \(m/s\). The position of \(x' = 0\) in Eq. \(\ref{eq7.3.5.2}\) is now defined by the storm surge level instead of by the MSL. Based on a fall velocity of \(w_s = 0.0256\ m/s\) we would find that the erosion profile is described by \(h = 0.078(x')^{0.78}\). Clearly, the shape of the erosion profile is affected by grain size, with coarser material resulting in steeper slopes.
Note the similarity between Eqs. \(\ref{eq7.3.5.2}\) and \(\ref{eq7.3.5.3}\) on the one hand and Eqs. 7.2.2.1 and 7.2.2.7 on the other hand, but also note the different power and the different coefficient used in determining the shape parameter.
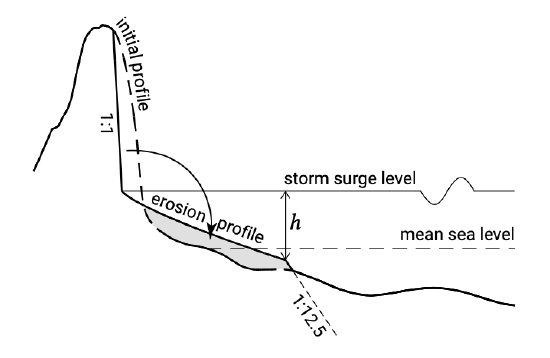
An interesting empirical finding of Vellinga concerns the extent of the sedimentation zone (see Fig. 7.18). This zone was found to reach to a depth of approximately 75% of the offshore significant wave height relative to the surge level. Equations \(\ref{eq7.3.5.2}\) and \(\ref{eq7.3.5.3}\) thus describe the erosion profile down to a depth of 75% of the significant wave height. The horizontal position of the erosion profile is defined by the conservation of sediment in the cross-shore profile.
We can now make a first-order magnitude estimate of the dune retreat. For simplicity, we assume that the erosion profile and the pre-storm equilibrium profile have the same shape but that the erosion profile is shifted upward to the elevation of the storm surge level instead of the MSL. A landward translation (retreat) of the profile is required to ensure conservation of sediment. Since we have assumed a shape-invariant profile, the required dune retreat distance can be estimated using Bruun’s rule (see Sect. 2.5.2 and Sect. 7.4). Following Bruun’s rule, the volume of sediment eroded from the upper profile balances the deposited volume in deeper water for a retreat distance equal to (cf. Eq. 7.4.1):
\[R_{SS} = SSL(L/D)\label{eq7.3.5.4}\]
where \(SSL\) is the storm surge level above MSL, \(L\) the length over which the erosion and sedimentation takes place and d the corresponding height.
We assume that the dune height above MSL is \(10\ m\). Let us take the same design storm conditions as given before, i.e. a storm surge level of approximately \(5\ m\) to \(6\ m\) above MSL and wave heights of \(H_s \approx 7\ m\) to \(9\ m\). From Vellinga’s finding that the sedimentation reaches a depth relative to the surge level of 75% of the offshore significant wave height, we find that this depth is of the same order of magnitude as the storm surge level (viz. \(5\ m\) to \(6\ m\)). Hence, the region of sedimentation extends seawards until where the seabed is approximately at MSL, such that the height over which the sedimentation and erosion take place is equal to the dune height above MSL and \(d = 10\ m\) in Eq. \(\ref{eq7.3.5.4}\). The length \(L\) over which the changes take place can be estimated from the erosion profile, which we assume to be determined by Eqs. \(\ref{eq7.3.5.2}\) and \(\ref{eq7.3.5.3}\). Using \(w_s = 0.0256\ m/s\), we have \(h = 0.078(x')^{0.78}\) or \(0.75H_s \approx 0.078L^{0.78}\) and thus \(L = 220\ m\) to \(300\ m\). From Eq. \(\ref{eq7.3.5.4}\), we obtain a dune retreat distance of \(110\ m\) to \(180\ m\). This is (somewhat) larger than the design rule outcome of \(80\ m\) to \(100\ m\).
We will get a significantly closer estimate using a dune erosion prediction model such as DUROS-plus, which has largely been developed from a prediction model that was proposed by Vellinga and that in essence is not very different from our crude hand computation. As in the above, the depth to which the erosion profile reaches is computed as 75% of the offshore significant wave height. The initial profile however is not necessarily identical in shape to the erosion profile. Further, the shape of the erosion profile now is a function of both the sediment fall velocity and the offshore significant wave height and has a 1:1 slope above storm surge level. Again the position of the erosion profile must be determined by a horizontal translation until erosion and sedimentation volumes are balanced.
More refined methods to assess dune erosion exist, especially as a function of the specific storm surge conditions and duration, including the variation over the tide. With these the evolution in time of the erosion and sedimentation can be mimicked, which is necessary when the final ‘equilibrium erosion profile’ is not reached. These methods are commonly used for advanced designs.
After a storm surge the beach width has become substantially wider (Fig. 7.16) and the coastal profile is not in equilibrium with the post-surge hydrodynamic conditions. Waves, tide and wind reshape the foreshore and the dunes gain eroded sand back gradually. In a situation without alongshore sediment transport gradients the dunes recover to pre-storm volume. However, the timescale of dune recovery is considerably larger than that of erosion.