
1.4.6: Dune erosion and flooding during a severe storm surge
- Page ID
- 16263

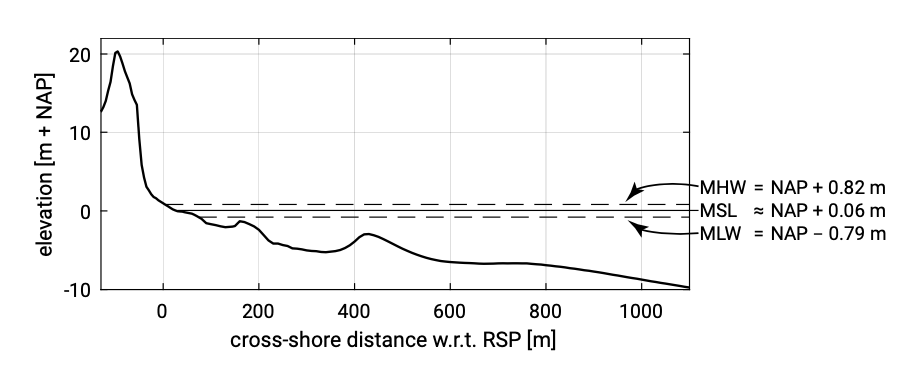
Figure 1.10 shows an instantaneous cross-shore profile (cf. Fig. 1.2). Under normal conditions the water level is changing due to vertical tidal variations. On top of that, shorter variations due to waves are present. Due to changing water levels and changing wave characteristics (wave height, wave period and wave direction), cross- shore sediment transport rates (and the cross-shore transport gradients) continuously change in magnitude and direction. This normal variation was already discussed in Sect. 1.4.2.
During a severe storm the waves generated in the open sea will be much higher than normal. Depending on the direction and strength of the wind during the storm and on the shape of the sea bordering the coast under consideration, water can pile up at the coastline raising the Still Water Level (SWL) (without the effect of waves). This piling up of water is called surge.
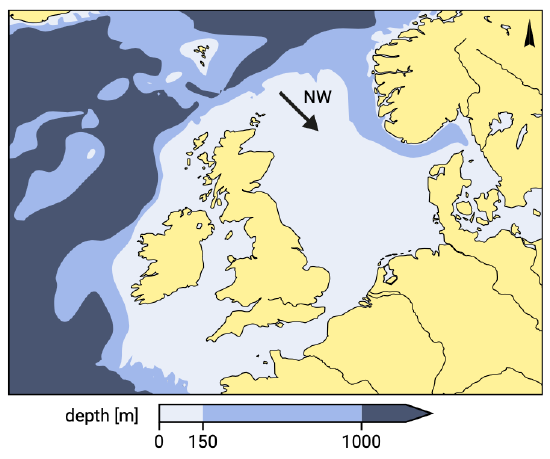
During the severe storm surge of January 31st and February 1st 1953 in the Netherlands, the water level along the Dutch coast was about 2.5 to 3.0 m higher than normal. The wind associated with this storm came from northwest directions, blew over the funnel shaped North Sea and forced the water to pile up against the coasts of the southern part of the North Sea (see Fig. 1.11). The rather small gap between United Kingdom and France (The Channel) prevented the raised water from escaping from the North Sea basin. During the 1953 storm surge many dikes in the southwestern part of the Netherlands broke. Nearly 1850 lives were lost and there were large economical con- sequences as well. This disaster triggered the execution of the so-called Delta plan in the Netherlands.
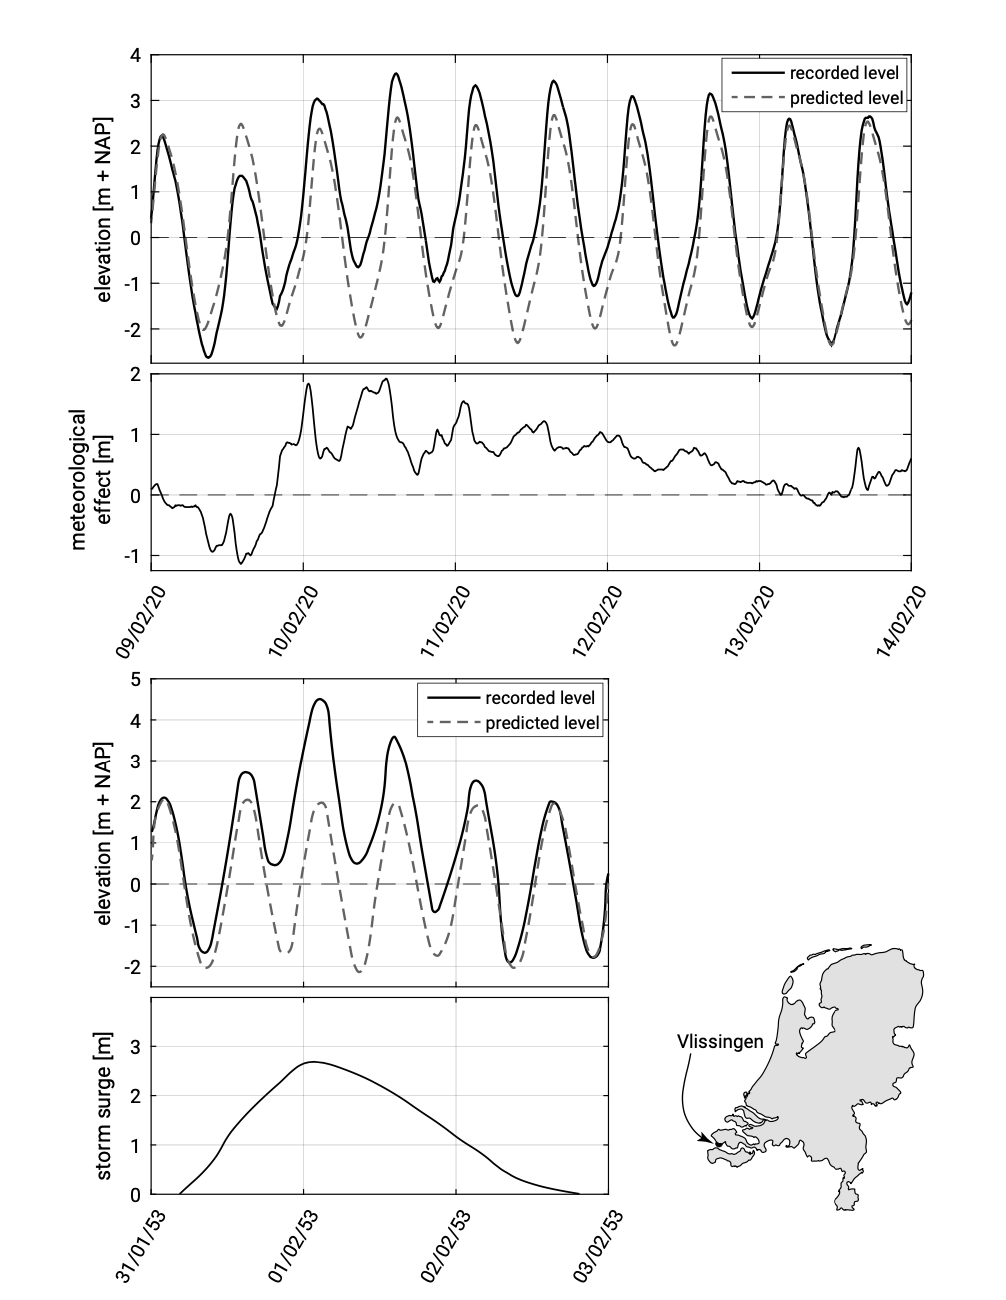
Figure 1.12 shows some characteristics of the measured and predicted water levels in Flushing (Vlissingen in Dutch). Note that the storm effect (the surge) is the difference between the actual measured and the predicted astronomical (tidal) water level variation. Note also that the surge lasted in fact a rather small period of time; within two days the storm effect rose from zero to approximately 2.8 m and fell down to zero again.
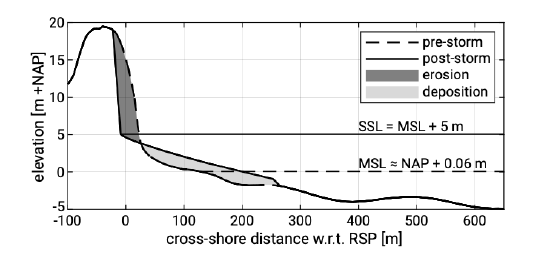
In Fig. 1.13 the same cross-section as in Fig. 1.10 has been sketched, but now under maximum storm surge conditions. Not only is the SWL much higher than in Fig. 1.10, but also much higher waves are present. The SWL even exceeds the level of the dune foot; all the beaches have disappeared under water and the waves hit the dunes. It can be argued that the shape of the cross-shore profile does not correspond to the storm surge conditions (the profile shape is far out of equilibrium for these conditions). Large offshore directed sediment transports ensure that the profile shape is transformed towards the equilibrium shape associated with the storm conditions. The dunes erode and the eroded dune material settles in deeper water, where the cross-shore profile gradually flattens (see Fig. 1.13; cf. the winter profile of Fig. 1.3).
In Ch. 7 a more detailed description is given of the associated processes. For the time being it is sufficient to understand that a coastal zone manager likes to know what the loss of dune area will be under a given set of storm surge conditions e.g. to assess the safety of properties built close to the brink of the dunes. In the Netherlands also the safety of a large part of the population, living well below MSL behind the dunes, is at stake if a break-through of the dunes occurs.