4.4: Stratospheric Ozone Formation
- Page ID
- 3372
\( \newcommand{\vecs}[1]{\overset { \scriptstyle \rightharpoonup} {\mathbf{#1}} } \)
\( \newcommand{\vecd}[1]{\overset{-\!-\!\rightharpoonup}{\vphantom{a}\smash {#1}}} \)
\( \newcommand{\id}{\mathrm{id}}\) \( \newcommand{\Span}{\mathrm{span}}\)
( \newcommand{\kernel}{\mathrm{null}\,}\) \( \newcommand{\range}{\mathrm{range}\,}\)
\( \newcommand{\RealPart}{\mathrm{Re}}\) \( \newcommand{\ImaginaryPart}{\mathrm{Im}}\)
\( \newcommand{\Argument}{\mathrm{Arg}}\) \( \newcommand{\norm}[1]{\| #1 \|}\)
\( \newcommand{\inner}[2]{\langle #1, #2 \rangle}\)
\( \newcommand{\Span}{\mathrm{span}}\)
\( \newcommand{\id}{\mathrm{id}}\)
\( \newcommand{\Span}{\mathrm{span}}\)
\( \newcommand{\kernel}{\mathrm{null}\,}\)
\( \newcommand{\range}{\mathrm{range}\,}\)
\( \newcommand{\RealPart}{\mathrm{Re}}\)
\( \newcommand{\ImaginaryPart}{\mathrm{Im}}\)
\( \newcommand{\Argument}{\mathrm{Arg}}\)
\( \newcommand{\norm}[1]{\| #1 \|}\)
\( \newcommand{\inner}[2]{\langle #1, #2 \rangle}\)
\( \newcommand{\Span}{\mathrm{span}}\) \( \newcommand{\AA}{\unicode[.8,0]{x212B}}\)
\( \newcommand{\vectorA}[1]{\vec{#1}} % arrow\)
\( \newcommand{\vectorAt}[1]{\vec{\text{#1}}} % arrow\)
\( \newcommand{\vectorB}[1]{\overset { \scriptstyle \rightharpoonup} {\mathbf{#1}} } \)
\( \newcommand{\vectorC}[1]{\textbf{#1}} \)
\( \newcommand{\vectorD}[1]{\overrightarrow{#1}} \)
\( \newcommand{\vectorDt}[1]{\overrightarrow{\text{#1}}} \)
\( \newcommand{\vectE}[1]{\overset{-\!-\!\rightharpoonup}{\vphantom{a}\smash{\mathbf {#1}}}} \)
\( \newcommand{\vecs}[1]{\overset { \scriptstyle \rightharpoonup} {\mathbf{#1}} } \)
\( \newcommand{\vecd}[1]{\overset{-\!-\!\rightharpoonup}{\vphantom{a}\smash {#1}}} \)
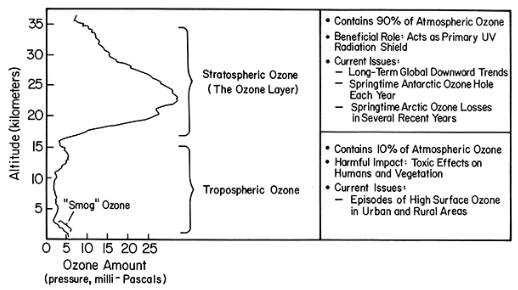
\(\newcommand{\avec}{\mathbf a}\) \(\newcommand{\bvec}{\mathbf b}\) \(\newcommand{\cvec}{\mathbf c}\) \(\newcommand{\dvec}{\mathbf d}\) \(\newcommand{\dtil}{\widetilde{\mathbf d}}\) \(\newcommand{\evec}{\mathbf e}\) \(\newcommand{\fvec}{\mathbf f}\) \(\newcommand{\nvec}{\mathbf n}\) \(\newcommand{\pvec}{\mathbf p}\) \(\newcommand{\qvec}{\mathbf q}\) \(\newcommand{\svec}{\mathbf s}\) \(\newcommand{\tvec}{\mathbf t}\) \(\newcommand{\uvec}{\mathbf u}\) \(\newcommand{\vvec}{\mathbf v}\) \(\newcommand{\wvec}{\mathbf w}\) \(\newcommand{\xvec}{\mathbf x}\) \(\newcommand{\yvec}{\mathbf y}\) \(\newcommand{\zvec}{\mathbf z}\) \(\newcommand{\rvec}{\mathbf r}\) \(\newcommand{\mvec}{\mathbf m}\) \(\newcommand{\zerovec}{\mathbf 0}\) \(\newcommand{\onevec}{\mathbf 1}\) \(\newcommand{\real}{\mathbb R}\) \(\newcommand{\twovec}[2]{\left[\begin{array}{r}#1 \\ #2 \end{array}\right]}\) \(\newcommand{\ctwovec}[2]{\left[\begin{array}{c}#1 \\ #2 \end{array}\right]}\) \(\newcommand{\threevec}[3]{\left[\begin{array}{r}#1 \\ #2 \\ #3 \end{array}\right]}\) \(\newcommand{\cthreevec}[3]{\left[\begin{array}{c}#1 \\ #2 \\ #3 \end{array}\right]}\) \(\newcommand{\fourvec}[4]{\left[\begin{array}{r}#1 \\ #2 \\ #3 \\ #4 \end{array}\right]}\) \(\newcommand{\cfourvec}[4]{\left[\begin{array}{c}#1 \\ #2 \\ #3 \\ #4 \end{array}\right]}\) \(\newcommand{\fivevec}[5]{\left[\begin{array}{r}#1 \\ #2 \\ #3 \\ #4 \\ #5 \\ \end{array}\right]}\) \(\newcommand{\cfivevec}[5]{\left[\begin{array}{c}#1 \\ #2 \\ #3 \\ #4 \\ #5 \\ \end{array}\right]}\) \(\newcommand{\mattwo}[4]{\left[\begin{array}{rr}#1 \amp #2 \\ #3 \amp #4 \\ \end{array}\right]}\) \(\newcommand{\laspan}[1]{\text{Span}\{#1\}}\) \(\newcommand{\bcal}{\cal B}\) \(\newcommand{\ccal}{\cal C}\) \(\newcommand{\scal}{\cal S}\) \(\newcommand{\wcal}{\cal W}\) \(\newcommand{\ecal}{\cal E}\) \(\newcommand{\coords}[2]{\left\{#1\right\}_{#2}}\) \(\newcommand{\gray}[1]{\color{gray}{#1}}\) \(\newcommand{\lgray}[1]{\color{lightgray}{#1}}\) \(\newcommand{\rank}{\operatorname{rank}}\) \(\newcommand{\row}{\text{Row}}\) \(\newcommand{\col}{\text{Col}}\) \(\renewcommand{\row}{\text{Row}}\) \(\newcommand{\nul}{\text{Nul}}\) \(\newcommand{\var}{\text{Var}}\) \(\newcommand{\corr}{\text{corr}}\) \(\newcommand{\len}[1]{\left|#1\right|}\) \(\newcommand{\bbar}{\overline{\bvec}}\) \(\newcommand{\bhat}{\widehat{\bvec}}\) \(\newcommand{\bperp}{\bvec^\perp}\) \(\newcommand{\xhat}{\widehat{\xvec}}\) \(\newcommand{\vhat}{\widehat{\vvec}}\) \(\newcommand{\uhat}{\widehat{\uvec}}\) \(\newcommand{\what}{\widehat{\wvec}}\) \(\newcommand{\Sighat}{\widehat{\Sigma}}\) \(\newcommand{\lt}{<}\) \(\newcommand{\gt}{>}\) \(\newcommand{\amp}{&}\) \(\definecolor{fillinmathshade}{gray}{0.9}\)Ozone is ozone no matter where it is in the atmosphere. Good ozone is good only because it is in the stratosphere where we cannot breathe it (Figure \(\PageIndex{1}\)). Bad ozone also absorbs solar ultraviolet light, but it is down near Earth's surface where we can breathe it. For UV protection, we are interested in the total number of ozone molecules between us and the Sun. 90% of ozone molecules are in the stratosphere and 10% are in the troposphere - some down near Earth's surface where we can breathe them. There are important issues affecting human and ecological health for both good ozone and bad ozone. For good ozone, the most important issues are the reduction of ozone globally, the Antarctic Ozone Hole, and Arctic ozone loss that is caused by chlorofluorocarbons. Reduced ozone means more solar UV gets to the ground causing more skin cancer. For bad ozone, the most important issues include the production of too much ozone in cities and nearby regions that is caused by too many pollutants from traffic, industrial processes, power generation, and other human activities. Increased ozone means more people have respiratory and heart problems. Let's look at both the good and the bad, starting with the stratospheric ozone.

- Click for a text description of the Cross Section image.
-
Explanation diagram of the typical vertical ozone profile for the tropics
Stratospheric Ozone (the ozone layer, ~15-35 km) contains 90% of atmospheric ozone beneficial role: acts as primary UV radiation shield Current issues
- long-term global downward trends
- springtime Antarctic ozone hole each year
- springtime arctic ozone losses in several recent years
- episodes of high surface ozone in urban and rural areas
Tropospheric Ozone (0-15 km) contains 10% of atmospheric ozone harmful impact: toxic effects on humans and vegetation current issues
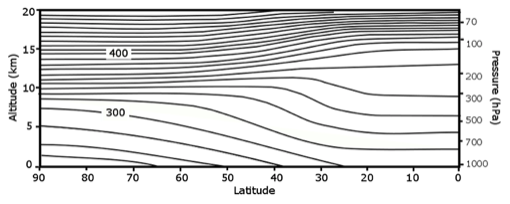
To get the total amount of ozone between us and the Sun, we simply add up the ozone amount starting at the surface and going up to the top of the ozone layer. Note how much more ozone there is in the stratosphere. At higher latitudes, the bottom of the stratospheric ozone layer is at approximately 10-12 km. Recall the following image from Lesson 2:

The process of stratospheric ozone formation starts with ozone (O3), which is made by ultraviolet sunlight in the stratosphere (but not the troposphere, as we shall see). The two reactions are:
\[O_{2}+\operatorname{hard} U V \rightarrow O+O\]
\[O+O_{2}+N_{2} \rightarrow O_{3}+N_{2}\]
Note that N2 doesn't really react in this last chemical equation, but instead, simply bumps into the O3 molecule as it is being formed and stabilizes it by removing some of the energy from O3. We call O3 an oxidant because it can react with some compounds and oxidize them.
This O3 can be broken apart by ultraviolet light to make O2 and O. Usually O combines with O2 to form O3 in this way: O+O2+N2→O3+N2, so nothing really happens, except that the solar energy that breaks apart the O2 ends up as extra energy for the O3 and for the colliding N2 and, as a result, ends up warming the air. Sometimes O collides with O3 and reacts: O+O3→O2+O2. Putting all of the reactions together, we can see the chemical lifecycle of ozone in the stratosphere. This set of reactions was proposed in the 1930s by Chapman:
| O2 + hard UV → O + O | production |
|---|---|
| 2(O + O2 + N2 → O3 + N2) | cycling |
| O3 + UV → O2 + O | cycling |
| O + O3 → O2 + O2 | loss |
| Net: UV → higher T |
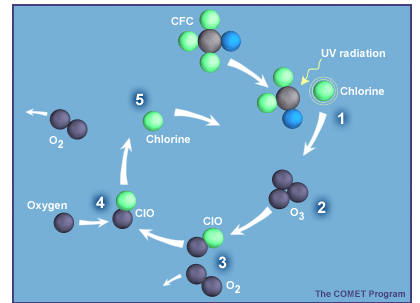
These four reactions could produce the basic characteristics of the ozone layer as it was in the 1940s through the 1970s. However, this theory produced peak ozone levels that were 50 milli-Pascals, not the 25-30 milli-Pascals seen in the first figure above. Thus, the measured levels of stratospheric ozone were about half of those predicted by Chapman's theory - it was a real puzzle. However, in the 1970s, scientists proposed new sets of reactions by other gases that accomplished the same results as the loss reaction shown above. A famous example involved chlorine, which comes mostly from human-made chlorofluorocarbons (CFCs):
| CFCs + UV → product + Cl | production |
|---|---|
| Cl + O3 → ClO + O2 | cycling |
| ClO + O → Cl + O2 | cycling |
| Cl + CH4 → HCl + CH3 | loss |
| Net O3+O: O3 + O → O2 + O2 |
During the cycle, chlorine (Cl) and chlorine monoxide (ClO) aren’t destroyed but instead are just recycled into each other. With each cycle, two ozone molecules are lost (one directly and a second because O almost always reacts with O2 to form O3). This cycle can run for hundreds of thousands of times before Cl gets tied up in HCl. So ClO and Cl levels of tens of parts per trillion of air (10-12) are able to destroy several percent of the few parts per million of O3. Sherry Rowland and Mario Molina figured this cycle out and wrote a paper about it in 1974. They received a Nobel Prize in Chemistry in 1995 for this work. When catalytic cycles involving chlorine, nitrogen oxides, and OH are included with the theory, the agreement between the theory and the measurements gets much better.

Exercise
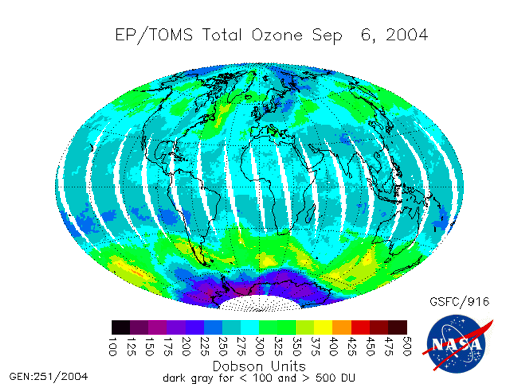
Note that the total ozone amount at midlatitudes is greater than the amount in the tropics. This should seem strange to you because the solar UV that is part of the Chapman mechanism is strongest in the tropics. Why do you think that total ozone is distributed this way?
- Click for answer.
-
ANSWER: The ozone distribution is due to the motion of air through the stratosphere. Air comes from the troposphere into the stratosphere mostly in the tropics and, as it rapidly moves from west to east, it slowly moves from the tropics to near the poles, where it re-enters the troposphere. So most of the ozone is made in the tropics at higher altitudes and then some of this ozone is destroyed by chemical reactions as the ozone is transported poleward and downward. So, while the ozone mixing ratio decreases slightly from tropics to high latitudes, the ozone concentration (moles per volume) increases as it is transported to lower altitudes where the pressure and number of moles is greater, more than twice as large (see the Lesson 2 image above).

The low ozone over Antarctica above is the Antarctic Ozone Hole; the video below (:31) entitled "Ozone Minimums With Graph" (from NASA) shows changes in ozone concentration between 1979 and 2013. VIdeo is not narrated:
The Antarctic ozone hole is an extreme example of the destructive power of chlorine catalytic cycles. Different catalytic cycles dominate the ozone destruction over Antarctica and, to a lesser extent, the Arctic. But, when aided by chemistry on the surfaces of naturally occurring polar stratospheric clouds, all the Cl in the form of HCl is liberated so that the polar catalytic cycles are able to destroy a few percent of the ozone per day in a plug the size of Antarctica from an altitude of 12 km all the way up to 20 km.
Fortunately, the amount of chlorine being injected into the stratosphere is decreasing due to the Montreal Protocol, the world’s first international global environmental treaty.


