
5.6.1: Uniaxial Interference Figures
- Page ID
- 19130

\( \newcommand{\vecs}[1]{\overset { \scriptstyle \rightharpoonup} {\mathbf{#1}} } \)
\( \newcommand{\vecd}[1]{\overset{-\!-\!\rightharpoonup}{\vphantom{a}\smash {#1}}} \)
\( \newcommand{\dsum}{\displaystyle\sum\limits} \)
\( \newcommand{\dint}{\displaystyle\int\limits} \)
\( \newcommand{\dlim}{\displaystyle\lim\limits} \)
\( \newcommand{\id}{\mathrm{id}}\) \( \newcommand{\Span}{\mathrm{span}}\)
( \newcommand{\kernel}{\mathrm{null}\,}\) \( \newcommand{\range}{\mathrm{range}\,}\)
\( \newcommand{\RealPart}{\mathrm{Re}}\) \( \newcommand{\ImaginaryPart}{\mathrm{Im}}\)
\( \newcommand{\Argument}{\mathrm{Arg}}\) \( \newcommand{\norm}[1]{\| #1 \|}\)
\( \newcommand{\inner}[2]{\langle #1, #2 \rangle}\)
\( \newcommand{\Span}{\mathrm{span}}\)
\( \newcommand{\id}{\mathrm{id}}\)
\( \newcommand{\Span}{\mathrm{span}}\)
\( \newcommand{\kernel}{\mathrm{null}\,}\)
\( \newcommand{\range}{\mathrm{range}\,}\)
\( \newcommand{\RealPart}{\mathrm{Re}}\)
\( \newcommand{\ImaginaryPart}{\mathrm{Im}}\)
\( \newcommand{\Argument}{\mathrm{Arg}}\)
\( \newcommand{\norm}[1]{\| #1 \|}\)
\( \newcommand{\inner}[2]{\langle #1, #2 \rangle}\)
\( \newcommand{\Span}{\mathrm{span}}\) \( \newcommand{\AA}{\unicode[.8,0]{x212B}}\)
\( \newcommand{\vectorA}[1]{\vec{#1}} % arrow\)
\( \newcommand{\vectorAt}[1]{\vec{\text{#1}}} % arrow\)
\( \newcommand{\vectorB}[1]{\overset { \scriptstyle \rightharpoonup} {\mathbf{#1}} } \)
\( \newcommand{\vectorC}[1]{\textbf{#1}} \)
\( \newcommand{\vectorD}[1]{\overrightarrow{#1}} \)
\( \newcommand{\vectorDt}[1]{\overrightarrow{\text{#1}}} \)
\( \newcommand{\vectE}[1]{\overset{-\!-\!\rightharpoonup}{\vphantom{a}\smash{\mathbf {#1}}}} \)
\( \newcommand{\vecs}[1]{\overset { \scriptstyle \rightharpoonup} {\mathbf{#1}} } \)
\( \newcommand{\vecd}[1]{\overset{-\!-\!\rightharpoonup}{\vphantom{a}\smash {#1}}} \)
\(\newcommand{\avec}{\mathbf a}\) \(\newcommand{\bvec}{\mathbf b}\) \(\newcommand{\cvec}{\mathbf c}\) \(\newcommand{\dvec}{\mathbf d}\) \(\newcommand{\dtil}{\widetilde{\mathbf d}}\) \(\newcommand{\evec}{\mathbf e}\) \(\newcommand{\fvec}{\mathbf f}\) \(\newcommand{\nvec}{\mathbf n}\) \(\newcommand{\pvec}{\mathbf p}\) \(\newcommand{\qvec}{\mathbf q}\) \(\newcommand{\svec}{\mathbf s}\) \(\newcommand{\tvec}{\mathbf t}\) \(\newcommand{\uvec}{\mathbf u}\) \(\newcommand{\vvec}{\mathbf v}\) \(\newcommand{\wvec}{\mathbf w}\) \(\newcommand{\xvec}{\mathbf x}\) \(\newcommand{\yvec}{\mathbf y}\) \(\newcommand{\zvec}{\mathbf z}\) \(\newcommand{\rvec}{\mathbf r}\) \(\newcommand{\mvec}{\mathbf m}\) \(\newcommand{\zerovec}{\mathbf 0}\) \(\newcommand{\onevec}{\mathbf 1}\) \(\newcommand{\real}{\mathbb R}\) \(\newcommand{\twovec}[2]{\left[\begin{array}{r}#1 \\ #2 \end{array}\right]}\) \(\newcommand{\ctwovec}[2]{\left[\begin{array}{c}#1 \\ #2 \end{array}\right]}\) \(\newcommand{\threevec}[3]{\left[\begin{array}{r}#1 \\ #2 \\ #3 \end{array}\right]}\) \(\newcommand{\cthreevec}[3]{\left[\begin{array}{c}#1 \\ #2 \\ #3 \end{array}\right]}\) \(\newcommand{\fourvec}[4]{\left[\begin{array}{r}#1 \\ #2 \\ #3 \\ #4 \end{array}\right]}\) \(\newcommand{\cfourvec}[4]{\left[\begin{array}{c}#1 \\ #2 \\ #3 \\ #4 \end{array}\right]}\) \(\newcommand{\fivevec}[5]{\left[\begin{array}{r}#1 \\ #2 \\ #3 \\ #4 \\ #5 \\ \end{array}\right]}\) \(\newcommand{\cfivevec}[5]{\left[\begin{array}{c}#1 \\ #2 \\ #3 \\ #4 \\ #5 \\ \end{array}\right]}\) \(\newcommand{\mattwo}[4]{\left[\begin{array}{rr}#1 \amp #2 \\ #3 \amp #4 \\ \end{array}\right]}\) \(\newcommand{\laspan}[1]{\text{Span}\{#1\}}\) \(\newcommand{\bcal}{\cal B}\) \(\newcommand{\ccal}{\cal C}\) \(\newcommand{\scal}{\cal S}\) \(\newcommand{\wcal}{\cal W}\) \(\newcommand{\ecal}{\cal E}\) \(\newcommand{\coords}[2]{\left\{#1\right\}_{#2}}\) \(\newcommand{\gray}[1]{\color{gray}{#1}}\) \(\newcommand{\lgray}[1]{\color{lightgray}{#1}}\) \(\newcommand{\rank}{\operatorname{rank}}\) \(\newcommand{\row}{\text{Row}}\) \(\newcommand{\col}{\text{Col}}\) \(\renewcommand{\row}{\text{Row}}\) \(\newcommand{\nul}{\text{Nul}}\) \(\newcommand{\var}{\text{Var}}\) \(\newcommand{\corr}{\text{corr}}\) \(\newcommand{\len}[1]{\left|#1\right|}\) \(\newcommand{\bbar}{\overline{\bvec}}\) \(\newcommand{\bhat}{\widehat{\bvec}}\) \(\newcommand{\bperp}{\bvec^\perp}\) \(\newcommand{\xhat}{\widehat{\xvec}}\) \(\newcommand{\vhat}{\widehat{\vvec}}\) \(\newcommand{\uhat}{\widehat{\uvec}}\) \(\newcommand{\what}{\widehat{\wvec}}\) \(\newcommand{\Sighat}{\widehat{\Sigma}}\) \(\newcommand{\lt}{<}\) \(\newcommand{\gt}{>}\) \(\newcommand{\amp}{&}\) \(\definecolor{fillinmathshade}{gray}{0.9}\)The best way to learn the optic sign of a uniaxial mineral, is to obtain an interference figure looking down, or nearly down, a crystal’s optic axis. The figure obtained is an optic axis (OA) figure; Figure 5.65 shows an example. Finding a grain that gives an OA figure is normally not difficult. Grains oriented with the optic axis vertical appear isotropic (when viewed under normal XP light) because they produce no double refraction. Grains oriented with the optic axis close to vertical have low retardation and, therefore, low-order interference colors.
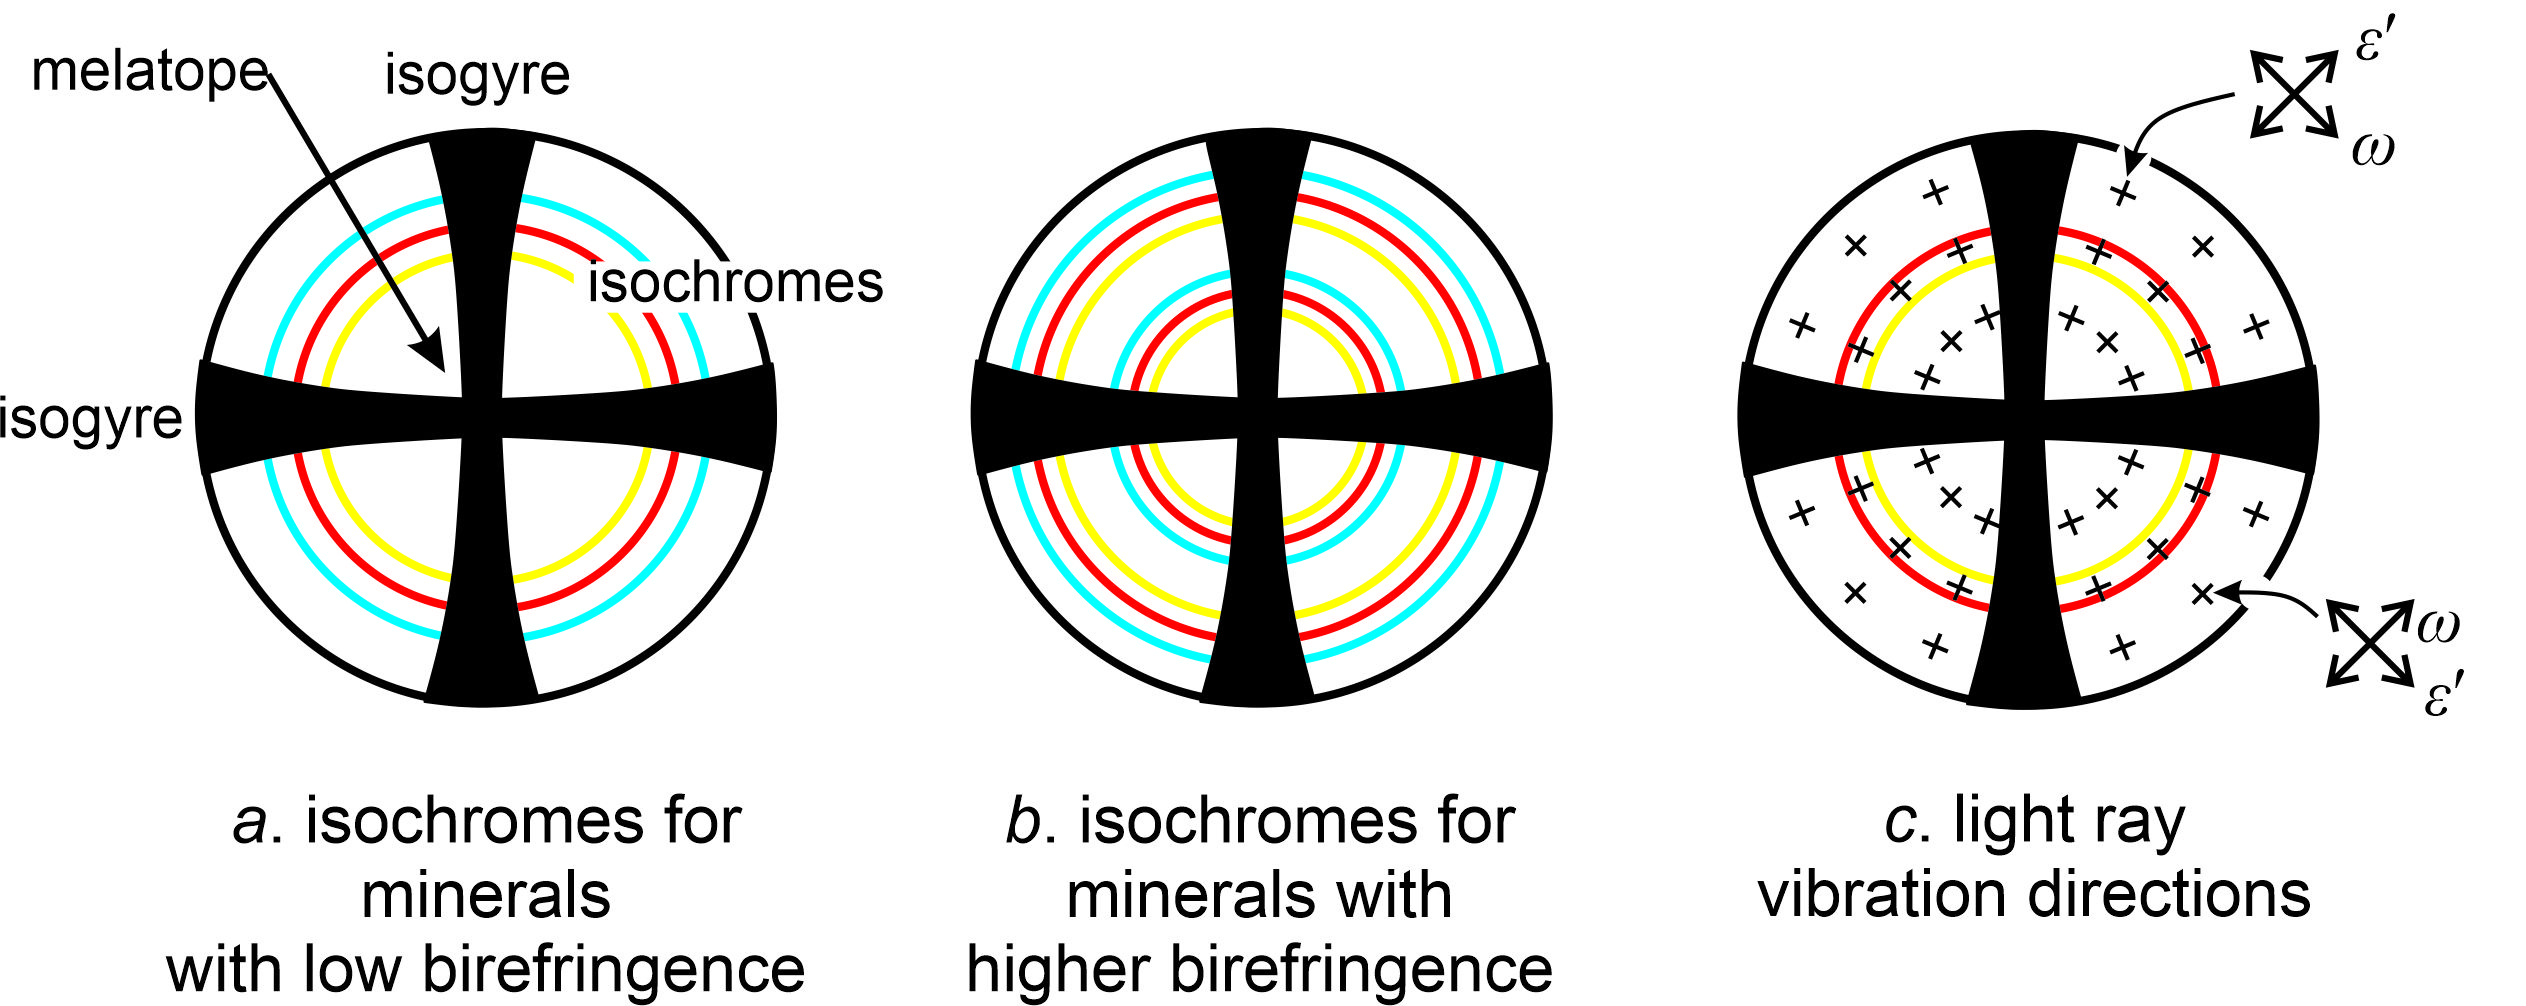
A centered uniaxial OA figure contains a black cross, like the one seen in the photo above (Figure 5.65), and depicted in Figure 5.66a, b and c. The cross will not move much if we rotate the stage. The center of the cross, called the melatope, corresponds to the direction of emergence of the optic axis. We call the dark bands forming the cross isogyres. The surrounding colored rings, if present, are isochromes. They are bands of equal retardation caused by the light entering the crystal at different angles (because of the conoscopic lens). Interference figures for minerals with very low birefringence, like quartz and feldspars, may not show any colored isochromes but most minerals do. Minerals with low to moderate birefringence typically show a few isochromes (Figure 5.66a), and interference figures for minerals with high birefringence commonly show many (Figure 5.65 and Figure 5.66b).
As shown in Figure 5.66c, in all parts of a uniaxial optic axis interference figure εʹ vibrates radially (along the radius of the interference figure) and ω vibrates tangent to isochromes. One way to remember these relationships is with the acronym WITTI for the mnemonic “ω is tangent to isochrome.”
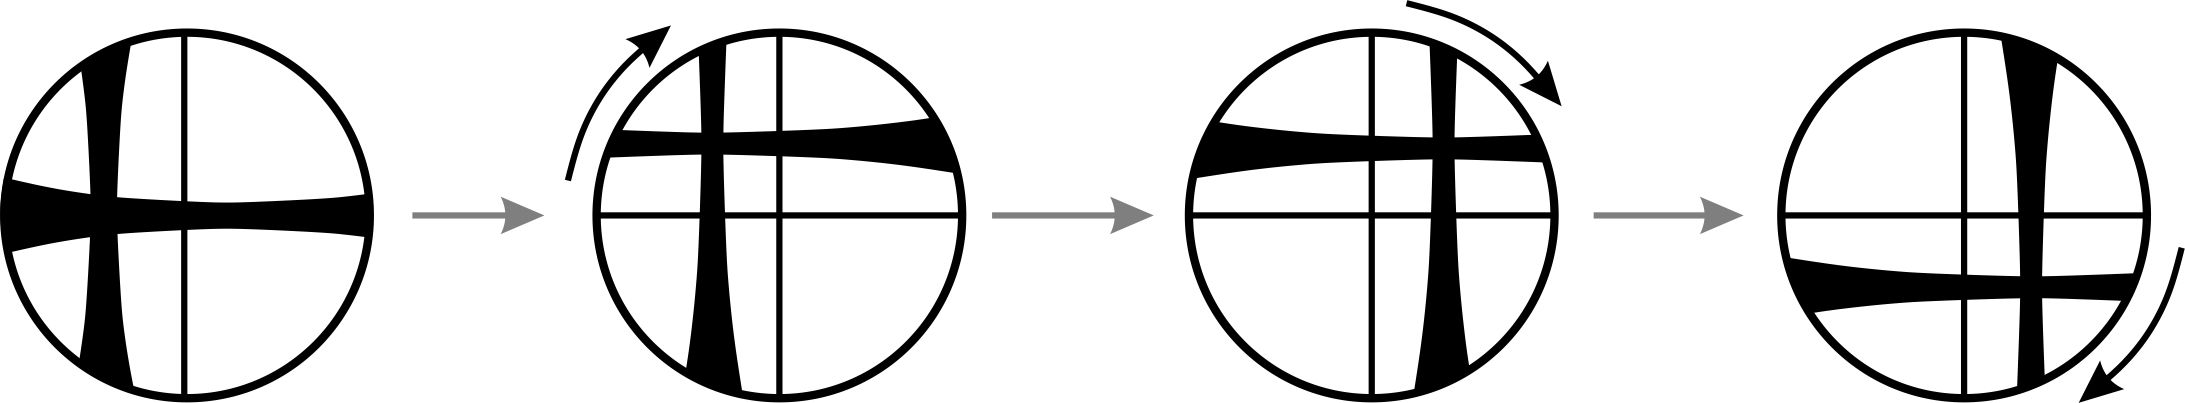
Sometimes, we obtain an optic axis figure but the optic axis is not perfectly vertical. If so, the black cross will be off center. As we rotate the stage the cross will precess as the melatope follows a circular path (Figure 5.67). The two links below will take you to short videos showing uniaxial interference figures precessing during stage rotation. But, even if the interference figure is somewhat off center, we can use it to learn the optic sign. And once we have an OA figure, perfectly centered or not, we use an accessory plate to learn whether a mineral is positive or negative. We describe this procedure below.
Caveat: Most randomly oriented uniaxial mineral grains do not exhibit a centered OA figure. The optic axis is only one direction in the crystal and grains are unlikely to have their optic axis vertical. If the optic axis of a grain lies parallel to the stage of the microscope, we get an optic normal figure, also called a flash figure. The flash figure appears as a vague cross or blob that nearly fills the field of view when the grain is at extinction (when the optic axis is perpendicular to a polarizer). Upon stage rotation, it splits into two curved isogyres flashing in and out of the field of view with a few degrees of stage rotation. Biaxial flash figures have the same general appearance.
5.6.1.1 Determining the Optic Sign of a Uniaxial Mineral
To know the optic sign of a uniaxial mineral, we must determine whether ω > ε or ε > ω. We make this determination by examining an optic axis figure and using an accessory plate with known orientation of the fast and slow rays. Standard accessory plates have their slow direction oriented southwest-northeast at 45° to both polarizers. We insert the plate, and we observe interference color changes or isochrome (color ring) movements in the southwest and northeast quadrants of the interference figure (Figure 5.68).
If the slow direction of the accessory plate corresponds to the slow direction of the mineral, retardation will add and we will see higher order interference colors. If they do not correspond, retardation will, in part, cancel and we will see lower order colors. In a uniaxial optic axis figure, εʹ vibrates radially. So, if interference colors in the southwest and northeast quadrants shift to higher orders when we insert the plate (or wedge), addition of retardation has occurred. So, εʹ is the slow ray and the crystal is uniaxial positive. Subtraction (lower-order interference colors) in the southwest and northeast quadrants indicates that εʹ is the fast ray, and the crystal is optically negative. Because εʹ vibrates parallel to the prism axis (c-axis) in prismatic uniaxial minerals, the optic sign is the same as the sign of elongation.
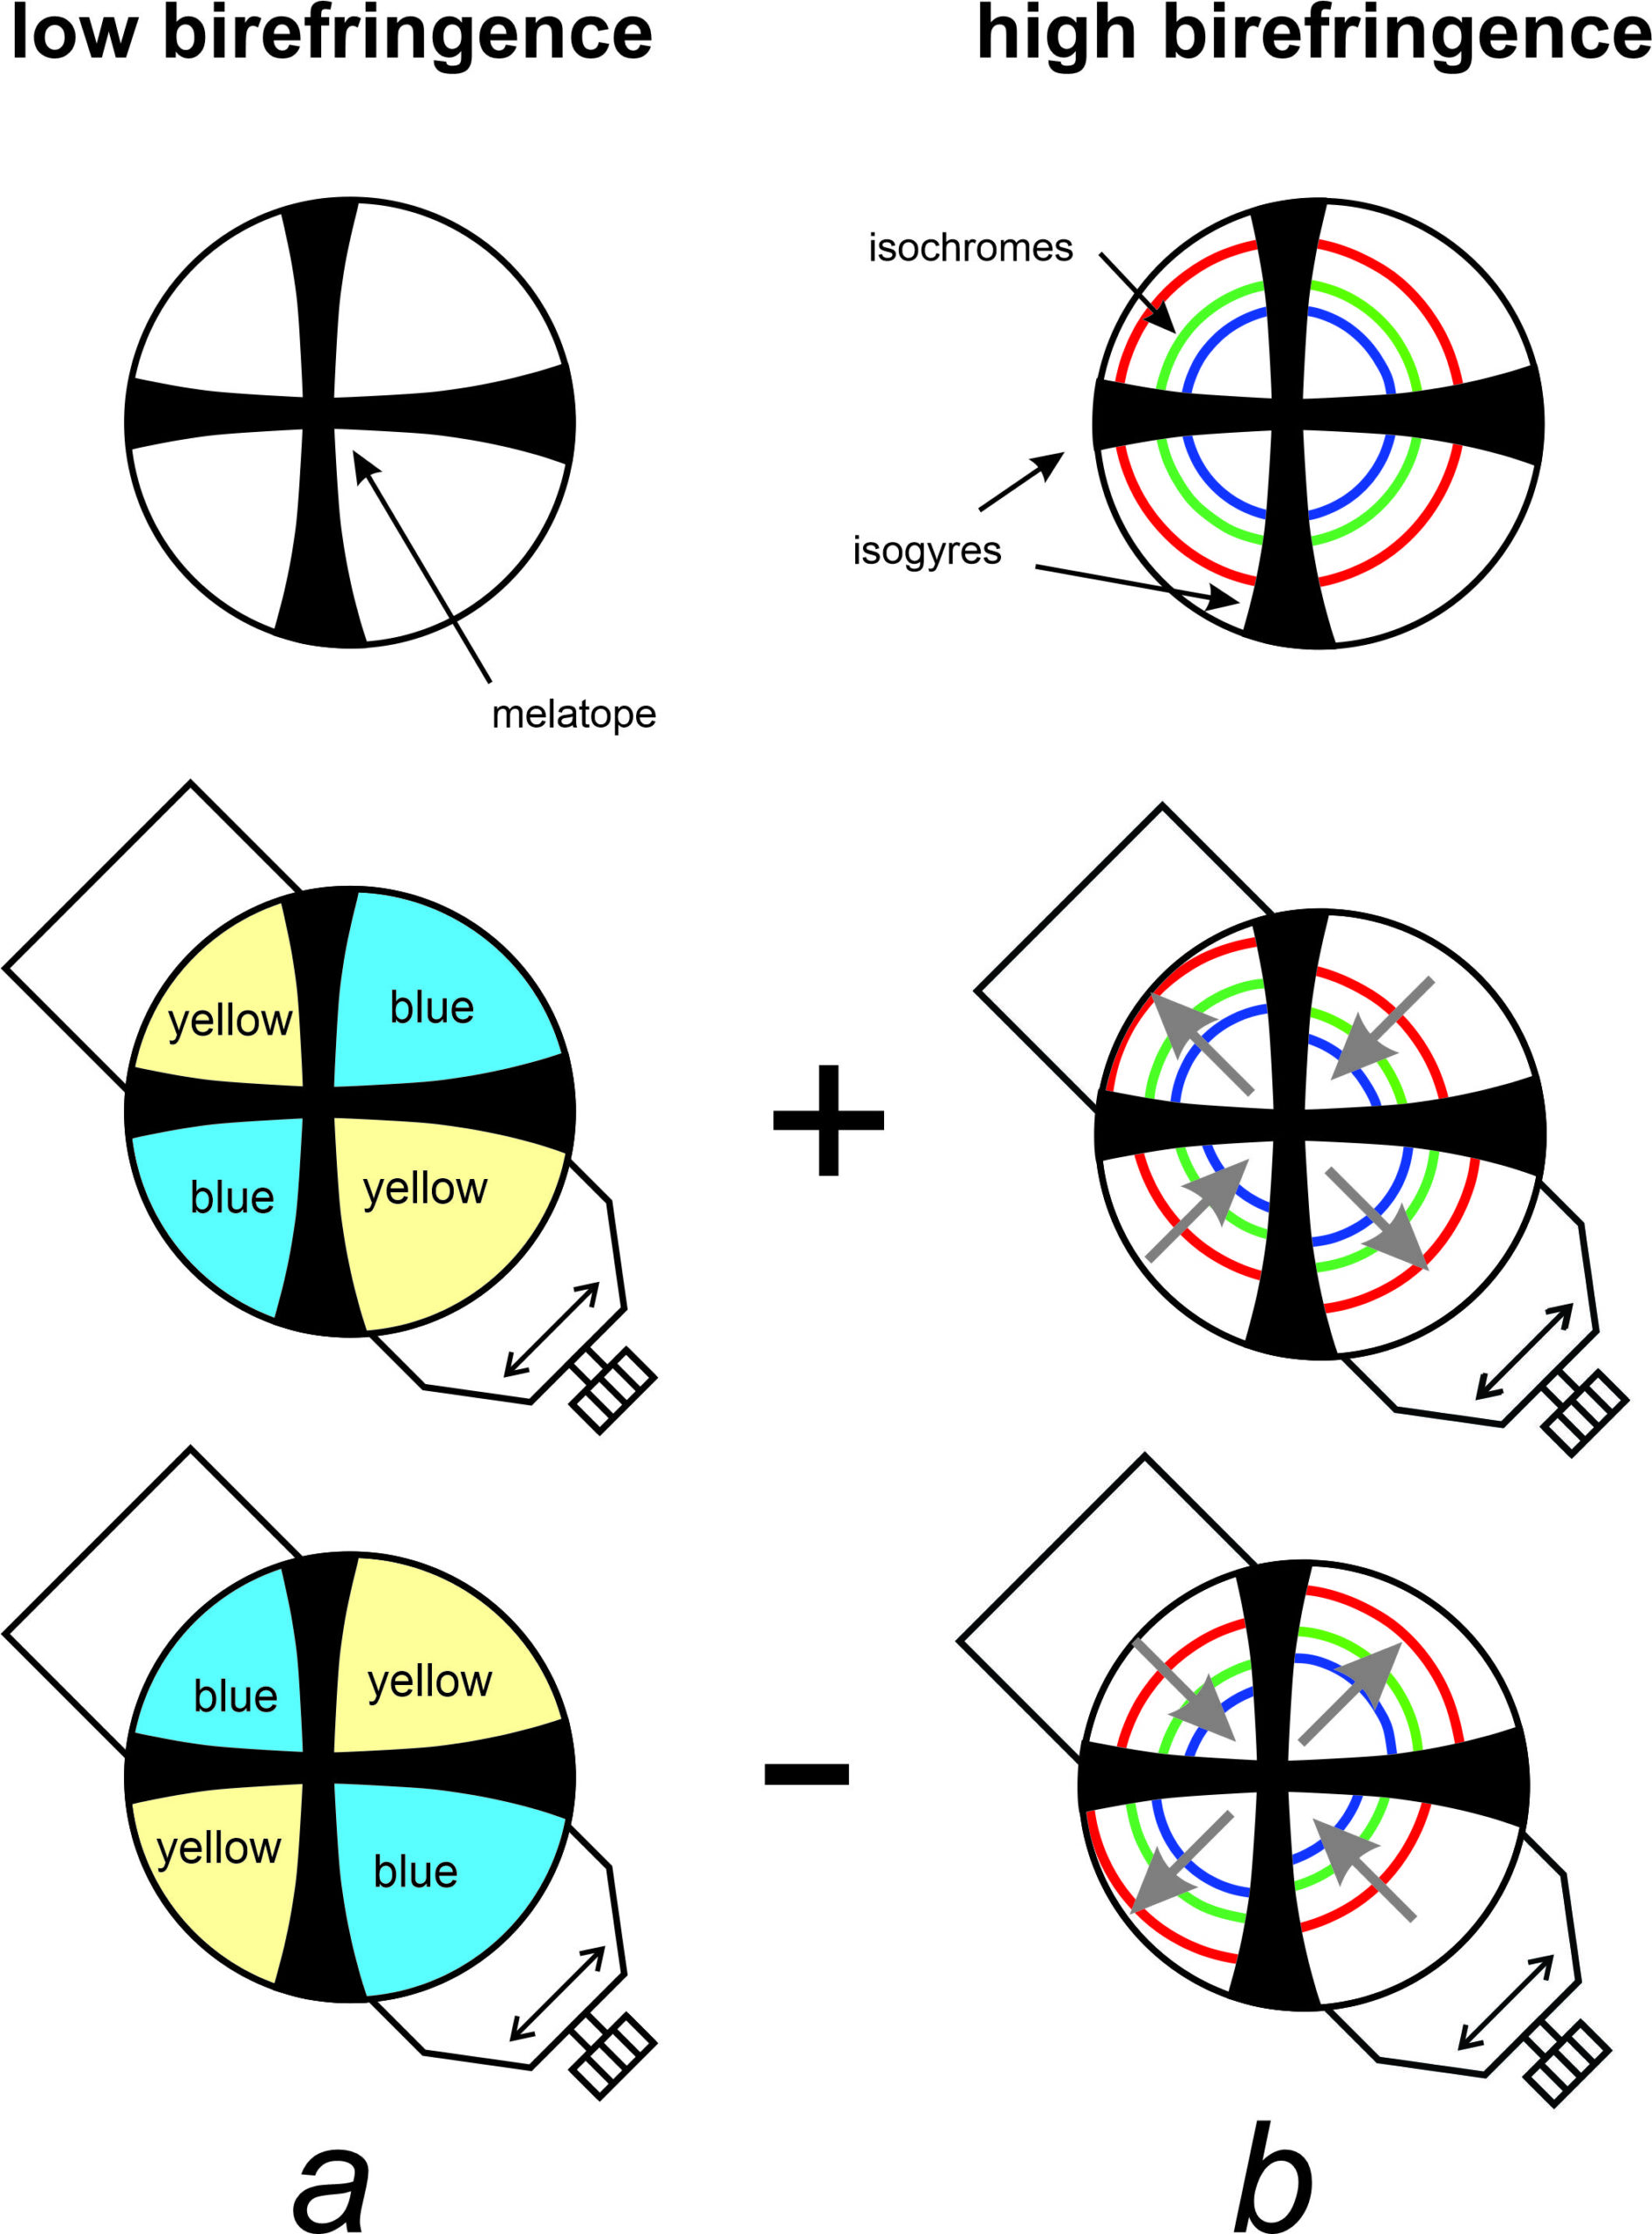
Although we could use a quartz wedge, we normally use a full-wave accessory plate when the optic axis figure shows low-order interference colors. In positive crystals, addition produces light blue in the southwest and northeast quadrants of the interference figure (Figure 5.68a), while subtraction produces light yellow in the northwest and southeast quadrants. In negative crystals, the effect is the opposite. If several different color rings (isochromes) are visible, the blue and yellow colors will only appear on the innermost rings near the melatope (the center of the black cross).
We can sometimes use a full-wave plate, but normally use a quartz wedge, to learn an optic sign for minerals that exhibit high-order interference colors. The retardation of the quartz will add to the retardation of the unknown mineral in two quadrants as we insert the wedge. It will also subtract from the retardation in the other two. The result will be color rings (isochromes) moving inward in quadrants where addition occurs, and outward in quadrants where subtraction occurs (Figure 5.68b). For positive minerals, this means that colors move inward in the southwest and northeast quadrants and outward in the northwest and southeast quadrants. For negative minerals, the motion is opposite.