
2.3: Lab 3 - Working with Stereographic Projections
- Page ID
- 12508

\( \newcommand{\vecs}[1]{\overset { \scriptstyle \rightharpoonup} {\mathbf{#1}} } \)
\( \newcommand{\vecd}[1]{\overset{-\!-\!\rightharpoonup}{\vphantom{a}\smash {#1}}} \)
\( \newcommand{\id}{\mathrm{id}}\) \( \newcommand{\Span}{\mathrm{span}}\)
( \newcommand{\kernel}{\mathrm{null}\,}\) \( \newcommand{\range}{\mathrm{range}\,}\)
\( \newcommand{\RealPart}{\mathrm{Re}}\) \( \newcommand{\ImaginaryPart}{\mathrm{Im}}\)
\( \newcommand{\Argument}{\mathrm{Arg}}\) \( \newcommand{\norm}[1]{\| #1 \|}\)
\( \newcommand{\inner}[2]{\langle #1, #2 \rangle}\)
\( \newcommand{\Span}{\mathrm{span}}\)
\( \newcommand{\id}{\mathrm{id}}\)
\( \newcommand{\Span}{\mathrm{span}}\)
\( \newcommand{\kernel}{\mathrm{null}\,}\)
\( \newcommand{\range}{\mathrm{range}\,}\)
\( \newcommand{\RealPart}{\mathrm{Re}}\)
\( \newcommand{\ImaginaryPart}{\mathrm{Im}}\)
\( \newcommand{\Argument}{\mathrm{Arg}}\)
\( \newcommand{\norm}[1]{\| #1 \|}\)
\( \newcommand{\inner}[2]{\langle #1, #2 \rangle}\)
\( \newcommand{\Span}{\mathrm{span}}\) \( \newcommand{\AA}{\unicode[.8,0]{x212B}}\)
\( \newcommand{\vectorA}[1]{\vec{#1}} % arrow\)
\( \newcommand{\vectorAt}[1]{\vec{\text{#1}}} % arrow\)
\( \newcommand{\vectorB}[1]{\overset { \scriptstyle \rightharpoonup} {\mathbf{#1}} } \)
\( \newcommand{\vectorC}[1]{\textbf{#1}} \)
\( \newcommand{\vectorD}[1]{\overrightarrow{#1}} \)
\( \newcommand{\vectorDt}[1]{\overrightarrow{\text{#1}}} \)
\( \newcommand{\vectE}[1]{\overset{-\!-\!\rightharpoonup}{\vphantom{a}\smash{\mathbf {#1}}}} \)
\( \newcommand{\vecs}[1]{\overset { \scriptstyle \rightharpoonup} {\mathbf{#1}} } \)
\( \newcommand{\vecd}[1]{\overset{-\!-\!\rightharpoonup}{\vphantom{a}\smash {#1}}} \)
\(\newcommand{\avec}{\mathbf a}\) \(\newcommand{\bvec}{\mathbf b}\) \(\newcommand{\cvec}{\mathbf c}\) \(\newcommand{\dvec}{\mathbf d}\) \(\newcommand{\dtil}{\widetilde{\mathbf d}}\) \(\newcommand{\evec}{\mathbf e}\) \(\newcommand{\fvec}{\mathbf f}\) \(\newcommand{\nvec}{\mathbf n}\) \(\newcommand{\pvec}{\mathbf p}\) \(\newcommand{\qvec}{\mathbf q}\) \(\newcommand{\svec}{\mathbf s}\) \(\newcommand{\tvec}{\mathbf t}\) \(\newcommand{\uvec}{\mathbf u}\) \(\newcommand{\vvec}{\mathbf v}\) \(\newcommand{\wvec}{\mathbf w}\) \(\newcommand{\xvec}{\mathbf x}\) \(\newcommand{\yvec}{\mathbf y}\) \(\newcommand{\zvec}{\mathbf z}\) \(\newcommand{\rvec}{\mathbf r}\) \(\newcommand{\mvec}{\mathbf m}\) \(\newcommand{\zerovec}{\mathbf 0}\) \(\newcommand{\onevec}{\mathbf 1}\) \(\newcommand{\real}{\mathbb R}\) \(\newcommand{\twovec}[2]{\left[\begin{array}{r}#1 \\ #2 \end{array}\right]}\) \(\newcommand{\ctwovec}[2]{\left[\begin{array}{c}#1 \\ #2 \end{array}\right]}\) \(\newcommand{\threevec}[3]{\left[\begin{array}{r}#1 \\ #2 \\ #3 \end{array}\right]}\) \(\newcommand{\cthreevec}[3]{\left[\begin{array}{c}#1 \\ #2 \\ #3 \end{array}\right]}\) \(\newcommand{\fourvec}[4]{\left[\begin{array}{r}#1 \\ #2 \\ #3 \\ #4 \end{array}\right]}\) \(\newcommand{\cfourvec}[4]{\left[\begin{array}{c}#1 \\ #2 \\ #3 \\ #4 \end{array}\right]}\) \(\newcommand{\fivevec}[5]{\left[\begin{array}{r}#1 \\ #2 \\ #3 \\ #4 \\ #5 \\ \end{array}\right]}\) \(\newcommand{\cfivevec}[5]{\left[\begin{array}{c}#1 \\ #2 \\ #3 \\ #4 \\ #5 \\ \end{array}\right]}\) \(\newcommand{\mattwo}[4]{\left[\begin{array}{rr}#1 \amp #2 \\ #3 \amp #4 \\ \end{array}\right]}\) \(\newcommand{\laspan}[1]{\text{Span}\{#1\}}\) \(\newcommand{\bcal}{\cal B}\) \(\newcommand{\ccal}{\cal C}\) \(\newcommand{\scal}{\cal S}\) \(\newcommand{\wcal}{\cal W}\) \(\newcommand{\ecal}{\cal E}\) \(\newcommand{\coords}[2]{\left\{#1\right\}_{#2}}\) \(\newcommand{\gray}[1]{\color{gray}{#1}}\) \(\newcommand{\lgray}[1]{\color{lightgray}{#1}}\) \(\newcommand{\rank}{\operatorname{rank}}\) \(\newcommand{\row}{\text{Row}}\) \(\newcommand{\col}{\text{Col}}\) \(\renewcommand{\row}{\text{Row}}\) \(\newcommand{\nul}{\text{Nul}}\) \(\newcommand{\var}{\text{Var}}\) \(\newcommand{\corr}{\text{corr}}\) \(\newcommand{\len}[1]{\left|#1\right|}\) \(\newcommand{\bbar}{\overline{\bvec}}\) \(\newcommand{\bhat}{\widehat{\bvec}}\) \(\newcommand{\bperp}{\bvec^\perp}\) \(\newcommand{\xhat}{\widehat{\xvec}}\) \(\newcommand{\vhat}{\widehat{\vvec}}\) \(\newcommand{\uhat}{\widehat{\uvec}}\) \(\newcommand{\what}{\widehat{\wvec}}\) \(\newcommand{\Sighat}{\widehat{\Sigma}}\) \(\newcommand{\lt}{<}\) \(\newcommand{\gt}{>}\) \(\newcommand{\amp}{&}\) \(\definecolor{fillinmathshade}{gray}{0.9}\)Basic plotting operations
Setting up the projection
You will need a Wullf net. You can download one here: WULFF NET 15 cm.
For use in this course, your net must be 15 cm in diameter. If you download your own, print the Wullf net on a plain sheet of paper at at 100% scale. (Many computers will automatically shrink the image to fit a smaller paper area by default. Use the options in the printer dialog on your computer to print at 100%.)
Next, use an an old fashioned thumb tack to make a small hole through the exact centre of the net. Then insert the tack pointing upwards, through the hole.
Now, take a sheet of tracing paper, and press it over the net so that the thumb tack makes a neat hole in the centre.
Then, trace the circular outline, the edge of the net, known as the primitive, on the tracing paper. Mark the four cardinal points N, E, S, W, on the tracing paper[1] with small ‘ticks’, and distinguish N with an arrow.
You should now be able to rotate your projection (on the tracing paper) over the net, and then return it to the starting position with N at the top.
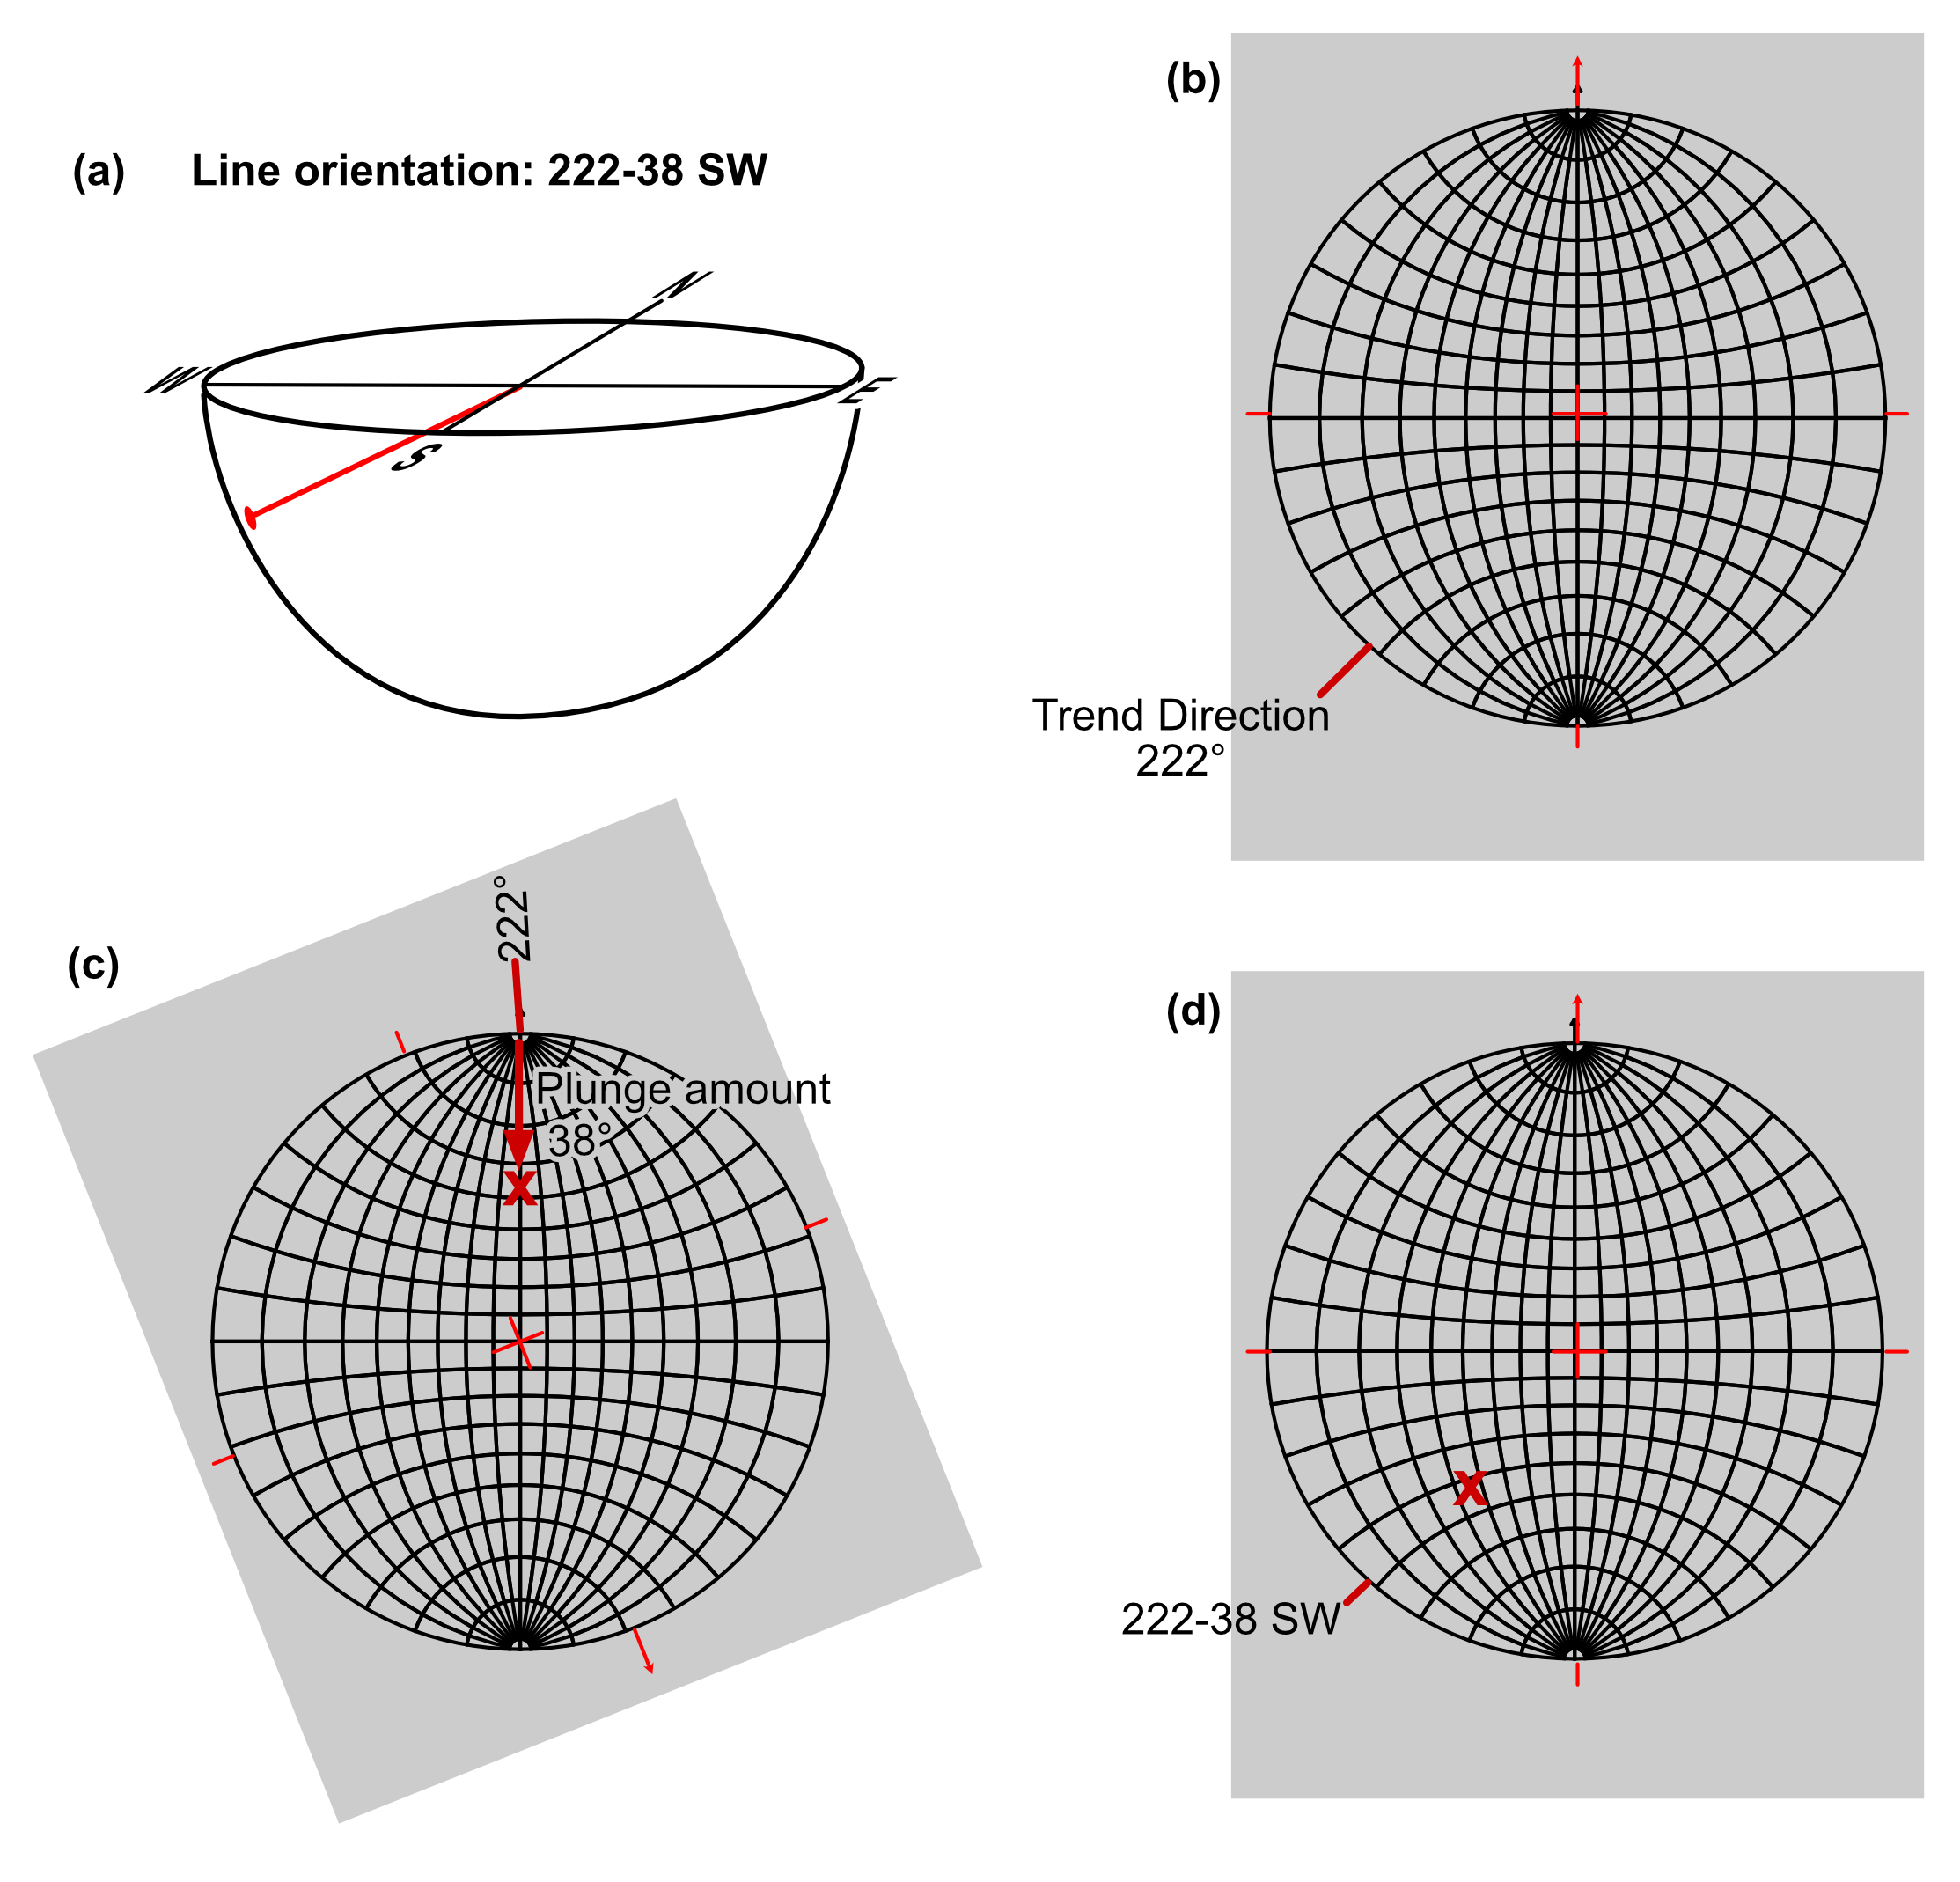
Plotting the orientation of a line
The simplest geometric information one can display on a stereographic projection is the orientation of a vertical line. It projects as a point in the middle of the stereonet. The next easiest information to portray is the orientation of a line that has a trend due north or due south. With the overlay in the reference position, count the amount of plunge from either the north or south index mark (as appropriate) on the primitive towards the center of the net along the N-S line, and place a dot on the tracing paper at this position. Remember, a line is represented by a point on the stereogram.
The procedure for a line of general orientation is as follows:
a) Visualize the problem first, using a pencil. Imagine that the pencil originates at the centre of the net, and extends downward to intersect a “bowl” below the net. In which quadrant will it intersect the hemisphere, and whether it will be close to the primitive or far away?
b) With the overlay in the reference position, make a mark on the primitive that corresponds to the trend of the line.
c) Rotate the overlay until the mark is aligned with a straight radius of the net; count the angle of plunge inwards from the primitive along the straight radius, and make a small cross.
d) Return the overlay to the reference position and check that the cross is in the expected general position.
Example problem: Plot the point L representing the line 300-50. On your projection label the angles corresponding to the trend and plunge.
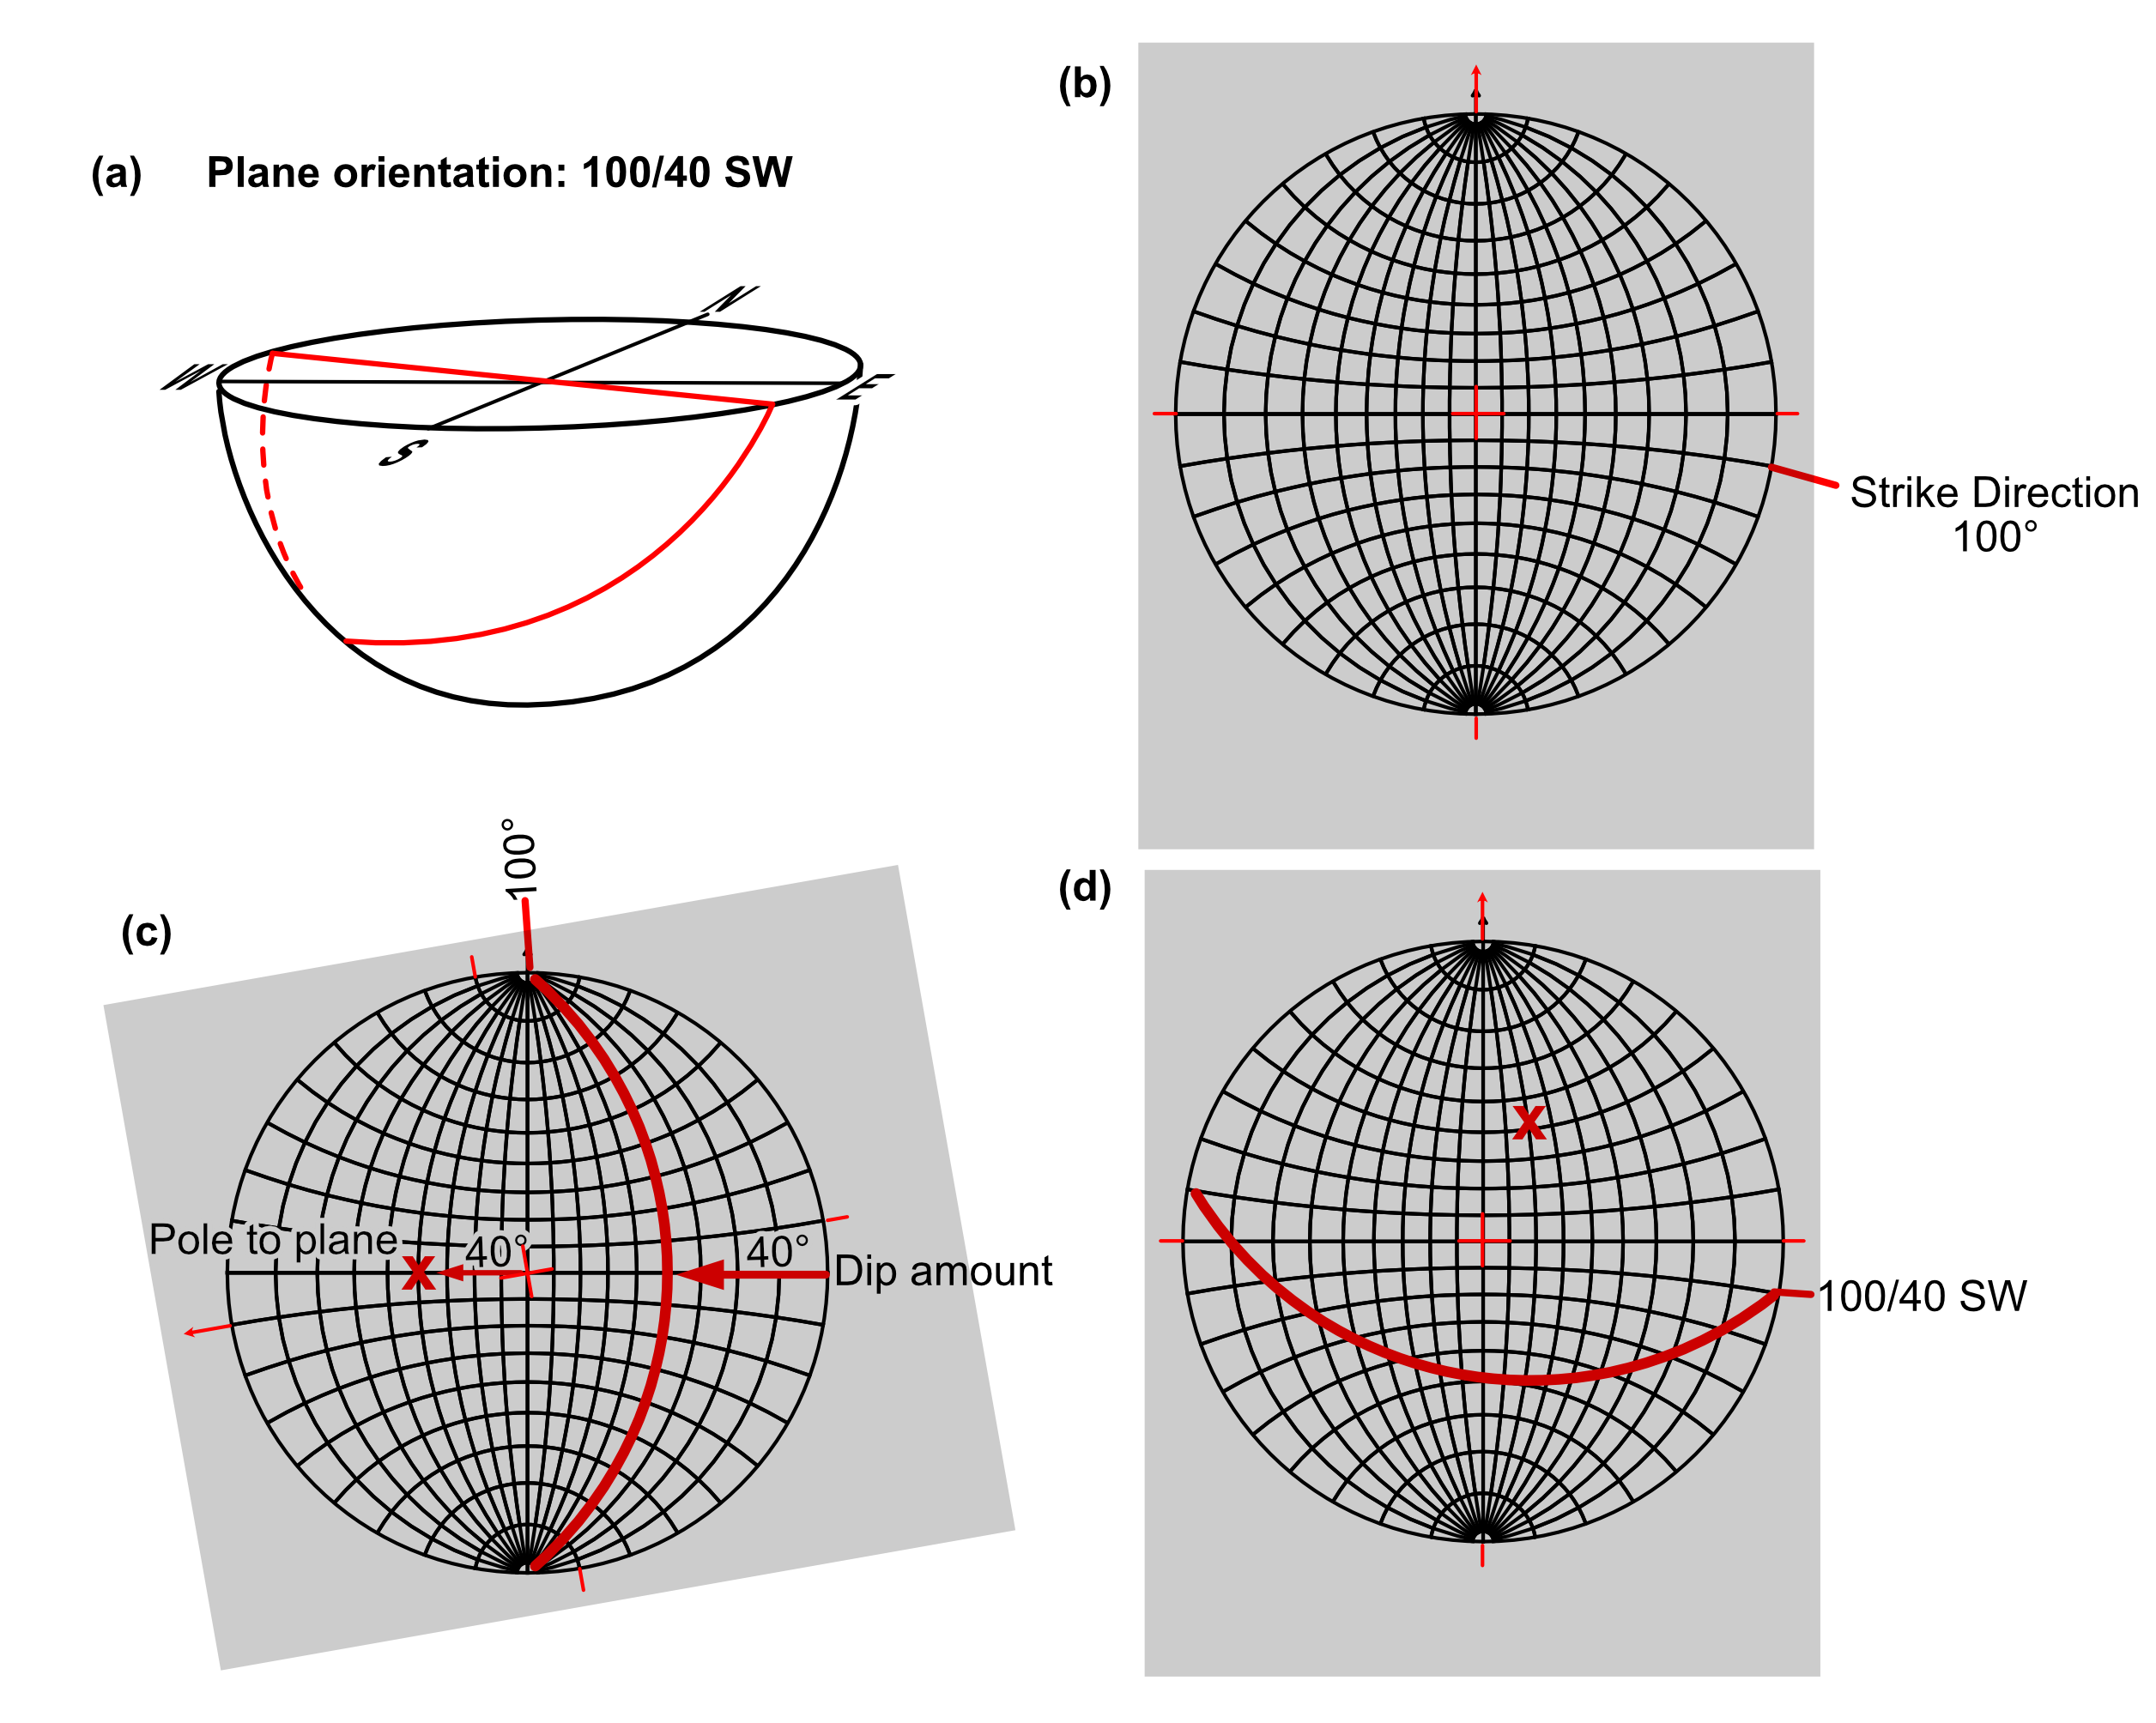
Plotting a plane and its pole
Horizontal and vertical planes are straightforward to plot. A horizontal plane is represented by the primitive. N-S and E-W striking vertical planes are represented by the straight lines on the stereonet connecting the N-S poles and E-W positions, respectively. Other vertical planes are straight diameters oriented parallel to the strike.
To plot an inclined plane follow these steps:
a) Visualize the problem using your hand or a piece of paper. Imagine that this plane object passes through the centre of the plot and intersects a hemisphere below the net. In which quadrants will the curved line of intersection lie, and how close to the primitive will that curve be? Where will its pole be? The pole should be on the opposite side of the net. If the great circle is near the primitive then the pole will be near the centre, and vice versa.
b) With the overlay in the reference position make a mark on the primitive that corresponds to the strike direction of the plane. As a matter of sound practice, you should always make this mark on the strike direction according to the right hand rule.
c) Rotate the stereonet until the mark is aligned with the top point on the net. From the right hand side of the net, count degrees inward along the straight radius, until you reach the amount of dip. Trace the great circle which passes through this point; optionally, to plot the pole to the plane, count the same number of degrees outward from the centre along the straight radius towards the left side of the net and mark a small ‘x’.
d) Return the overlay to the reference position and check that the great circle corresponds with the anticipated orientation.
Example problem: Construct the great circle representing the plane 120/50, and its pole. On the projection label the angles corresponding to the plane’s strike, dip and numerical dip direction.
Plotting a line in a plane by rake or pitch
A line that lies in a plane plots as a point on a great circle.
a) Plot the plane as a great circle following steps a-c of the previous procedure.
b) From the top point of the net, count degrees along the great circle you have just traced until you reach the desired angle of rake.
Measuring the orientation of a line from its pole
Finding the orientation of a line from its pole is just the reverse of the plotting procedure above.
a) Rotate the net to place the pole on any of the four straight radii. Mark a point on the primitive at the end of this straight radius.
b) Count degrees of plunge inward from the primitive until you come to the pole. Record the plunge.
c) Return the net to the reference position. Count degrees clockwise round the primitive until you come to the mark made in step a. This is the trend.
Example problem: measure the orientation of the line you plotted in the first example and see if you get the answer you started with!
Measuring the strike and dip of a plane from its great circle
Measuring the strike and dip represented by a great circle is just the reverse of the plotting procedure for a plane.
a) Rotate the net until the plane is on a great circle on the right hand half of the net. (This ensures an answer consistent with right-hand rule.)
b) Mark the end of the great circle that is at the top of the net.
c) Count degrees of dip inward from the right hand side along the straight radius until you come to the great circle.
d) Return to reference position and note the azimuth of the mark made in step b. This is the strike.
Measuring the strike and dip of a plane from its pole
A pole is perpendicular to the plane it represents, so steps a and c are done in a way that seems opposite to the procedure when working with a great circle, or trace!
a) Rotate the net until the pole is on the straight radius on the left side of the net.
b) Mark the end of the great circle that is at the top of the net.
c) Count degrees of dip outward from the centre along the straight radius toward the left hand side of the net until you come to the pole.
d) Return to reference position and note the azimuth of the mark made in b. This is the strike.
Example problem: measure the orientation of the plane you plotted in the first example by working backwards from its pole and see if you get the answer you started with!
Constructions on the stereographic projection
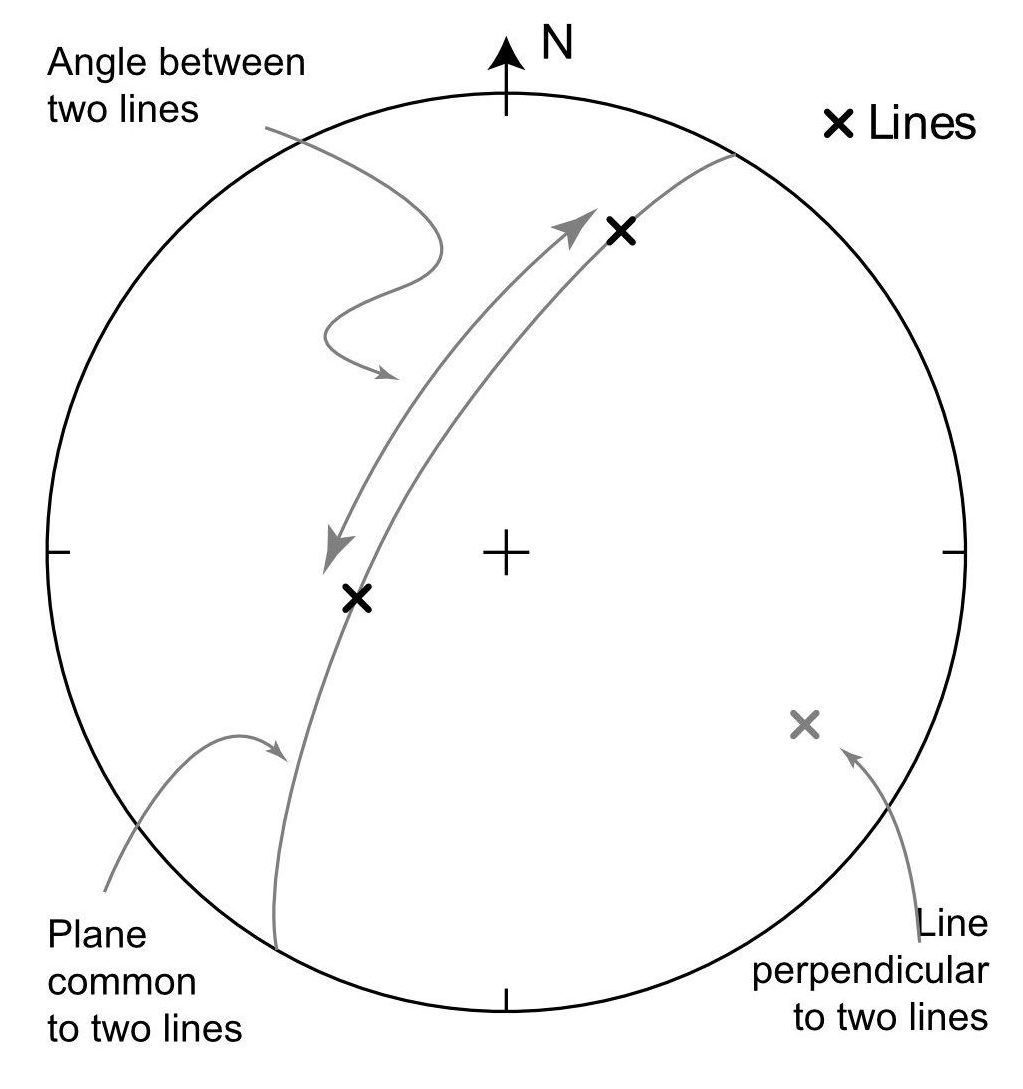
Finding the plane common to two lines
If you have two lines plotted as points on the stereographic projection, the plane common to the two lines plots as a great circle that passes through both points.
a) Plot both lines as points.
b) Rotate the net so that both poles lie on a single great circle.
c) Trace the great circle representing the plane.
Finding the line perpendicular to two other lines
For any two differently oriented lines, there will be a third line that is perpendicular to both of them.
a-c) Repeat steps a-c above.
d) Find the pole to the plane; it represents the perpendicular line.
Angle between two lines
It’s possible to measure the angle between the two lines by counting 2-degree squares along the great circle that passes through both.
a-b) Repeat steps a-b above.
c) Count degrees along the great circle between the two lines.
Note that, unless the lines are at 90°, there will always be two answers: one greater than 90° and one less than 90°.
Example problem: Construct the plane common to the lines 318-34 and 206-78; determine the angle between them; also determine the strike and dip of the common plane.
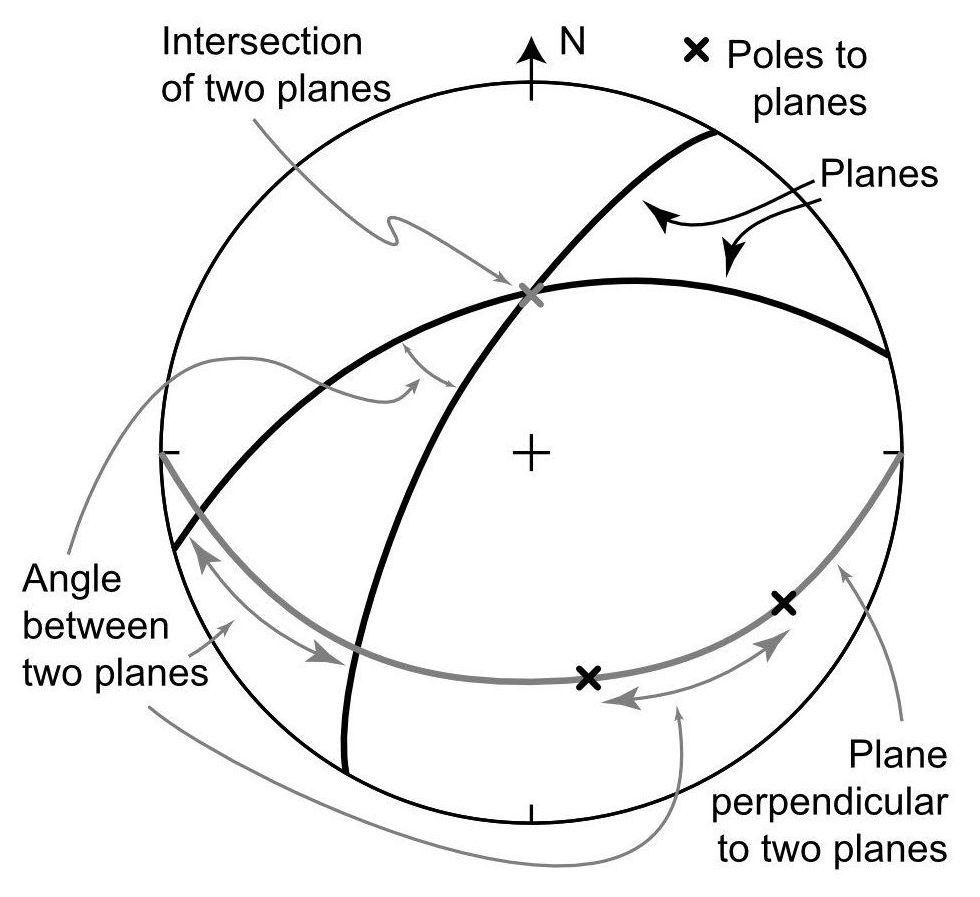
Line of intersection of two planes
The line of intersection of two planes is represented by the point where their great circles cross.
a) Plot the two intersecting planes as great circles on the overlay.
b) The great circles intersect at a point on the overlay, which represents a line of intersection of the two planes. Determine the orientation of the line.
Plane perpendicular to two planes
To find the plane perpendicular to two other planes, we first find their line of intersection, and then use it as the pole to a third plane.
a) Repeat step a above
b) Repeat step b above, but instead of determining the trend and plunge, move the point of intersection to the straight radius on the left side of the net.
c) Count the number of degrees outward from the centre of the net, along the left straight radius to this point.
d) Count the same number of degrees inward from the primitive along the right straight radius, and trace the great circle that passes through this point.
Angle between two planes
There are several methods to find the angle between a pair of planes. It is possible to measure the angle between the two great circles with a protractor, but this is not very accurate. Two methods are recommended. The first method is easier to visualize, but the second method is quicker. Use whichever you prefer.
First method
a-d) Find the great circle perpendicular to the two planes as above.
e) Locate the point where each original plane intersects the new great circle.
f) Count the number of degrees along the new great circle between these points.
Second method
a) Plot both planes as poles.
b) Rotate the net so that both poles lie on a single great circle.
c) Count degrees between the two poles.
Important note: there are always two possible answers to the angle between two planes. The two angles will add up to 180°. The only way to figure out which one is the right answer to a given geological problem is to visualize the problem in 3D!
Example problem: Plot the line of intersection of the planes 132/22 and 074/68. Also plot a third plane perpendicular to both, and find the angle between the two planes. Determine the orientation of the line of intersection of the first two planes. Determine the orientation of the perpendicular plane.
Answers to the example problems
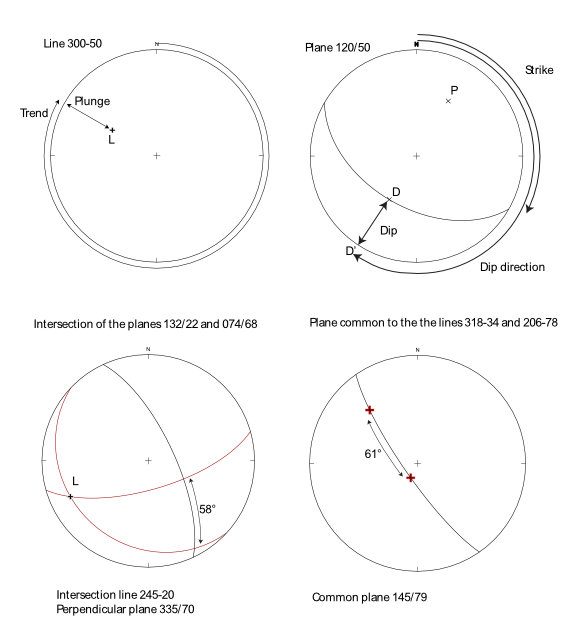
The above plots represent the answers to the following problems:
1) Plot the point L representing the line 300-50. On your projection label the angles corresponding to the trend and plunge.
2) Construct the great circle representing the plane 120/50, and its pole. On the projection label the angles corresponding to the plane’s strike, dip and numerical dip direction.
3) Plot the line of intersection of the planes 132/22 and 074/68. Also plot a third plane perpendicular to both, and find the angle between the two planes. Determine the orientation of the line of intersection of the first two planes. Determine the orientation of the perpendicular plane.
4) Construct the plane common to the lines 318-34 and 206-78; determine the angle between them; also determine the strike and dip of the common plane.
Assignment
1. *Plot and label the position of the following lineations on a stereographic projection:
a) 020-50, b) 295-10, c) 110-80, d) 170-00, e) 210-90.
2. *On a separate sheet of tracing paper plot and label the position of the following inclined planes and their poles:
a) 310/40, b) 025/85, c) 134/04, d) 265/00, e) 130/90.
3. *A slab of rock is set up in the lab. It shows a lineation and a foliation.
(a) Measure the strike and dip of the foliation, and the plunge and trend of the lineation with a compass/clinometer.
(b) Test your accuracy by plotting both on a stereographic projection. First, plot the foliation as a great circle on a stereographic projection. Next, plot the plunge and trend of the lineation as a point. If your lineation lies on the great circle exactly, your measurement is excellent! More likely, it will fall a little off, reflecting the difficulty of measuring with total precision.
c) Measure the rake of the lineation with a protractor. Now plot the rake measurement, as a point that lies exactly on the great circle. Measure the angle between the two measurements of the lineation. This is an indication of the precision of your measurements.
d) Use the result to rate your compass use. (Be honest – this is about assessing your own precision correctly, not the initial measurement!)
Error Rating
<2° Master of the clinometer
2-5° Good
5°-10° Satisfactory
10°-20° Could use more practice
> 20° Probably best to try again
4. Along a vertical railroad cutting, a bed shows an apparent dip of 20° in a direction 298°. On level ground outside the cutting a geologist can measure the strike of the beds as 067, but cannot tell which way they are dipping. Use stereographic projection to determine the true, right-hand-rule strike and dip of the bed.
5. On Ashman Ridge in British Columbia, two geologists measured the distance from the bottom to the top of the Quock Formation as 205 m. The measuring tape had a trend of 187° and a plunge of 20°. If the strike and dip of the Quock Formation was 247/63 N, calculate the true thickness of the formation.
6. The map you worked on last week contains a gold vein cut by an unconformity. Determine the orientation of the subcrop of the vein, by stereographic projection.
(a) Plot the orientation of the gold vein as a great circle. Plot the unconformity as a second great circle. These values (from last week’s lab) will be given to you by your instructors.
(b) Mark the point where the two great circles intersect. This represents the orientation of the subcrop line. Determine the trend and plunge of this line.
(c)* Does it agree with the answer you obtained last week by contouring?
(d) Determine the angle between the vein and the unconformity.
Data from previous lab
Orientation of unconformity: _______________
Orientation of vein:_____________________
Orientation of subcrop line:________________
- You will sometimes see nets which have been labelled with N, S, E and W. We do not recommend this, as the net is rotated, during use, into a variety of orientions that are not N-S. Where necessary, we refer to the cardinal points of the net as 'top', 'left, 'bottom' and 'right'.↵