20.6: Activity 20E - Cryosphere and Climate Change – Sea Ice
- Page ID
- 14878
\( \newcommand{\vecs}[1]{\overset { \scriptstyle \rightharpoonup} {\mathbf{#1}} } \)
\( \newcommand{\vecd}[1]{\overset{-\!-\!\rightharpoonup}{\vphantom{a}\smash {#1}}} \)
\( \newcommand{\id}{\mathrm{id}}\) \( \newcommand{\Span}{\mathrm{span}}\)
( \newcommand{\kernel}{\mathrm{null}\,}\) \( \newcommand{\range}{\mathrm{range}\,}\)
\( \newcommand{\RealPart}{\mathrm{Re}}\) \( \newcommand{\ImaginaryPart}{\mathrm{Im}}\)
\( \newcommand{\Argument}{\mathrm{Arg}}\) \( \newcommand{\norm}[1]{\| #1 \|}\)
\( \newcommand{\inner}[2]{\langle #1, #2 \rangle}\)
\( \newcommand{\Span}{\mathrm{span}}\)
\( \newcommand{\id}{\mathrm{id}}\)
\( \newcommand{\Span}{\mathrm{span}}\)
\( \newcommand{\kernel}{\mathrm{null}\,}\)
\( \newcommand{\range}{\mathrm{range}\,}\)
\( \newcommand{\RealPart}{\mathrm{Re}}\)
\( \newcommand{\ImaginaryPart}{\mathrm{Im}}\)
\( \newcommand{\Argument}{\mathrm{Arg}}\)
\( \newcommand{\norm}[1]{\| #1 \|}\)
\( \newcommand{\inner}[2]{\langle #1, #2 \rangle}\)
\( \newcommand{\Span}{\mathrm{span}}\) \( \newcommand{\AA}{\unicode[.8,0]{x212B}}\)
\( \newcommand{\vectorA}[1]{\vec{#1}} % arrow\)
\( \newcommand{\vectorAt}[1]{\vec{\text{#1}}} % arrow\)
\( \newcommand{\vectorB}[1]{\overset { \scriptstyle \rightharpoonup} {\mathbf{#1}} } \)
\( \newcommand{\vectorC}[1]{\textbf{#1}} \)
\( \newcommand{\vectorD}[1]{\overrightarrow{#1}} \)
\( \newcommand{\vectorDt}[1]{\overrightarrow{\text{#1}}} \)
\( \newcommand{\vectE}[1]{\overset{-\!-\!\rightharpoonup}{\vphantom{a}\smash{\mathbf {#1}}}} \)
\( \newcommand{\vecs}[1]{\overset { \scriptstyle \rightharpoonup} {\mathbf{#1}} } \)
\( \newcommand{\vecd}[1]{\overset{-\!-\!\rightharpoonup}{\vphantom{a}\smash {#1}}} \)
\(\newcommand{\avec}{\mathbf a}\) \(\newcommand{\bvec}{\mathbf b}\) \(\newcommand{\cvec}{\mathbf c}\) \(\newcommand{\dvec}{\mathbf d}\) \(\newcommand{\dtil}{\widetilde{\mathbf d}}\) \(\newcommand{\evec}{\mathbf e}\) \(\newcommand{\fvec}{\mathbf f}\) \(\newcommand{\nvec}{\mathbf n}\) \(\newcommand{\pvec}{\mathbf p}\) \(\newcommand{\qvec}{\mathbf q}\) \(\newcommand{\svec}{\mathbf s}\) \(\newcommand{\tvec}{\mathbf t}\) \(\newcommand{\uvec}{\mathbf u}\) \(\newcommand{\vvec}{\mathbf v}\) \(\newcommand{\wvec}{\mathbf w}\) \(\newcommand{\xvec}{\mathbf x}\) \(\newcommand{\yvec}{\mathbf y}\) \(\newcommand{\zvec}{\mathbf z}\) \(\newcommand{\rvec}{\mathbf r}\) \(\newcommand{\mvec}{\mathbf m}\) \(\newcommand{\zerovec}{\mathbf 0}\) \(\newcommand{\onevec}{\mathbf 1}\) \(\newcommand{\real}{\mathbb R}\) \(\newcommand{\twovec}[2]{\left[\begin{array}{r}#1 \\ #2 \end{array}\right]}\) \(\newcommand{\ctwovec}[2]{\left[\begin{array}{c}#1 \\ #2 \end{array}\right]}\) \(\newcommand{\threevec}[3]{\left[\begin{array}{r}#1 \\ #2 \\ #3 \end{array}\right]}\) \(\newcommand{\cthreevec}[3]{\left[\begin{array}{c}#1 \\ #2 \\ #3 \end{array}\right]}\) \(\newcommand{\fourvec}[4]{\left[\begin{array}{r}#1 \\ #2 \\ #3 \\ #4 \end{array}\right]}\) \(\newcommand{\cfourvec}[4]{\left[\begin{array}{c}#1 \\ #2 \\ #3 \\ #4 \end{array}\right]}\) \(\newcommand{\fivevec}[5]{\left[\begin{array}{r}#1 \\ #2 \\ #3 \\ #4 \\ #5 \\ \end{array}\right]}\) \(\newcommand{\cfivevec}[5]{\left[\begin{array}{c}#1 \\ #2 \\ #3 \\ #4 \\ #5 \\ \end{array}\right]}\) \(\newcommand{\mattwo}[4]{\left[\begin{array}{rr}#1 \amp #2 \\ #3 \amp #4 \\ \end{array}\right]}\) \(\newcommand{\laspan}[1]{\text{Span}\{#1\}}\) \(\newcommand{\bcal}{\cal B}\) \(\newcommand{\ccal}{\cal C}\) \(\newcommand{\scal}{\cal S}\) \(\newcommand{\wcal}{\cal W}\) \(\newcommand{\ecal}{\cal E}\) \(\newcommand{\coords}[2]{\left\{#1\right\}_{#2}}\) \(\newcommand{\gray}[1]{\color{gray}{#1}}\) \(\newcommand{\lgray}[1]{\color{lightgray}{#1}}\) \(\newcommand{\rank}{\operatorname{rank}}\) \(\newcommand{\row}{\text{Row}}\) \(\newcommand{\col}{\text{Col}}\) \(\renewcommand{\row}{\text{Row}}\) \(\newcommand{\nul}{\text{Nul}}\) \(\newcommand{\var}{\text{Var}}\) \(\newcommand{\corr}{\text{corr}}\) \(\newcommand{\len}[1]{\left|#1\right|}\) \(\newcommand{\bbar}{\overline{\bvec}}\) \(\newcommand{\bhat}{\widehat{\bvec}}\) \(\newcommand{\bperp}{\bvec^\perp}\) \(\newcommand{\xhat}{\widehat{\xvec}}\) \(\newcommand{\vhat}{\widehat{\vvec}}\) \(\newcommand{\uhat}{\widehat{\uvec}}\) \(\newcommand{\what}{\widehat{\wvec}}\) \(\newcommand{\Sighat}{\widehat{\Sigma}}\) \(\newcommand{\lt}{<}\) \(\newcommand{\gt}{>}\) \(\newcommand{\amp}{&}\) \(\definecolor{fillinmathshade}{gray}{0.9}\)Scientists at the National Snow and Ice Data Center (NSIDC) have measured the extent of Arctic and Antarctic sea ice every month since at least 1978 using satellite data. A data table (Table 20.1) from NSIDC for September in the Arctic and February in the Antarctic is provided below. For the following questions, use Table 20.1 and the interactive sea ice viewer from NSIDC.
Arctic Sea Ice
- What was the average extent of Arctic sea ice in September from 2005 to 2020 in millions of km2? Give your answer to the nearest hundredth.
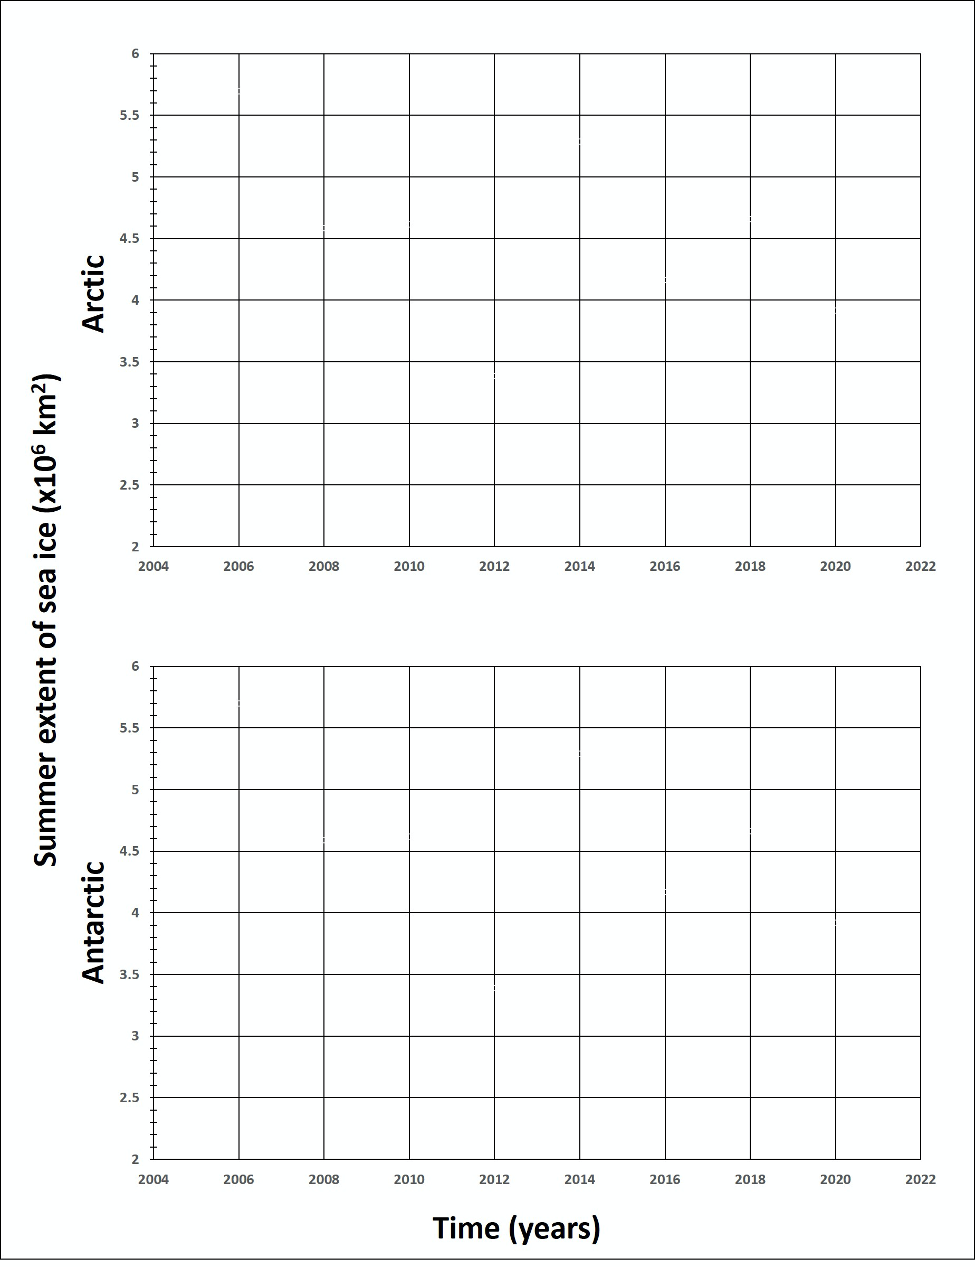
- Plot all of the data for the extent of Arctic sea ice from 2005 to 2020 on the graph labeled “Arctic”. Then, draw a straight line (a best-fit line) through the points so that the number of points above the line is about the same as the number below the line.
- Based on your plot and calculations in the previous two questions, would you say the amount of Arctic sea ice as measured in September of each year is decreasing, increasing, or staying about the same?
- What do you predict the extent of Arctic sea ice will be in 2030?
Antarctic Sea Ice
- What was the average extent of Antarctic sea ice in September from 2005 to 2020 in millions of km2? Give your answer to the nearest hundredth.
- Plot all of the data for the extent of Antarctic sea ice from 2005 to 2020 on the graph labeled “Antarctic”. Then, draw a best-fit line through the points.
- What do you predict the extent of Antarctic sea ice will be in 2030?
- Based on your responses to the last few questions, would you say that the annual amount of Antarctic sea ice as measured in February of each year is decreasing, increasing, or staying about the same?
- How do the changes in Arctic sea ice extent over time compare with the Antarctic changes? If they are different, why do you think that might be?
Table 20.1: Use this table for Activity 20E: Sea Ice and Climate Change.
| Summer Extent of Sea Ice 2005-2020 | ||
|---|---|---|
| Year | September in Arctic, in millions of square km | February in Antarctic, in million of square km |
| 2020 | 3.92 | 2.71 |
| 2019 | 4.19 | 2.46 |
| 2018 | 4.66 | 2.28 |
| 2017 | 4.67 | 2.15 |
| 2016 | 4.17 | 2.74 |
| 2015 | 4.43 | 3.65 |
| 2014 | 5.29 | 3.90 |
| 2013 | 5.05 | 3.80 |
| 2012 | 3.39 | 3.24 |
| 2011 | 4.34 | 2.34 |
| 2010 | 4.62 | 3.11 |
| 2009 | 5.12 | 2.90 |
| 2008 | 4.59 | 3.95 |
| 2007 | 4.16 | 2.92 |
| 2006 | 5.7 | 2.60 |
| 2005 | 5.32 | 2.96 |

Drawing conclusions about any complex system, such as climate and how it is changing, is difficult. Completely accurate data can be misrepresented and taken out of context (e.g. examining sea ice extent without understanding ocean currents), which may lead someone to an incorrect conclusion. It is important to base any conclusion on rational, accurate, complete, and in-context data, rather than data that has been poorly collected or misrepresented. Most importantly, you should come to your own well-informed conclusions regarding data, rather than be swayed by the opinion of the author presenting the data; this is true both in science and in many other aspects of your life.
- Do you think any conclusions regarding climate change should be made based on the data presented in this assignment/lab?
- What data do you think are needed to make a conclusion regarding climate change?
Attributions
- Table 20.1: “Summer Extent of Sea Ice 2005-2020” (CC-BY 4.0; Chloe Branciforte, own work, data via NSIDC)
- Chart 20.1: “Summer Extent of Sea Ice” (CC-BY 4.0; Chloe Branciforte, own work)


