
15.1: Front Matter
- Page ID
- 14574

\( \newcommand{\vecs}[1]{\overset { \scriptstyle \rightharpoonup} {\mathbf{#1}} } \)
\( \newcommand{\vecd}[1]{\overset{-\!-\!\rightharpoonup}{\vphantom{a}\smash {#1}}} \)
\( \newcommand{\id}{\mathrm{id}}\) \( \newcommand{\Span}{\mathrm{span}}\)
( \newcommand{\kernel}{\mathrm{null}\,}\) \( \newcommand{\range}{\mathrm{range}\,}\)
\( \newcommand{\RealPart}{\mathrm{Re}}\) \( \newcommand{\ImaginaryPart}{\mathrm{Im}}\)
\( \newcommand{\Argument}{\mathrm{Arg}}\) \( \newcommand{\norm}[1]{\| #1 \|}\)
\( \newcommand{\inner}[2]{\langle #1, #2 \rangle}\)
\( \newcommand{\Span}{\mathrm{span}}\)
\( \newcommand{\id}{\mathrm{id}}\)
\( \newcommand{\Span}{\mathrm{span}}\)
\( \newcommand{\kernel}{\mathrm{null}\,}\)
\( \newcommand{\range}{\mathrm{range}\,}\)
\( \newcommand{\RealPart}{\mathrm{Re}}\)
\( \newcommand{\ImaginaryPart}{\mathrm{Im}}\)
\( \newcommand{\Argument}{\mathrm{Arg}}\)
\( \newcommand{\norm}[1]{\| #1 \|}\)
\( \newcommand{\inner}[2]{\langle #1, #2 \rangle}\)
\( \newcommand{\Span}{\mathrm{span}}\) \( \newcommand{\AA}{\unicode[.8,0]{x212B}}\)
\( \newcommand{\vectorA}[1]{\vec{#1}} % arrow\)
\( \newcommand{\vectorAt}[1]{\vec{\text{#1}}} % arrow\)
\( \newcommand{\vectorB}[1]{\overset { \scriptstyle \rightharpoonup} {\mathbf{#1}} } \)
\( \newcommand{\vectorC}[1]{\textbf{#1}} \)
\( \newcommand{\vectorD}[1]{\overrightarrow{#1}} \)
\( \newcommand{\vectorDt}[1]{\overrightarrow{\text{#1}}} \)
\( \newcommand{\vectE}[1]{\overset{-\!-\!\rightharpoonup}{\vphantom{a}\smash{\mathbf {#1}}}} \)
\( \newcommand{\vecs}[1]{\overset { \scriptstyle \rightharpoonup} {\mathbf{#1}} } \)
\( \newcommand{\vecd}[1]{\overset{-\!-\!\rightharpoonup}{\vphantom{a}\smash {#1}}} \)
\(\newcommand{\avec}{\mathbf a}\) \(\newcommand{\bvec}{\mathbf b}\) \(\newcommand{\cvec}{\mathbf c}\) \(\newcommand{\dvec}{\mathbf d}\) \(\newcommand{\dtil}{\widetilde{\mathbf d}}\) \(\newcommand{\evec}{\mathbf e}\) \(\newcommand{\fvec}{\mathbf f}\) \(\newcommand{\nvec}{\mathbf n}\) \(\newcommand{\pvec}{\mathbf p}\) \(\newcommand{\qvec}{\mathbf q}\) \(\newcommand{\svec}{\mathbf s}\) \(\newcommand{\tvec}{\mathbf t}\) \(\newcommand{\uvec}{\mathbf u}\) \(\newcommand{\vvec}{\mathbf v}\) \(\newcommand{\wvec}{\mathbf w}\) \(\newcommand{\xvec}{\mathbf x}\) \(\newcommand{\yvec}{\mathbf y}\) \(\newcommand{\zvec}{\mathbf z}\) \(\newcommand{\rvec}{\mathbf r}\) \(\newcommand{\mvec}{\mathbf m}\) \(\newcommand{\zerovec}{\mathbf 0}\) \(\newcommand{\onevec}{\mathbf 1}\) \(\newcommand{\real}{\mathbb R}\) \(\newcommand{\twovec}[2]{\left[\begin{array}{r}#1 \\ #2 \end{array}\right]}\) \(\newcommand{\ctwovec}[2]{\left[\begin{array}{c}#1 \\ #2 \end{array}\right]}\) \(\newcommand{\threevec}[3]{\left[\begin{array}{r}#1 \\ #2 \\ #3 \end{array}\right]}\) \(\newcommand{\cthreevec}[3]{\left[\begin{array}{c}#1 \\ #2 \\ #3 \end{array}\right]}\) \(\newcommand{\fourvec}[4]{\left[\begin{array}{r}#1 \\ #2 \\ #3 \\ #4 \end{array}\right]}\) \(\newcommand{\cfourvec}[4]{\left[\begin{array}{c}#1 \\ #2 \\ #3 \\ #4 \end{array}\right]}\) \(\newcommand{\fivevec}[5]{\left[\begin{array}{r}#1 \\ #2 \\ #3 \\ #4 \\ #5 \\ \end{array}\right]}\) \(\newcommand{\cfivevec}[5]{\left[\begin{array}{c}#1 \\ #2 \\ #3 \\ #4 \\ #5 \\ \end{array}\right]}\) \(\newcommand{\mattwo}[4]{\left[\begin{array}{rr}#1 \amp #2 \\ #3 \amp #4 \\ \end{array}\right]}\) \(\newcommand{\laspan}[1]{\text{Span}\{#1\}}\) \(\newcommand{\bcal}{\cal B}\) \(\newcommand{\ccal}{\cal C}\) \(\newcommand{\scal}{\cal S}\) \(\newcommand{\wcal}{\cal W}\) \(\newcommand{\ecal}{\cal E}\) \(\newcommand{\coords}[2]{\left\{#1\right\}_{#2}}\) \(\newcommand{\gray}[1]{\color{gray}{#1}}\) \(\newcommand{\lgray}[1]{\color{lightgray}{#1}}\) \(\newcommand{\rank}{\operatorname{rank}}\) \(\newcommand{\row}{\text{Row}}\) \(\newcommand{\col}{\text{Col}}\) \(\renewcommand{\row}{\text{Row}}\) \(\newcommand{\nul}{\text{Nul}}\) \(\newcommand{\var}{\text{Var}}\) \(\newcommand{\corr}{\text{corr}}\) \(\newcommand{\len}[1]{\left|#1\right|}\) \(\newcommand{\bbar}{\overline{\bvec}}\) \(\newcommand{\bhat}{\widehat{\bvec}}\) \(\newcommand{\bperp}{\bvec^\perp}\) \(\newcommand{\xhat}{\widehat{\xvec}}\) \(\newcommand{\vhat}{\widehat{\vvec}}\) \(\newcommand{\uhat}{\widehat{\uvec}}\) \(\newcommand{\what}{\widehat{\wvec}}\) \(\newcommand{\Sighat}{\widehat{\Sigma}}\) \(\newcommand{\lt}{<}\) \(\newcommand{\gt}{>}\) \(\newcommand{\amp}{&}\) \(\definecolor{fillinmathshade}{gray}{0.9}\)What Is Crustal Deformation?
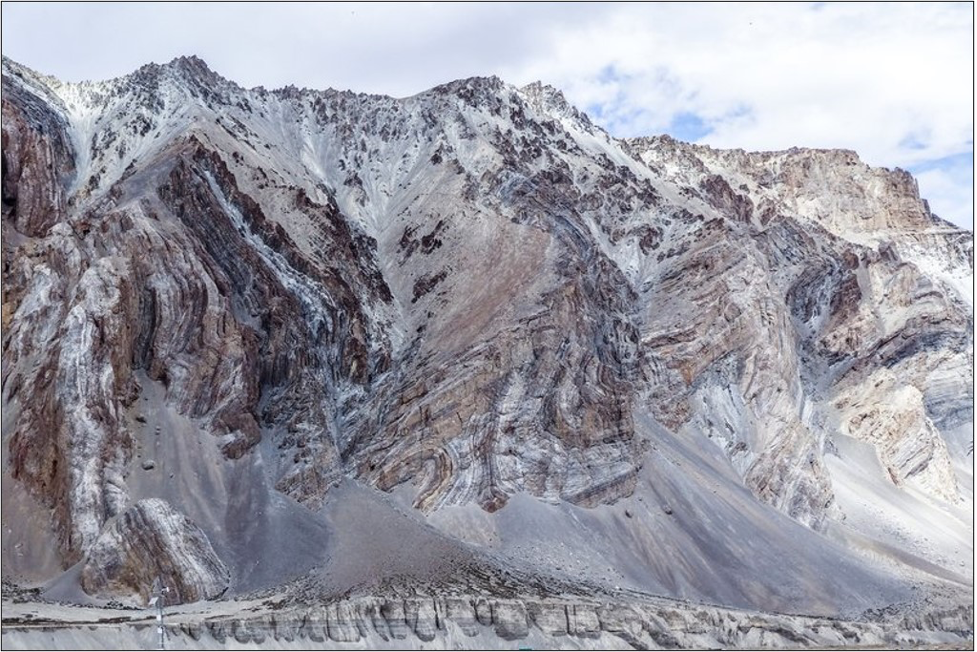
The Earth is an active planet shaped by dynamic forces. Such forces can build mountains or crumple and break rocks. As rocks respond to these forces (stress), they undergo deformation, which results in changes in shape, placement, and/or volume of the rocks. The resulting features (folds and faults) are termed geologic structures. Deformation can produce dramatic and beautiful scenery, as evidenced in Figure 15.1, which shows the deformation of originally flat (horizontal) rock layers.
A person who studies crustal deformation is referred to as a structural geologist. A structural geologist is a geoscientist that studies the bends and breaks of rocks and the conditions under which they form. Like many other geoscientists, working with other disciplines is common, with a heavy influence from both math and technology. Many are employed by universities where they teach and/or do research. Other employers consist of museums, state and federal geological surveys, and exploration and mining companies. Becoming a structural geologist requires a college degree and typically postgraduate work. If this is of interest to you, talk to your geology instructor for advice. We recommend completing as many math and science courses as possible. Also, visit National Parks, CA State Parks, museums, gem & mineral shows, or join a local rock and mineral club. Typically, natural history museums will have wonderful displays of rocks, including those from your local region. Here in California, there are a number of large rock collections, including the San Diego Natural History Museum, Natural History Museum of Los Angeles County, Santa Barbara Museum of Natural History, and Kimball Natural History Museum. Many colleges and universities also have their own collections/museums.
What Is Stress and Strain?
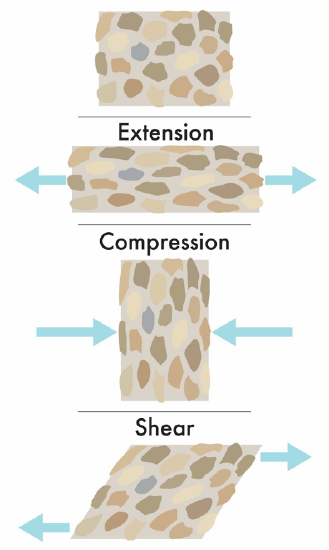
Rocks change as they undergo stress, which is just a force applied to a given area. Since stress is a function of area, changing the area to which stress is applied makes a difference. For example, imagine a single steel nail and a bed made entirely of those same nails. If someone were to lay down on a single nail, the stress becomes concentrated at the point, and they would surely hurt themselves. However, lay down on the bed of nails, and the stress becomes distributed and spread out producing a much safer outcome. In geology, there are three main types of stress (Figure 15.2 and Table 15.1):
- Compressional forces operate when rocks are pushed together. Typically, rocks can withstand compressional stress better than tensional stress.
- Tensional (extensional) forces operate when rocks pull away from each other.
- Shear forces are created when rocks move horizontally past each other in opposite directions.
In response to these stresses, rocks may undergo three different types of strain:
- Elastic strain is reversible. Rock that has undergone only elastic strain will go back to its original shape if the stress is released.
- Ductile strain (or plastic deformation) is irreversible. A rock that has undergone ductile strain will remain deformed even if the stress stops. Rocks that undergo ductile deformation typically result in folding.
- Fracture (or brittle deformation) is also irreversible. A rock that has fractured or ruptured has abruptly broken into distinct pieces. If the pieces are offset, shifted in opposite directions from each other, the fracture is referred to as a fault.
| Type of Stress | Crustal Response | Geologic Structures | Associated Plate Boundary |
|---|---|---|---|
| Compression | Shortening & thickening |
Reverse faults Folding |
Convergent |
| Tension (extension) | Elongation (stretching) & thinning | Normal faults | Divergent |
| Shear | Tearing | Strike-slip faults | Transform |
The resulting deformation depends on many factors, including the type of stress, the type of rock, the depth of the rock (pressure and temperature), and the length of time the rock endures the stress. Rocks behave very differently at depth than at the surface. Generally, rocks at depth deform in a more plastic manner (folds), and in a more brittle manner near the Earth’s surface (faults).
The Importance of Block Diagrams and Perspective
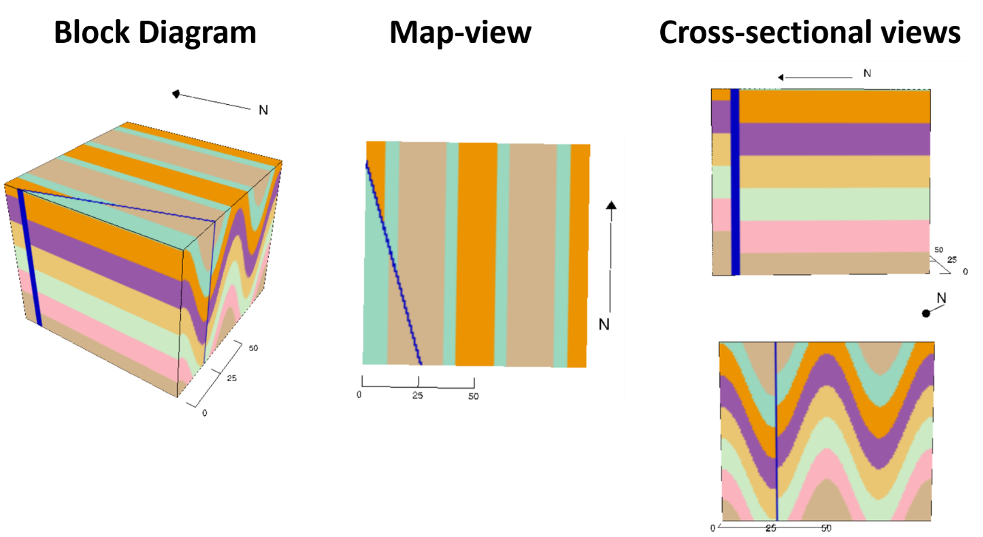
To learn many of the concepts associated with structural geology, it is useful to consider the geological perspective (Figure 15.3). Typically, geologists will use block diagrams to depict structures of the Earth. Note the different ways that you can view a block diagram. If you look at a block from along the side, you are seeing the cross-section (or profile) view. If you look at the block from directly above it, you are looking at a map-view.
As you examine the rocks and consider how they have changed, it is useful to remember how they were deposited in the first place. Take some time to review the Geologic Principles, especially the Principle of Original Horizontality and Principle of Superposition.
How Do Geologists Measure Geologic Structures?
Each of the boundaries between rock units represents a geologic contact, which is simply the surface between two different rock units. Rock layers are often at an angle, not horizontal, indicating that changes have occurred since deposition. In order to measure and describe layers, geologists apply the concepts of strike and dip.
Strike & Dip
Strike refers to the line formed by the intersection of a horizontal plane and an inclined surface. To determine strike, find where the dipping layer intersects the horizontal surface and draw a line parallel to this line of intersection on the top of the block (i.e. our horizontal surface). In Figure 15.4, look at the tilted sedimentary layers. Strike is the line on the horizontal plane created when the dipping green layer intersects the Earth’s surface. To better display the horizontal surface, it has been represented by water.
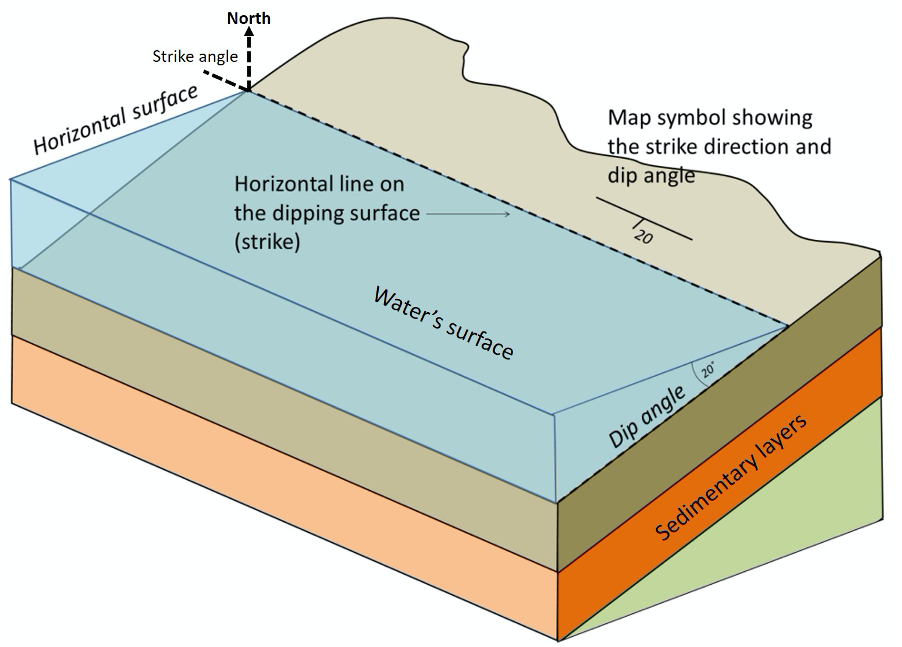
Dip is the angle between that horizontal plane and the tilted surface (Figure 15.4). To determine dip, pretend that there is a drop of water between one bed and the next (for example, along the intersection of the green bed and the orange bed). In which direction would the water roll if it followed that contact? That is the direction of dip, towards the left in this case.
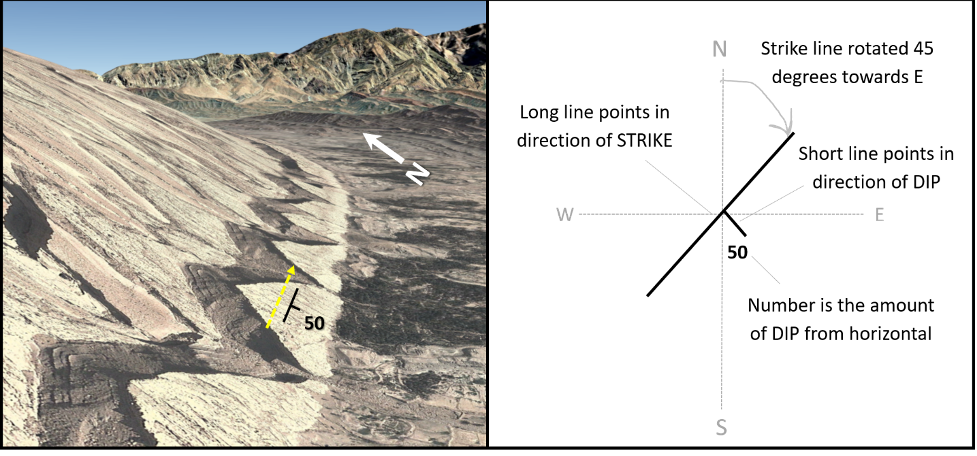
The symbol for strike and dip is illustrated in greater detail on Figure 15.5. Note that the dip symbol (shorter line) is perpendicular to the strike symbol; dip degree (number) will vary depending on measurements. You will work more with measuring strike and dip in the next chapter.
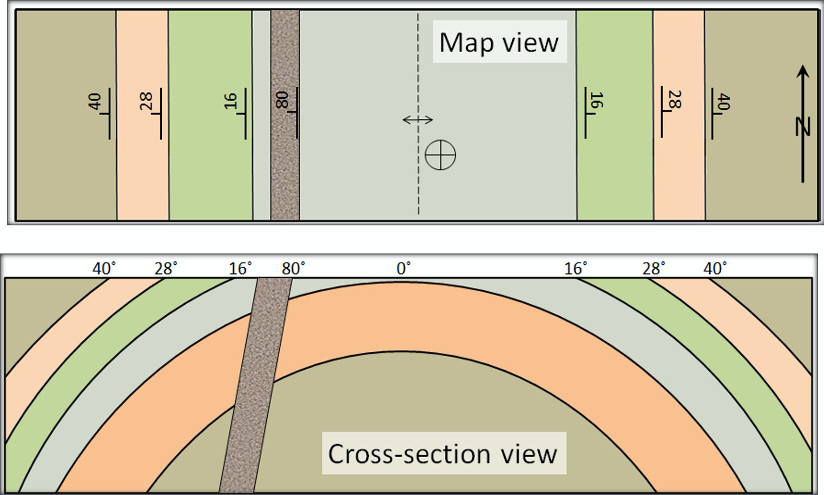
When using strike and dip, it is important to remember that with these symbols a geologist can interpret and draw a cross-sectional view from a map-view. Examine Figure 15.6, do you notice any patterns between the map and cross-sectional views? Locate the two peach-colored layers in map view and their associated strike and dip symbols. Notice the dips point away from each other. Now, trace a peach-colored layer down to the cross-sectional view; the layers are no longer straight. Instead the layers actually dip away from each other and there is a distinct rainbow pattern. With a protractor measure the angle of dip for the peach-colored layer. You are measuring how many degrees off the horizontal that layer is. In this case the peach-colored layer is 28° off the horizontal, and is what the number associated with the strike and dip symbol signifies. Consider a swiss or jelly roll cake. The cake begins as flat, horizontal layers of cake and filling. Those layers are then deformed by the baker rolling and filling the cake. The final cake has a distinct rolled shape, which when cut to be served will reveal the curved layers inside.
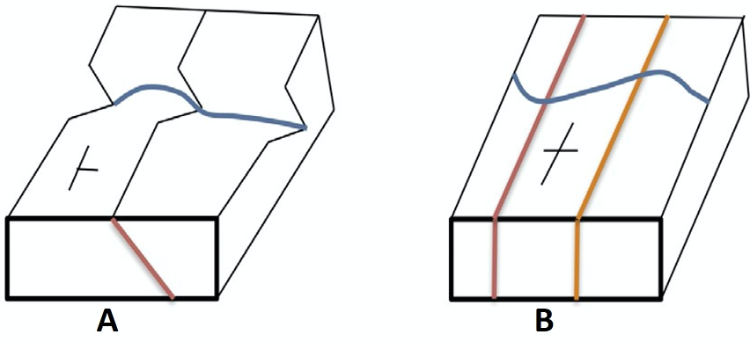
Useful in map interpretation is the application of the Rule of V’s to determine dip direction. Recall that due to erosion, sharp-pointed V’s are usually in stream valleys, with the stream channel passing through the point of the V, and the V pointing upstream. As a result, when a stream crosses tilted strata, it will cut a V-shape into the rock layers. The point of the V is in the direction of dip. In vertical strata, no V-shapes are made (Figure 15.7).
Geologic Structures: Folds
Folds are geologic structures created by ductile (plastic) deformation of the Earth’s crust. To understand how folds are generated, take a piece of paper and hold it up with a hand on each end. Apply compressional forces (push the ends towards each other). You have just created a fold (bent rock layers). Depending on how your paper moved, you created one of the main fold types!
Simple Folds
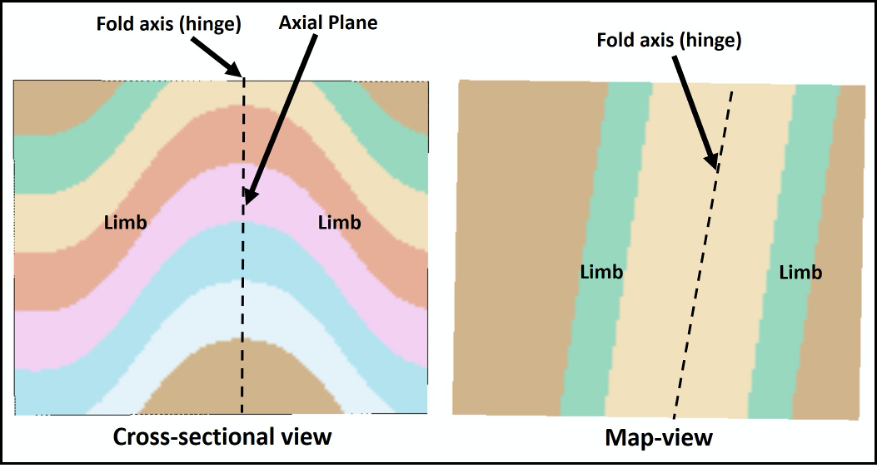
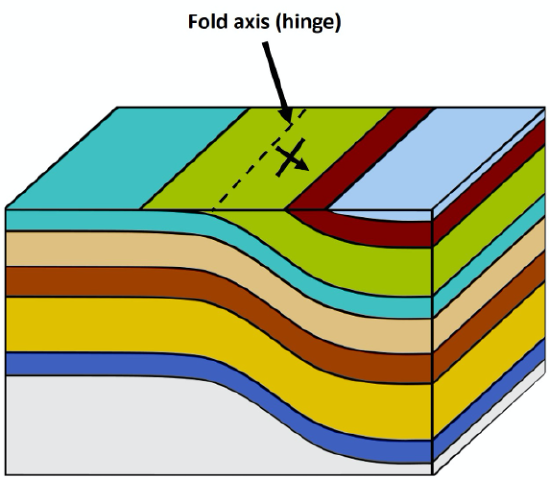
Simple folds have distinct regions or anatomy. For example, a plane can be drawn through the fold axis (or hinge) of a fold and is called the axial plane of the fold. The sloping beds on either side of an axial plane are limbs (Figure 15.8). An anticline or syncline is described as symmetrical if the angles between each of limbs and the axial plane are generally similar, and asymmetrical if they are not.
Anticlines
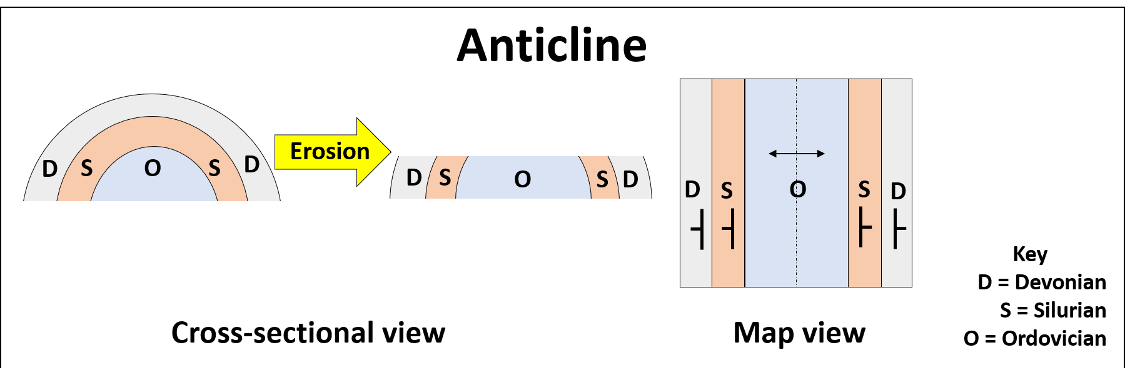
An anticline has layers which dip away from the hinge of the fold, and in cross-section resembles a capital letter A, rainbow, or arch (Table 15.2). In addition to the distinct cross-sectional shape, rocks along the hinge tend to be older, particularly after erosion. This can be determined by using the Principle of Superposition. Examine Figure 15.9. Mentally flatten the cross-section, so that layers O, S and D are flat and horizontal again. Where does layer O go? It is located at the bottom, which according to superposition, means it is the older layer. In this instance we also have geologic ages (Devonian, Silurian, and Ordovician), but these periods are only helpful if we know their order or can look up a geologic time scale.
Synclines
A syncline has layers which dip towards the hinge of the fold, and in cross-section represents a capital letter U, smile, or sink (Table 15.2). In addition to the distinct cross-sectional shape, rocks along the hinge tend to be younger, even after erosion (Figure 15.10). Much like above, this can again be determined by using the Principle of Superposition.
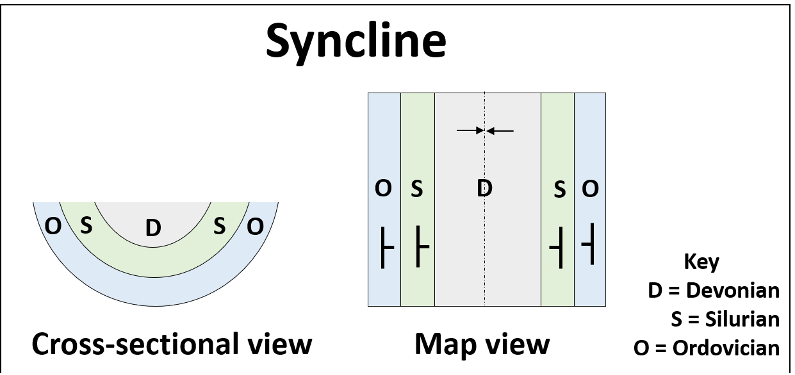
It is important to note that anticlines do not always represent mountains or high areas and synclines do not always represent basins or low areas. They are simply folded rock layers, and do not necessarily indicate topographic high and low points. Notice in both simple folds, the cross-section looks much different from the map view. In map view, rather than seeing folds, you encounter beds that, after erosion, will be organized as a parallel striped pattern (Figures 15.9, right and 15.10, right). To help determine the simple fold type, it will be helpful to interpret the strike and dip of the beds, age of the rock along the hinge, or any general symbology present.
| Simple Folds | Cross-sectional shape | Direction of dip of layers | Age of beds along axis or center |
|---|---|---|---|
| Anticline | A-shape or rainbow | Away from axis | Older |
| Syncline | U or V-shape or smile | Towards the axis | Younger |
Plunging Folds
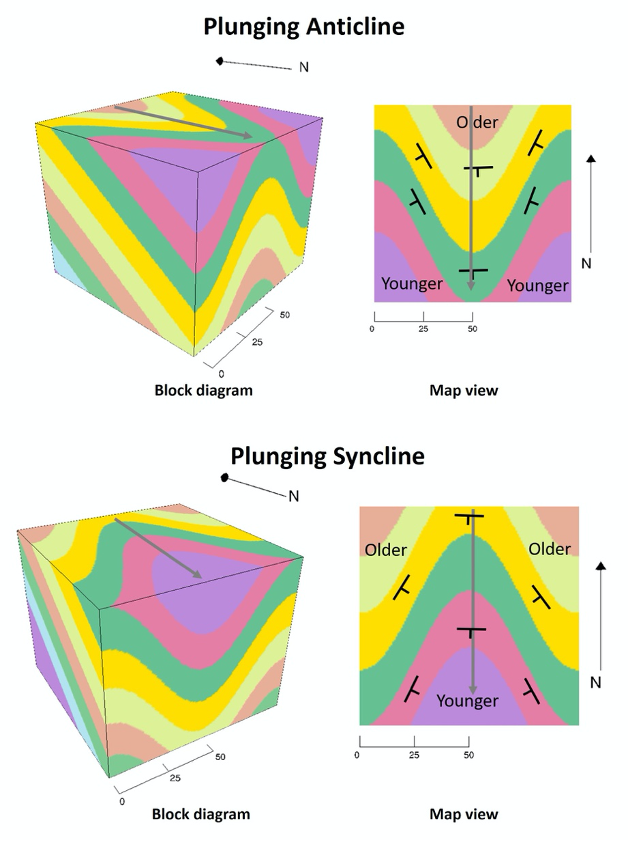
A plunging fold, which is essentially a tilted fold that creates a V-shaped pattern on the surface (Figure 15.11). In a plunging anticline, the oldest strata can be found at the center of the V, and the V points in the direction of the plunge of the fold axis. In a plunging syncline, the youngest strata are found at the center of the V, and the V points in the opposite direction of the plunge of the fold axis.
Monoclines
A monocline is a simple fold structure, with only one limb folded, and the other remains horizontal. This is similar to the shape of a carpet draped over a stair step (Figure 15.12).
Complex Folds
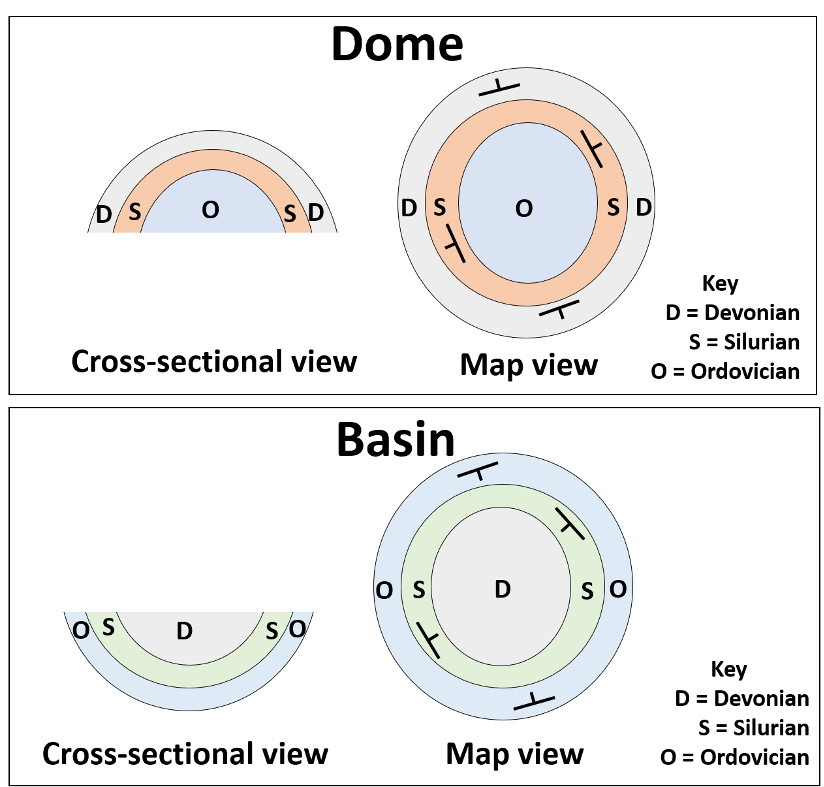
The complex folds include domes and basins, which are basically the circular (or elliptical) equivalent of the simple folds. Both domes and basins can be recognized by their bulls-eye patterned map-view (Figure 15.13 and Table 15.3).
A dome has a cross-section similar to an anticline. In a dome, the oldest rocks are exposed at the center, and rocks dip away from this central point. A basin has a cross-section, like a syncline. In a basin, the youngest rocks are in the center, and the rocks dip inward towards the center.
| Complex Folds | Cross-sectional shape | Direction of dip of layers | Age of beds along axis or center |
|---|---|---|---|
| Dome | A-shape or rainbow (all sides) | Away from center | Older |
| Basin | U or V-shape or smile (all sides) | Towards the center | Younger |
Geologic Structures: Faults
As rocks undergo brittle deformation, they may produce cracks in the rocks. If no appreciable displacement has occurred along these cracks, they are called joints. If appreciable displacement does occur, they are referred to as faults.
Dip-Slip Faults
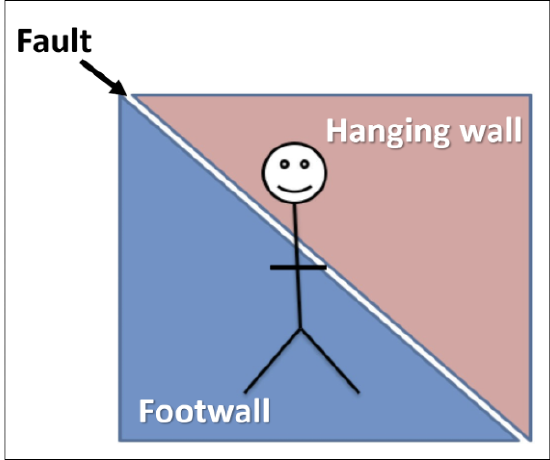
We will first examine dip-slip faults, in which movement along the fault is vertical, either up or down. The two masses of rock that are cut by a fault are termed the fault blocks. The type of fault is determined by the direction that the fault blocks have moved. Fault block movement is described based on the movement of the hanging wall: the fault block located above the fault plane (Figure 15.14). The other fault block, located beneath the fault plane, is called the foot wall (Figure 15.14). These terms come from the idea that if a miner were climbing along the fault plane, they would hang their lantern above their head, along the hanging wall. Alternately, you can draw a stick figure straight up and down across the fault plane. Its head will be on the hanging wall and its feet will be on the foot wall.
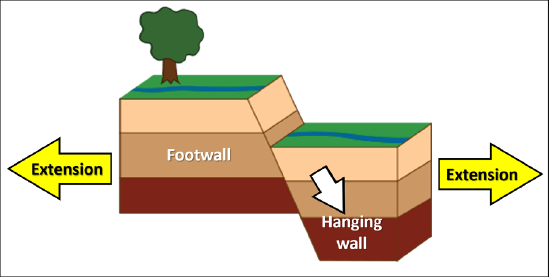
When extensional stresses are applied to the fault blocks, the hanging wall will move down, creating what is called a normal fault. An easy way to remember this is the phrase “It’s normal to fall down”. Extensional stresses cause the crust to become stretched (elongated) and thinned out (Figure 15.15 and Table 15.4). These faults are common, but not exclusive to, rifts and divergent boundaries. Check out this USGS normal fault video to visualize the motion further.
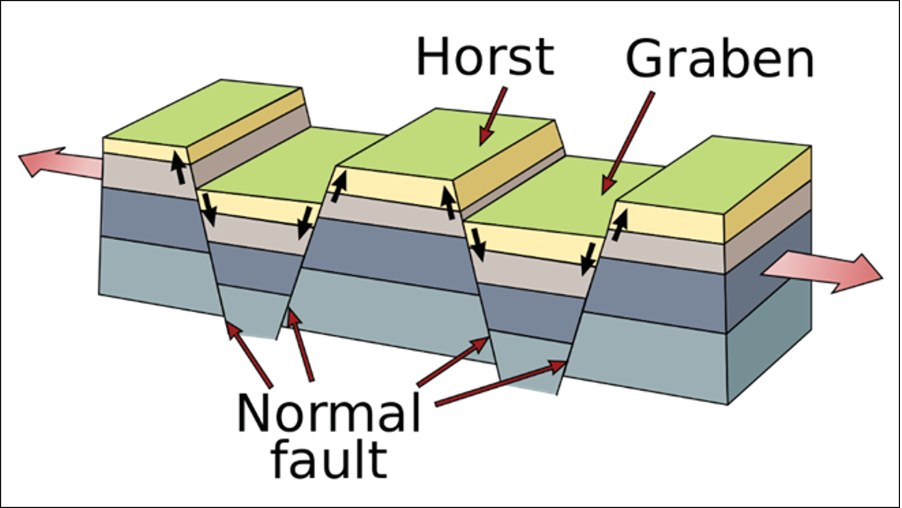
Tensional forces acting over a region can produce normal faults that result in landforms known as horst and grabens. The graben is the crustal block that down drops, and is surrounded by two horsts, the relatively uplifted crustal blocks (Figure 15.16). This terrain is typical of the Basin and Range of the western United States. Check out this USGS horst and graben video to visualize the motion further.
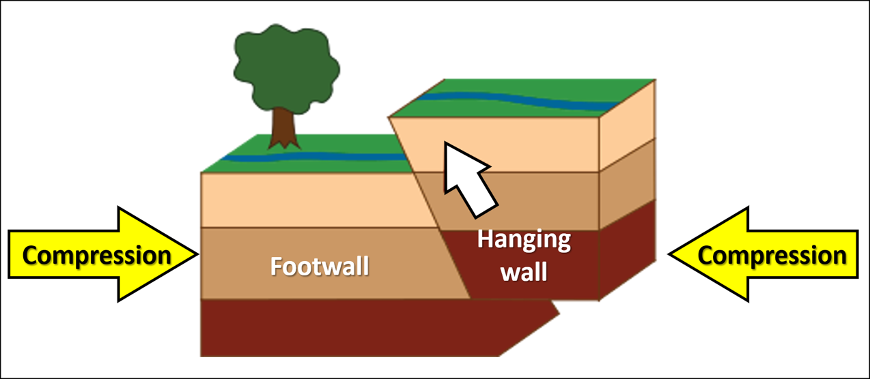
When compressional forces are applied to the fault blocks, the hanging wall will move up, creating a reverse fault (Figure 15.17 and Table 15.4). This causes the crust to shorten in the area. A special type of reverse fault is a thrust fault, a low angle reverse fault (dip angle of less than 45°) that has a much thinner hanging wall. Check out this USGS thrust fault video to visualize the motion of a reverse fault further. These faults are common at, but not exclusive to, convergent boundaries.
Strike-Slip Faults
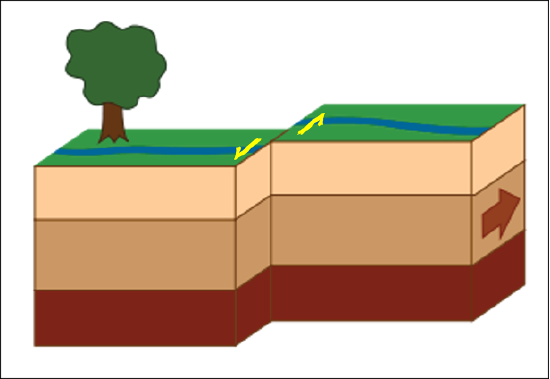
In a strike-slip fault, horizontal motion occurs, in the direction of strike (hence the name), with blocks on opposite sides of a fault sliding past each other due to shear forces (Figure 15.18 and Table 15.4). Movement is therefore either to the left or to the right.
The San Andreas Fault here in California is a classic example of a right-lateral strike-slip fault (Figure 15.19). To determine the relative sense of motion, an observer would stand along one side of the fault, looking across at the opposite fault block. If that fault block appears to have moved right, it is right-lateral; if it has moved left, it is left-lateral. Check out this USGS strike-slip fault video to visualize the motion further.
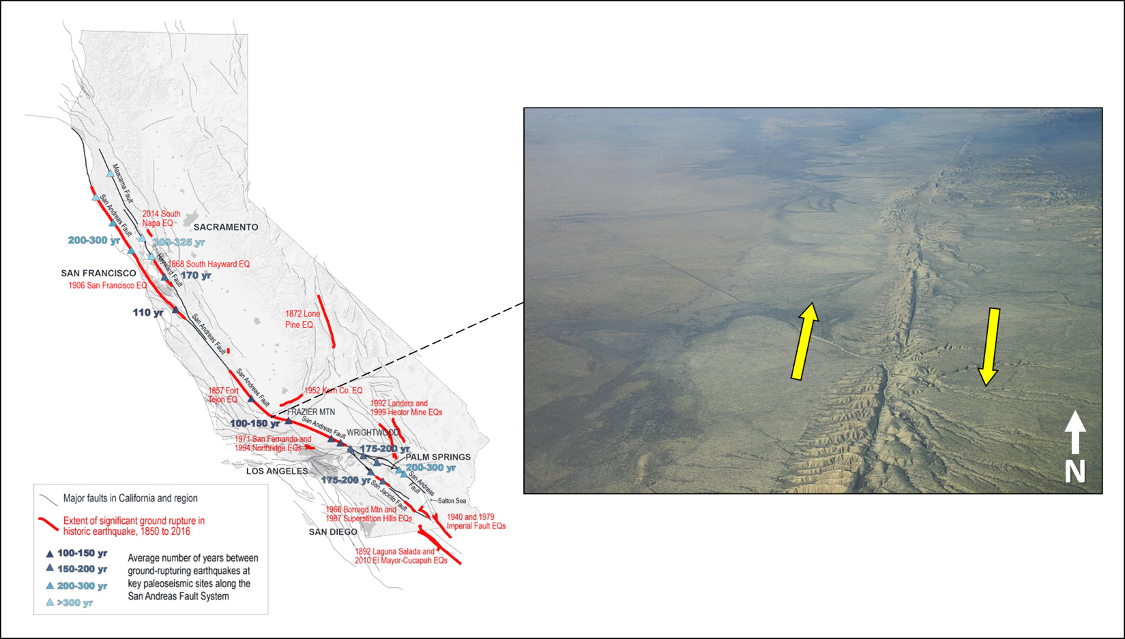
Table 15.4: The fault types.
| Fault type | Type of Stress | Direction of block movement | Resulting strain | Associated plate boundary type |
|---|---|---|---|---|
| Normal | Extensional | Vertical; HW moves down | Stretching & thinning | Divergent & rifting |
| Reverse | Compressional | Vertical; HW moves up | Shortening & thickening | Convergent |
| Strike-slip | Shear | Horizontal; left or right | Tearing | Transform |
Geologic Maps
What Are Geologic Maps and Why Are They Important?
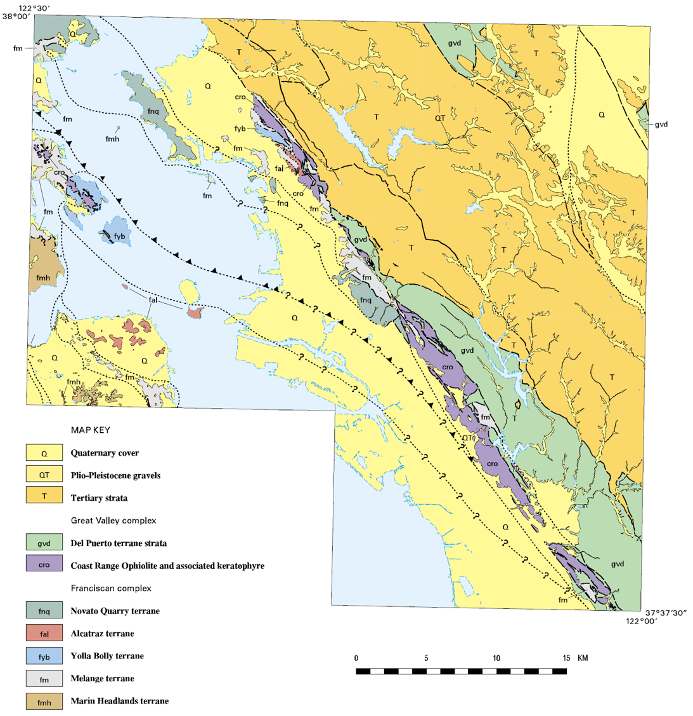
A geologic map uses lines, symbols, and colors to illustrate information about the nature and distribution of rock units within an area (Figure 15.20). Typically, a geologic map will depict mappable rock or sediment units. A mappable unit of rock or sediment is one that a geologist can consistently recognize, trace across a landscape, and describe so that other geologists may recognize and verify its presence and identity. Generally, a mappable unit is a geologic formation. These mappable units are shown as different colors or patterns on a base map (usually a topographic map), over which information about geologic contacts and strikes and dips are included. Geologists make these maps by making careful field observations at numerous outcrops (exposed rocks at the Earth’s surface) throughout the mapping area. At each outcrop, geologists record information such as rock type, strike and dip of the rock layers, and relative age data. Geologic maps take practice to understand, since they display three-dimensional features, such as folds, on a two-dimensional surface.
Geologic maps are important for two reasons. First, as geologists make geologic maps and related explanations and cross-sections, they develop a theoretical understanding of the geology and geologic history of a given area. Second, geologic maps are essential tools for practical applications such as zoning, engineering, and hazard assessment. Geologic maps are also vital in finding and developing geological resources, such as sediments, groundwater, fossil fuels, and minerals.
What Are the Essential Components of Geologic Maps?
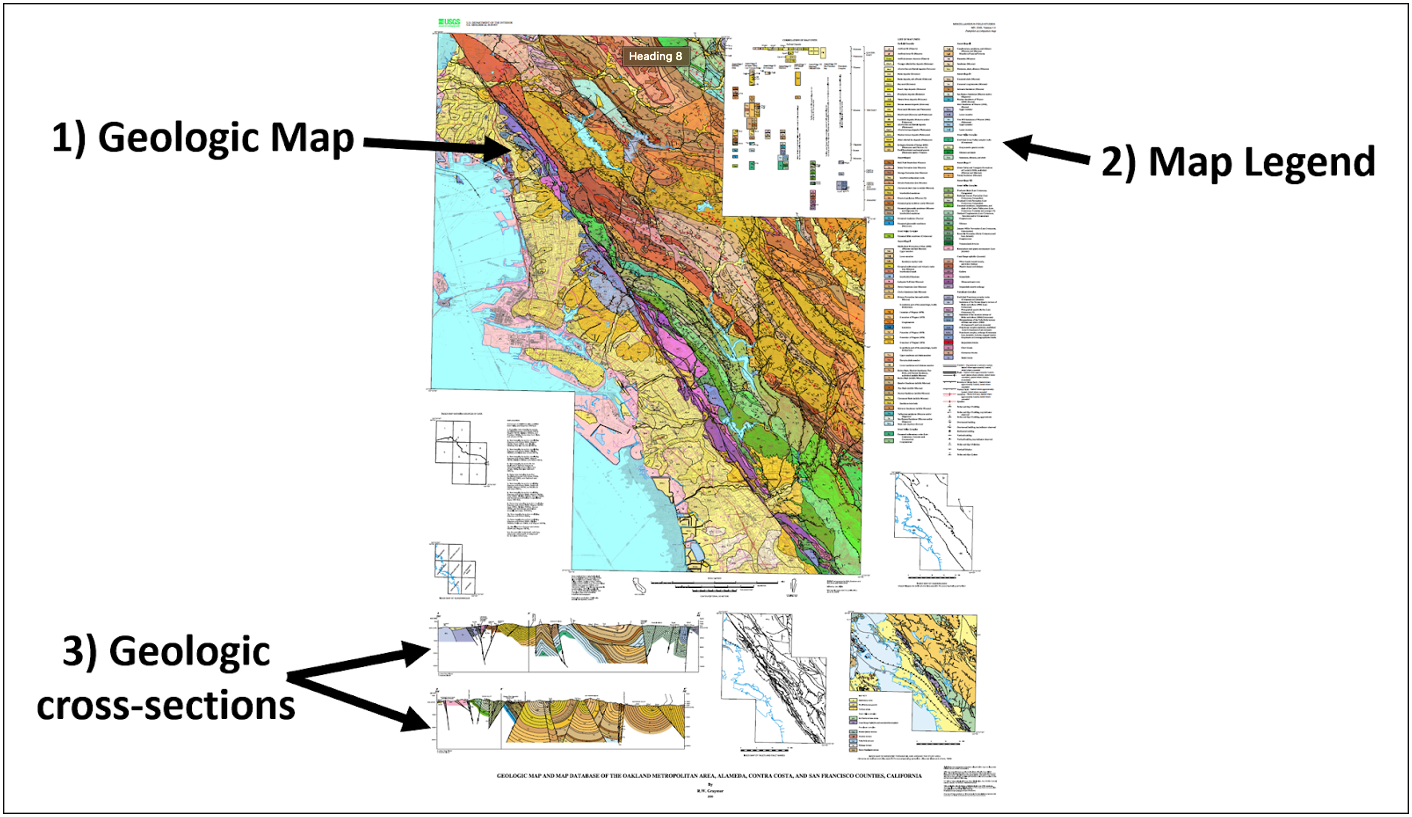
Most geologic maps have the following features (Figure 15.21):
- The map itself
- The map legend or key that explains all the symbols on the map
- Geologic cross-section(s) of the map area. These will be explored further in the next chapter.
What Is a Geologic Map Legend?
The map legend to a geologic map is usually printed on the same page as the map and follows a customary format (Figure 15.22).
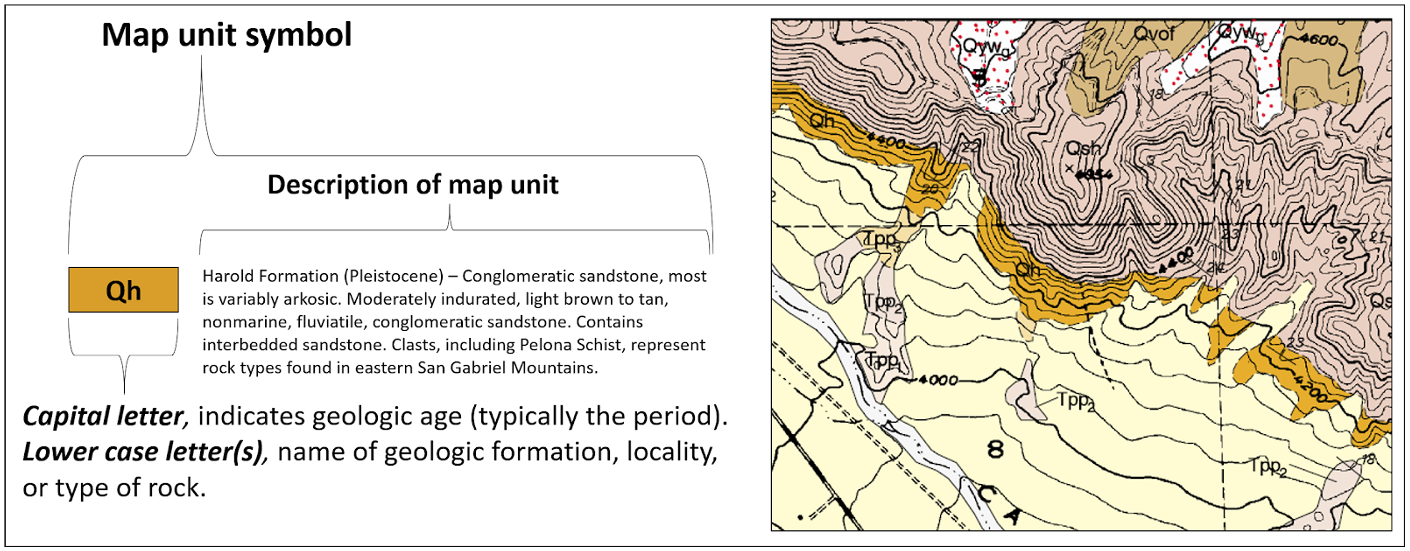
The symbol for each formation, or unit, is shown in a box next to its name with a brief description. The symbols typically follow superposition and are stacked in an age sequence from oldest at the bottom to youngest at the top. This allows the map reader to quickly assess the relative age of each unit. The geologic age (typically the geologic period) is listed for each unit in the key and uses standard symbols (Table 15.6). The map legend also contains an explanation of the symbols shown on the map, such as the symbols for different types of faults and folds (Table 15.5). The explanations of rock units often follow the map symbol on the map, but for very large maps are often given in a separate pamphlet that accompanies the map. The explanations include descriptions with enough detail for any geologist to be able to recognize the units and learn how their ages were determined.
Table 15.5: General geologic map symbols.
| Map Symbol | Symbol Explanation |
|---|---|
 |
Strike & Dip |
 |
Vertical strata |
 |
Horizontal strata |
 |
Anticline axis |
 |
Syncline axis |
 |
Plunging anticline axis |
 |
Plunging syncline axis |
 |
Fault |
 |
Strike-slip fault |
 |
Normal fault |
 |
Reverse fault |
Table 15.6: General geologic age symbols.
| Relative Age | Geologic Age Symbol | Geologic Time Period |
|---|---|---|
| Younger | Q | Quaternary |
 |
T | Tertiary |
| K | Cretaceous | |
| J | Jurassic | |
| Tr | Triassic | |
| P | Permian | |
| IP | Pennsylvanian | |
| M | Mississippian | |
| D | Devonian | |
| S | Silurian | |
| O | Ordovician | |
| Є | Cambrian | |
| Older | pЄ | Precambrian |
A Few General Rules for Interpreting Geologic Maps
- Folds
- Anticlines have their oldest beds in the center, and their limbs (sides) dip away from the fold axis or hinge. Plunging anticlines plunge towards the closed end (nose) of the V-shaped outcrop belt.
- Synclines have their youngest beds in the center, and their limbs (sides) dip toward the fold axis or hinge. Plunging synclines plunge toward the open end of the V-shaped outcrop belt.
- Anticlines have their oldest beds in the center, and their limbs (sides) dip away from the fold axis or hinge. Plunging anticlines plunge towards the closed end (nose) of the V-shaped outcrop belt.
- Streams
- They intersect dipping beds of rock, they will cut V shapes in the direction of dip.
- They cut “V” shapes into horizontal beds and formation contacts that point upstream. The formation contacts are parallel to topographic contour lines, and the stream drainage system developed on horizontal and/or unstratified formations has a dendritic pattern that resembles the branching of a tree.
- They cut across vertical beds, there will not be a V-shape
- Faults
- Upthrown blocks of faults tend to be eroded more (down to older beds) than downthrown blocks.
- General
- Geologic contacts migrate downdip upon erosion.
- True dip angles can only be seen in cross-section if the cross-section is perpendicular to the fault or to the strike of the beds.
Attributions
- Figure 15.1: “Folding in the Himalaya” (CC-BY-NC-SA 3.0; Prakasam Muthus, distributed by imaggeo.egu.eu)
- Figure 15.2: “Stress” (CC-BY 4.0; Emily Haddad, own work)
- Table 15.1: “Stress” (CC-BY 4.0; Chloe Branciforte, own work
- Figure 15.3: “Geologic Perspectives” (CC-BY 4.0; Chloe Branciforte via Visible Geology)
- Figure 15.4: Derivative of “Geologic Perspectives” (CC-BY 4.0; Steven Earle via OpenText) by Chloe Branciforte
- Figure 15.5: “Strike and Dip” (CC-BY 4.0; Chloe Branciforte via Google Earth, own work)
- Figure 15.6: Derivative of “Antiform” (CC-BY 4.0; Steve Earle via OpenText) by Chloe Branciforte
- Figure 15.7: Derivative of “Stream and Tilted vs. Horizontal Layers” (CC-BY-SA 3.0; Randa Harris via LibreText) by Chloe Brancifort
- Figure 15.8: “Fold Anatomy” (CC-BY 4.0; Chloe Branciforte via Visible Geology)
- Figure 15.9: “Anticline” (CC-BY 4.0; Chloe Branciforte, own work)
- Figure 15.10: “Syncline” (CC-BY 4.0; Chloe Branciforte, own work)
- Table 15.2: “Simple Folds” (CC-BY 4.0; Chloe Branciforte, own work)
- Figure 15.11: “Plunging Folds” (CC-BY-SA 4.0; Elizabeth Johnson via VIVA)
- Figure 15.12: “Monocline01” (CC-BY-SA 3.0; Kilom691 via Wikipedia)
- Table 15.3: “Complex Folds” (CC-BY 4.0; Chloe Branciforte, own work)
- Figure 15.13: “Complex Folds” (CC-BY 4.0; Chloe Branciforte, own work)
- Figure 15.14: Derivative of “Dip-Slip Faults” (CC-BY-SA 3.0; Randa Harris via LibreText) by Chloe Branciforte
- Figure 15.15: Derivative of “Normal Fault” (Public Domain; USGS) by Chloe Branciforte
- Figure 15.16: “Fault-Horst-Graben” (Public Domain; Gregors via Wikimedia Commons)
- Figure 15.17: Derivative of “Thrust Fault” (Public Domain; USGS) by Chloe Branciforte
- Figure 15.18: Derivative of “Strike-slip Fault” (Public Domain; USGS) by Chloe Branciforte
- Figure 15.19: Derivative of “San Andreas Fault” (Public Domain; Karen Scharer/USGS, 1 and 2) and “Kluft-Photo-Carrizo-Plain-Nov-2007-Img 0327” (CC-BY 4.0; Ikluft via Wikimedia Commons) by Chloe Branciforte
- Table 15.4: “Fault Types” (CC-BY 4.0; Chloe Branciforte, own work)
- Figure 15.20: Derivative of “Geologic Map and Map Database of the Metropolitan Area, Alameda, Contra Costa, and San Francisco Counties, California” (Public Domain; R.W. Gramer/USGS) by Chloe Branciforte
- Figure 15.21: Derivative of “Geologic Map and Map Database of the Metropolitan Area, Alameda, Contra Costa, and San Francisco Counties, California” (Public Domain; R.W. Gramer/USGS) by Chloe Branciforte
- Figure 15.22: Derivative of “Geologic Map of the Telegraph Peak 7.5’ Quadrangle, San Bernardino County, California” (Public Domain; D.M Morton, M.O Woodburne, and J.H. Foster/USGS) by Chloe Branciforte
- Table 15.5: “Geologic Map Symbols” (CC-BY; Chloe Branciforte, own work)
- Table 15.6: “Geologic Age Symbols” (CC-BY; Chloe Branciforte, own work)