1.5: The Nature of Science
- Page ID
- 2488
\( \newcommand{\vecs}[1]{\overset { \scriptstyle \rightharpoonup} {\mathbf{#1}} } \)
\( \newcommand{\vecd}[1]{\overset{-\!-\!\rightharpoonup}{\vphantom{a}\smash {#1}}} \)
\( \newcommand{\id}{\mathrm{id}}\) \( \newcommand{\Span}{\mathrm{span}}\)
( \newcommand{\kernel}{\mathrm{null}\,}\) \( \newcommand{\range}{\mathrm{range}\,}\)
\( \newcommand{\RealPart}{\mathrm{Re}}\) \( \newcommand{\ImaginaryPart}{\mathrm{Im}}\)
\( \newcommand{\Argument}{\mathrm{Arg}}\) \( \newcommand{\norm}[1]{\| #1 \|}\)
\( \newcommand{\inner}[2]{\langle #1, #2 \rangle}\)
\( \newcommand{\Span}{\mathrm{span}}\)
\( \newcommand{\id}{\mathrm{id}}\)
\( \newcommand{\Span}{\mathrm{span}}\)
\( \newcommand{\kernel}{\mathrm{null}\,}\)
\( \newcommand{\range}{\mathrm{range}\,}\)
\( \newcommand{\RealPart}{\mathrm{Re}}\)
\( \newcommand{\ImaginaryPart}{\mathrm{Im}}\)
\( \newcommand{\Argument}{\mathrm{Arg}}\)
\( \newcommand{\norm}[1]{\| #1 \|}\)
\( \newcommand{\inner}[2]{\langle #1, #2 \rangle}\)
\( \newcommand{\Span}{\mathrm{span}}\) \( \newcommand{\AA}{\unicode[.8,0]{x212B}}\)
\( \newcommand{\vectorA}[1]{\vec{#1}} % arrow\)
\( \newcommand{\vectorAt}[1]{\vec{\text{#1}}} % arrow\)
\( \newcommand{\vectorB}[1]{\overset { \scriptstyle \rightharpoonup} {\mathbf{#1}} } \)
\( \newcommand{\vectorC}[1]{\textbf{#1}} \)
\( \newcommand{\vectorD}[1]{\overrightarrow{#1}} \)
\( \newcommand{\vectorDt}[1]{\overrightarrow{\text{#1}}} \)
\( \newcommand{\vectE}[1]{\overset{-\!-\!\rightharpoonup}{\vphantom{a}\smash{\mathbf {#1}}}} \)
\( \newcommand{\vecs}[1]{\overset { \scriptstyle \rightharpoonup} {\mathbf{#1}} } \)
\( \newcommand{\vecd}[1]{\overset{-\!-\!\rightharpoonup}{\vphantom{a}\smash {#1}}} \)
\(\newcommand{\avec}{\mathbf a}\) \(\newcommand{\bvec}{\mathbf b}\) \(\newcommand{\cvec}{\mathbf c}\) \(\newcommand{\dvec}{\mathbf d}\) \(\newcommand{\dtil}{\widetilde{\mathbf d}}\) \(\newcommand{\evec}{\mathbf e}\) \(\newcommand{\fvec}{\mathbf f}\) \(\newcommand{\nvec}{\mathbf n}\) \(\newcommand{\pvec}{\mathbf p}\) \(\newcommand{\qvec}{\mathbf q}\) \(\newcommand{\svec}{\mathbf s}\) \(\newcommand{\tvec}{\mathbf t}\) \(\newcommand{\uvec}{\mathbf u}\) \(\newcommand{\vvec}{\mathbf v}\) \(\newcommand{\wvec}{\mathbf w}\) \(\newcommand{\xvec}{\mathbf x}\) \(\newcommand{\yvec}{\mathbf y}\) \(\newcommand{\zvec}{\mathbf z}\) \(\newcommand{\rvec}{\mathbf r}\) \(\newcommand{\mvec}{\mathbf m}\) \(\newcommand{\zerovec}{\mathbf 0}\) \(\newcommand{\onevec}{\mathbf 1}\) \(\newcommand{\real}{\mathbb R}\) \(\newcommand{\twovec}[2]{\left[\begin{array}{r}#1 \\ #2 \end{array}\right]}\) \(\newcommand{\ctwovec}[2]{\left[\begin{array}{c}#1 \\ #2 \end{array}\right]}\) \(\newcommand{\threevec}[3]{\left[\begin{array}{r}#1 \\ #2 \\ #3 \end{array}\right]}\) \(\newcommand{\cthreevec}[3]{\left[\begin{array}{c}#1 \\ #2 \\ #3 \end{array}\right]}\) \(\newcommand{\fourvec}[4]{\left[\begin{array}{r}#1 \\ #2 \\ #3 \\ #4 \end{array}\right]}\) \(\newcommand{\cfourvec}[4]{\left[\begin{array}{c}#1 \\ #2 \\ #3 \\ #4 \end{array}\right]}\) \(\newcommand{\fivevec}[5]{\left[\begin{array}{r}#1 \\ #2 \\ #3 \\ #4 \\ #5 \\ \end{array}\right]}\) \(\newcommand{\cfivevec}[5]{\left[\begin{array}{c}#1 \\ #2 \\ #3 \\ #4 \\ #5 \\ \end{array}\right]}\) \(\newcommand{\mattwo}[4]{\left[\begin{array}{rr}#1 \amp #2 \\ #3 \amp #4 \\ \end{array}\right]}\) \(\newcommand{\laspan}[1]{\text{Span}\{#1\}}\) \(\newcommand{\bcal}{\cal B}\) \(\newcommand{\ccal}{\cal C}\) \(\newcommand{\scal}{\cal S}\) \(\newcommand{\wcal}{\cal W}\) \(\newcommand{\ecal}{\cal E}\) \(\newcommand{\coords}[2]{\left\{#1\right\}_{#2}}\) \(\newcommand{\gray}[1]{\color{gray}{#1}}\) \(\newcommand{\lgray}[1]{\color{lightgray}{#1}}\) \(\newcommand{\rank}{\operatorname{rank}}\) \(\newcommand{\row}{\text{Row}}\) \(\newcommand{\col}{\text{Col}}\) \(\renewcommand{\row}{\text{Row}}\) \(\newcommand{\nul}{\text{Nul}}\) \(\newcommand{\var}{\text{Var}}\) \(\newcommand{\corr}{\text{corr}}\) \(\newcommand{\len}[1]{\left|#1\right|}\) \(\newcommand{\bbar}{\overline{\bvec}}\) \(\newcommand{\bhat}{\widehat{\bvec}}\) \(\newcommand{\bperp}{\bvec^\perp}\) \(\newcommand{\xhat}{\widehat{\xvec}}\) \(\newcommand{\vhat}{\widehat{\vvec}}\) \(\newcommand{\uhat}{\widehat{\uvec}}\) \(\newcommand{\what}{\widehat{\wvec}}\) \(\newcommand{\Sighat}{\widehat{\Sigma}}\) \(\newcommand{\lt}{<}\) \(\newcommand{\gt}{>}\) \(\newcommand{\amp}{&}\) \(\definecolor{fillinmathshade}{gray}{0.9}\)INTRODUCTION
Sometime in your life you’ve asked a question about the world around you. Probably you’ve asked a lot of questions over the years. The best way to answer questions about the natural world is by using science. Scientists ask questions every day, and then use a set of steps to answer those questions. The steps are known as the scientific method. By following the scientific method, scientists come up with the best information about the natural world. As a scientist, you need to do experiments to find out about the world. You also need to wonder, observe, talk, and think. Everything we learn helps us to ask new and better questions.
SCIENTIFIC METHOD
The scientific method is a set of steps that help us to answer questions. When we use logical steps and control the number of things that can be changed, we get better answers. As we test our ideas, we may come up with more questions. The basic sequence of steps followed in the scientific method is illustrated in figure 1.
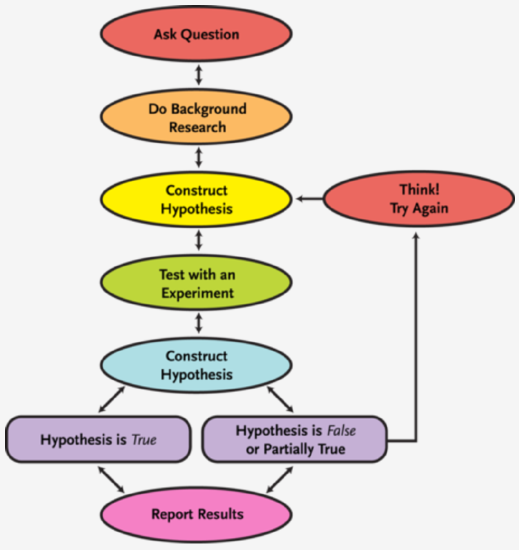
Figure 1. The Scientific Method
Questions
Asking a question is one really good way to begin to learn about the natural world. You might have seen something that makes you curious. You might want to know what to change to produce a better result. Let’s say a farmer is having an erosion problem. She wants to keep more soil on her farm. The farmer learns that a farming method called “no-till farming” allows farmers to plant seeds without plowing the land. She wonders if planting seeds without plowing will reduce the erosion problem and help keep more soil on her farmland. Her question is this: “Will using the no-till method of farming help me to lose less soil on my farm?” (figure 2).
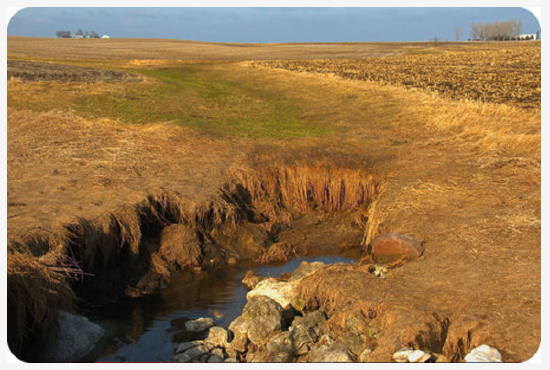
Figure 2. Soil is often lost from ground that has been plowed.
Research
Before she begins, the farmer needs to learn more about this farming method. She can look up information in books and magazines in the library. She may also search the Internet. A good way for her to learn is to talk to people who have tried this way of farming. She can use all of this information to figure out how she is going to test her question about no-till farming. Farming machines are shown in the figure 3.
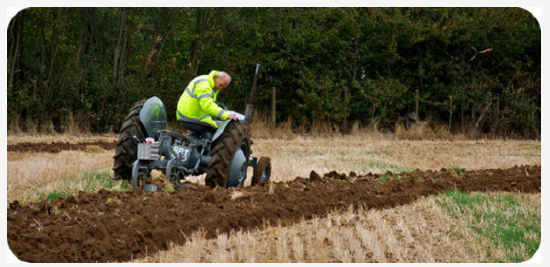
Figure 3. Rather than breaking up soil like in this picture, the farmer could try no-till farming methods.
Hypothesis
After doing the research, the farmer will try to answer the question. She might think, “If I don’t plow my fields, I will lose less soil than if I do plow the fields. Plowing disrupts the soil and breaks up roots that help hold soil in place.” This answer to her question is a hypothesis. A hypothesis is a reasonable explanation. A hypothesis can be tested. It may be the right answer, it may be a wrong answer, but it must be testable. Once she has a hypothesis, the next step is to do experiments to test the hypothesis. A hypothesis can be proved or disproved by testing. If a hypothesis is repeatedly tested and shown to be true, then scientists call it a theory.
Experiment
When we design experiments, we choose just one thing to change. The thing we change is called the independent variable. In the example, the farmer chooses two fields and then changes only one thing between them. She changes how she plows her fields. One field will be tilled and one will not. Everything else will be the same on both fields: the type of crop she grows, the amount of water and fertilizer that she uses, and the slope of the fields she plants on. The fields should be facing the same direction to get about the same amount of sunlight. These are the experimental controls. If the farmer only changes how she plows her fields, she can see the impact of the one change. After the experiment is complete, scientists then measure the result. The farmer measures how much soil is lost from each field. This is the dependent variable. How much soil is lost from each field “depends” on the plowing method.
Data and Experimental Error
During an experiment, a scientist collects data. The data might be measurements, like the farmer is taking in figure 4. The scientist should record the data in a notebook or onto a computer. The data is kept in charts that are clearly labeled. Labeling helps the scientist to know what each number represents. A scientist may also write descriptions of what happened during the experiment. At the end of the experiment the scientist studies the data. The scientist may create a graph or drawing to show the data. If the scientist can picture the data the results may be easier to understand. Then it is easier to draw logical conclusions.
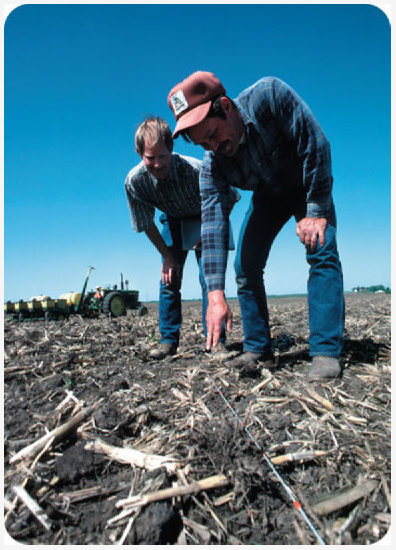
Figure 4. A pair of farmers take careful measurements in the field.
Even if the scientist is really careful it is possible to make a mistake. One kind of mistake is with the equipment. For example, an electronic balance may always measure one gram high. To fix this, the balance should be adjusted. If it can’t be adjusted, each measurement should be corrected. A mistake can come if a measurement is hard to make. For example, the scientist may stop a stopwatch too soon or too late. To fix this, the scientist should run the experiment many times and make many measurements. The average of the measurements will be the accurate answer. Sometimes the result from one experiment is very different from the other results. If one data point is really different, it may be thrown out. It is likely a mistake was made in that experiment.
Conclusions
The scientist must next form a conclusion. The scientist must study all of the data. What statement best explains the data? Did the experiment prove the hypothesis? Sometimes an experiment shows that a hypothesis is correct. Other times the data disproves the hypothesis. Sometimes it’s not possible to tell. If there is no conclusion, the scientist may test the hypothesis again. This time he will use some different experiments. No matter what the experiment shows the scientist has learned something. Even a disproved hypothesis can lead to new questions.
The farmer grows crops on the two fields for a season. She finds that 2.2 times as much soil was lost on the plowed field as compared to the unplowed field. She concludes that her hypothesis was correct. The farmer also notices some other differences in the two plots. The plants in the no-till plots are taller. The soil moisture seems higher. She decides to repeat the experiment. This time she will measure soil moisture, plant growth, and the total amount of water the plants consume. From now on she will use no-till methods of farming. She will also research other factors that may reduce soil erosion.
Theory
When scientists have the data and conclusions, they write a paper. They publish their paper in a scientific journal. A journal is a magazine for the scientists who are interested in a certain field. Before the paper is printed, other scientists look at it to try to find mistakes. They see if the conclusions follow from the data. This is called peer review. If the paper is sound it is printed in the journal.
Other papers are published on the same topic in the journal. The evidence for or against a hypothesis is discussed by many scientists. Sometimes a hypothesis is repeatedly shown to be true and never shown to be false. The hypothesis then becomes a theory. Sometimes people say they have a ”theory” when what they have is a hypothesis.
In science, a theory has been repeatedly shown to be true. A theory is supported by many observations. However, a theory may be disproved if conflicting data is discovered. Many important theories have been shown to be true by many observations and experiments and are extremely unlikely to be disproved. These include the theory of plate tectonics and the theory of evolution.
SCIENTIFIC MODELS
Scientists use models to help them understand and explain ideas. Models explain objects or systems in a more simple way. Models often only show only a part of a system. The real situation is more complicated. Models help scientists to make predictions about complex systems. Some models are something that you can see or touch. Other types of models use an idea or numbers. Each type is useful in certain ways.
Scientists create models with computers. Computers can handle enormous amounts of data. This can more accurately represent the real situation. For example, Earth’s climate depends on an enormous number of factors. Climate models can predict how climate will change as certain gases are added to the atmosphere. To test how good a model is, scientists might start a test run at a time in the past. If the model can predict the present it is probably a good model. It is more likely to be accurate when predicting the future.
Physical Models
A physical model is a representation of something using objects. It can be three-dimensional, like a globe. It can also be a two-dimensional drawing or diagram. Models are usually smaller and simpler than the real object. They most likely leave out some parts, but contain the important parts. In a good model the parts are made or drawn to scale. Physical models allow us to see, feel and move their parts. This allows us to better understand the real system.
An example of a physical model is a drawing of the layers of Earth (figure 5). A drawing helps us to understand the structure of the planet. Yet there are many differences between a drawing and the real thing. The size of a model is much smaller, for example. A drawing also doesn’t give good idea of how substances move. Arrows showing the direction the material moves can help. A physical model is very useful but it can’t explain the real Earth perfectly.
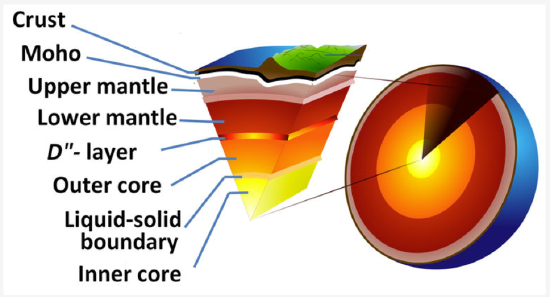
Figure 5. Earth's Center.
Ideas as Models
Some models are based on an idea that helps scientists explain something. A good idea explains all the known facts. An example is how Earth got its Moon. A Mars-sized planet hit Earth and rocky material broke off of both bodies (figure 6). This material orbited Earth and then came together to form the Moon. This is a model of something that happened billions of years ago. It brings together many facts known from our studies of the Moon’s surface. It accounts for the chemical makeup of rocks from the Moon, Earth, and meteorites. The physical properties of Earth and Moon figure in as well. Not all known data fits this model, but much does. There is also more information that we simply don’t yet know.
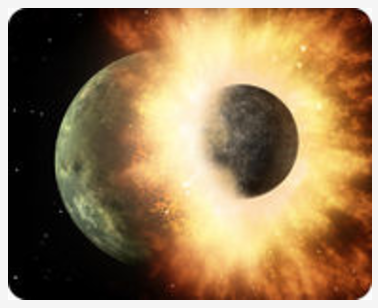
Figure 6. A collision showing a meteor striking Earth.
Models that Use Numbers
Models may use formulas or equations to describe something. Sometimes math may be the only way to describe it. For example, equations help scientists to explain what happened in the early days of the universe. The universe formed so long ago that math is the only way to describe it. A climate model includes lots of numbers, including temperature readings, ice density, snowfall levels, and humidity. These numbers are put into equations to make a model. The results are used to predict future climate. For example, if there are more clouds, does global temperature go up or down? Models are not perfect because they are simple versions of the real situation. Even so, these models are very useful to scientists. These days, models of complex things are made on computers.
LESSON SUMMARY
- Scientists ask questions about the natural world.
- Scientific method is a set of logical steps that can be used to answer these questions.
- A hypothesis is a reasonable explanation of something.
- A theory is a hypothesis that has been shown to be true many times over.
- Models represent real things but are simpler.
REFLECTION QUESTIONS
- What skill does this content help you develop?
- What are the key topics covered in this content?
- How can the content in this section help you demonstrate mastery of a specific skill?
- What questions do you have about this content?
Contributors and Attributions
Original content from Kimberly Schulte (Columbia Basin College) and supplemented by Lumen Learning. The content on this page is copyrighted under a Creative Commons Attribution 4.0 International license.

