15.1: Increasing Temperatures
- Page ID
- 25581
\( \newcommand{\vecs}[1]{\overset { \scriptstyle \rightharpoonup} {\mathbf{#1}} } \)
\( \newcommand{\vecd}[1]{\overset{-\!-\!\rightharpoonup}{\vphantom{a}\smash {#1}}} \)
\( \newcommand{\dsum}{\displaystyle\sum\limits} \)
\( \newcommand{\dint}{\displaystyle\int\limits} \)
\( \newcommand{\dlim}{\displaystyle\lim\limits} \)
\( \newcommand{\id}{\mathrm{id}}\) \( \newcommand{\Span}{\mathrm{span}}\)
( \newcommand{\kernel}{\mathrm{null}\,}\) \( \newcommand{\range}{\mathrm{range}\,}\)
\( \newcommand{\RealPart}{\mathrm{Re}}\) \( \newcommand{\ImaginaryPart}{\mathrm{Im}}\)
\( \newcommand{\Argument}{\mathrm{Arg}}\) \( \newcommand{\norm}[1]{\| #1 \|}\)
\( \newcommand{\inner}[2]{\langle #1, #2 \rangle}\)
\( \newcommand{\Span}{\mathrm{span}}\)
\( \newcommand{\id}{\mathrm{id}}\)
\( \newcommand{\Span}{\mathrm{span}}\)
\( \newcommand{\kernel}{\mathrm{null}\,}\)
\( \newcommand{\range}{\mathrm{range}\,}\)
\( \newcommand{\RealPart}{\mathrm{Re}}\)
\( \newcommand{\ImaginaryPart}{\mathrm{Im}}\)
\( \newcommand{\Argument}{\mathrm{Arg}}\)
\( \newcommand{\norm}[1]{\| #1 \|}\)
\( \newcommand{\inner}[2]{\langle #1, #2 \rangle}\)
\( \newcommand{\Span}{\mathrm{span}}\) \( \newcommand{\AA}{\unicode[.8,0]{x212B}}\)
\( \newcommand{\vectorA}[1]{\vec{#1}} % arrow\)
\( \newcommand{\vectorAt}[1]{\vec{\text{#1}}} % arrow\)
\( \newcommand{\vectorB}[1]{\overset { \scriptstyle \rightharpoonup} {\mathbf{#1}} } \)
\( \newcommand{\vectorC}[1]{\textbf{#1}} \)
\( \newcommand{\vectorD}[1]{\overrightarrow{#1}} \)
\( \newcommand{\vectorDt}[1]{\overrightarrow{\text{#1}}} \)
\( \newcommand{\vectE}[1]{\overset{-\!-\!\rightharpoonup}{\vphantom{a}\smash{\mathbf {#1}}}} \)
\( \newcommand{\vecs}[1]{\overset { \scriptstyle \rightharpoonup} {\mathbf{#1}} } \)
\(\newcommand{\longvect}{\overrightarrow}\)
\( \newcommand{\vecd}[1]{\overset{-\!-\!\rightharpoonup}{\vphantom{a}\smash {#1}}} \)
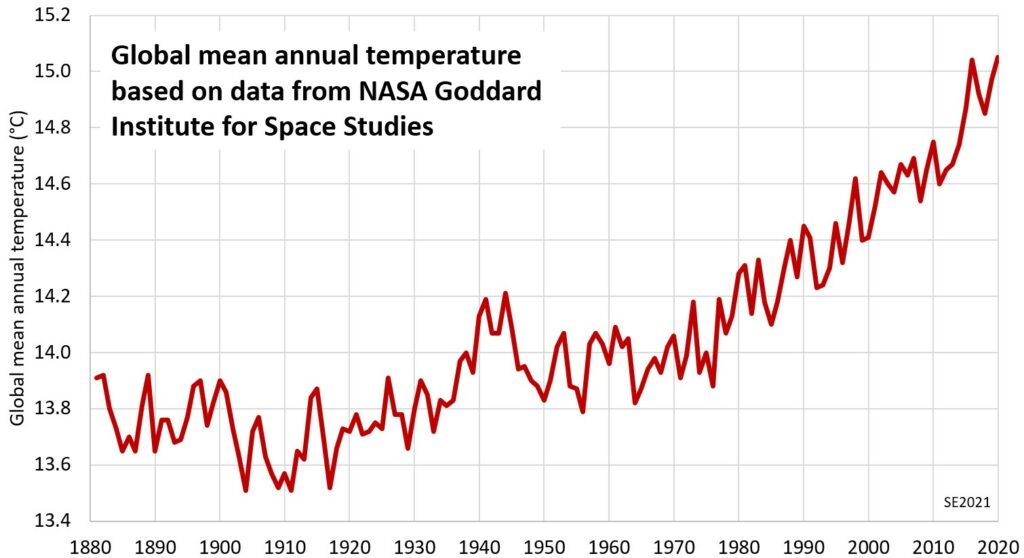
\(\newcommand{\avec}{\mathbf a}\) \(\newcommand{\bvec}{\mathbf b}\) \(\newcommand{\cvec}{\mathbf c}\) \(\newcommand{\dvec}{\mathbf d}\) \(\newcommand{\dtil}{\widetilde{\mathbf d}}\) \(\newcommand{\evec}{\mathbf e}\) \(\newcommand{\fvec}{\mathbf f}\) \(\newcommand{\nvec}{\mathbf n}\) \(\newcommand{\pvec}{\mathbf p}\) \(\newcommand{\qvec}{\mathbf q}\) \(\newcommand{\svec}{\mathbf s}\) \(\newcommand{\tvec}{\mathbf t}\) \(\newcommand{\uvec}{\mathbf u}\) \(\newcommand{\vvec}{\mathbf v}\) \(\newcommand{\wvec}{\mathbf w}\) \(\newcommand{\xvec}{\mathbf x}\) \(\newcommand{\yvec}{\mathbf y}\) \(\newcommand{\zvec}{\mathbf z}\) \(\newcommand{\rvec}{\mathbf r}\) \(\newcommand{\mvec}{\mathbf m}\) \(\newcommand{\zerovec}{\mathbf 0}\) \(\newcommand{\onevec}{\mathbf 1}\) \(\newcommand{\real}{\mathbb R}\) \(\newcommand{\twovec}[2]{\left[\begin{array}{r}#1 \\ #2 \end{array}\right]}\) \(\newcommand{\ctwovec}[2]{\left[\begin{array}{c}#1 \\ #2 \end{array}\right]}\) \(\newcommand{\threevec}[3]{\left[\begin{array}{r}#1 \\ #2 \\ #3 \end{array}\right]}\) \(\newcommand{\cthreevec}[3]{\left[\begin{array}{c}#1 \\ #2 \\ #3 \end{array}\right]}\) \(\newcommand{\fourvec}[4]{\left[\begin{array}{r}#1 \\ #2 \\ #3 \\ #4 \end{array}\right]}\) \(\newcommand{\cfourvec}[4]{\left[\begin{array}{c}#1 \\ #2 \\ #3 \\ #4 \end{array}\right]}\) \(\newcommand{\fivevec}[5]{\left[\begin{array}{r}#1 \\ #2 \\ #3 \\ #4 \\ #5 \\ \end{array}\right]}\) \(\newcommand{\cfivevec}[5]{\left[\begin{array}{c}#1 \\ #2 \\ #3 \\ #4 \\ #5 \\ \end{array}\right]}\) \(\newcommand{\mattwo}[4]{\left[\begin{array}{rr}#1 \amp #2 \\ #3 \amp #4 \\ \end{array}\right]}\) \(\newcommand{\laspan}[1]{\text{Span}\{#1\}}\) \(\newcommand{\bcal}{\cal B}\) \(\newcommand{\ccal}{\cal C}\) \(\newcommand{\scal}{\cal S}\) \(\newcommand{\wcal}{\cal W}\) \(\newcommand{\ecal}{\cal E}\) \(\newcommand{\coords}[2]{\left\{#1\right\}_{#2}}\) \(\newcommand{\gray}[1]{\color{gray}{#1}}\) \(\newcommand{\lgray}[1]{\color{lightgray}{#1}}\) \(\newcommand{\rank}{\operatorname{rank}}\) \(\newcommand{\row}{\text{Row}}\) \(\newcommand{\col}{\text{Col}}\) \(\renewcommand{\row}{\text{Row}}\) \(\newcommand{\nul}{\text{Nul}}\) \(\newcommand{\var}{\text{Var}}\) \(\newcommand{\corr}{\text{corr}}\) \(\newcommand{\len}[1]{\left|#1\right|}\) \(\newcommand{\bbar}{\overline{\bvec}}\) \(\newcommand{\bhat}{\widehat{\bvec}}\) \(\newcommand{\bperp}{\bvec^\perp}\) \(\newcommand{\xhat}{\widehat{\xvec}}\) \(\newcommand{\vhat}{\widehat{\vvec}}\) \(\newcommand{\uhat}{\widehat{\uvec}}\) \(\newcommand{\what}{\widehat{\wvec}}\) \(\newcommand{\Sighat}{\widehat{\Sigma}}\) \(\newcommand{\lt}{<}\) \(\newcommand{\gt}{>}\) \(\newcommand{\amp}{&}\) \(\definecolor{fillinmathshade}{gray}{0.9}\)There is no question that global temperatures are rising (Figure 15.1.1), and there is no doubt that humans are the cause of that rise, mostly because of our prolific use of fossil fuels, but for other reasons as well. Over the past 60 years (from 1960 to 2020) the global mean annual temperature in both land and sea areas has risen from 14° C to 15° C. Although the temperature rise was erratic in the early part of the 20th century, it has been quite consistent since 1960, increasing at a rate of 0.16° C per decade over the 60 year period, and by about 0.25° C per decade since 2000. If that continues, we are on track to exceed the Paris agreement’s aspirational goal of limiting warming to 1.5° C above pre-industrial levels by 2050.

As shown on Figure 15.1.2, most of the warming over the past 40 years has been in the northern hemisphere, and especially the far north. That is partly because of the much greater landmass of the northern hemisphere (since land areas warm faster than ocean areas). The far north is particularly affected by warming because of the significant loss of sea ice in the Arctic Ocean. Late summer Arctic Ocean sea ice extent is now typically about 60% of what it was in 1980, and the large areas of open water absorb a great deal more solar energy than the snow-covered ice that used to be there, adding to the warming. Another positive feedback from warming in the Arctic is the melting of permafrost, releasing stored methane and carbon dioxide.
In addition to the far north, central and eastern Europe and the Arabian Peninsula have seen very strong warming, and there has also been strong warming in the rest of Europe, northern China, much of Africa, Brazil, the southeastern USA and eastern Australia.
The significant warming of our climate has resulted in increased evaporation, and that is one reason why forests are so dry in many regions, leading to the increased incidence of wildfires described in the introduction to this chapter. The other reason is localized and periodic reduced rainfall.

While the heat has made many places drier, some regions have become wetter because warmer air can hold more moisture than cold air. For example, much of the interior of British Columbia has seen higher levels of precipitation in recent decades. A typical BC interior precipitation record is shown on Figure 15.1.3. The average precipitation in Kaslo in the period 1915 to 1925 was 51 mm/month and the monthly amount never exceeded 70 mm. In the period from 1997 to 2007 the average was 72 mm/month (a 40% increase), and it only dropped below 60 mm for five months during that decade. This significant increase in precipitation has not been without consequences. In July 2012 part of a slope near to Kaslo failed, leading to a debris flow that killed four people in the community of Johnsons Landing. The failure can be linked to the overall increase in precipitation in the region, and also to a particularly high level of rainfall in the weeks before the event.

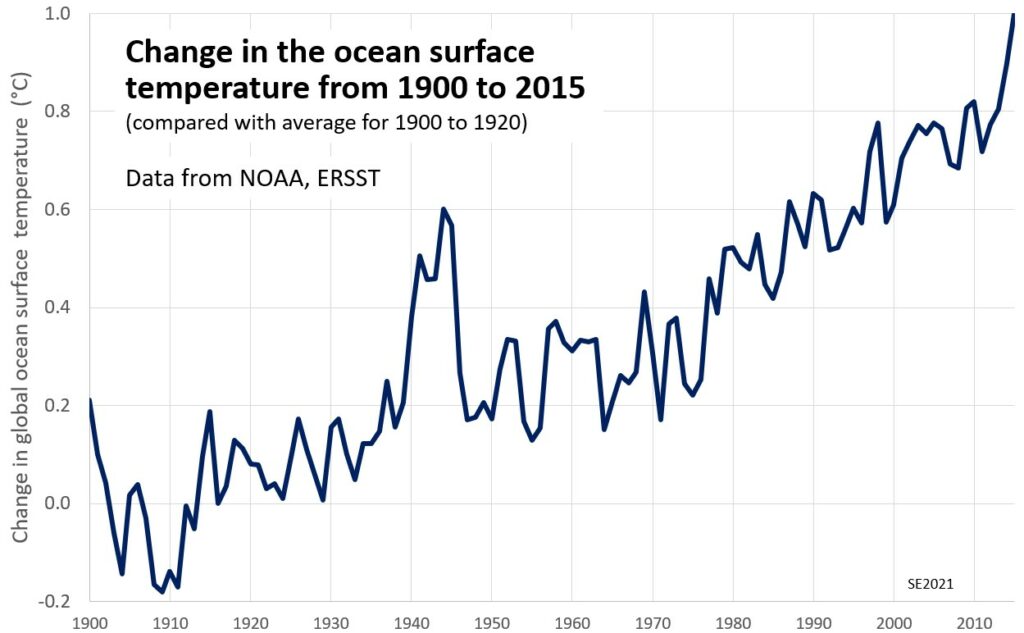
The excess heat that exists within the atmosphere is slowly being transferred to the oceans and this is illustrated on Figure 15.1.4. Since the early years of the 20th century there has been a 1° C increase in the temperature of the surface waters of the ocean. Because warm water takes up more space than cold water, this has contributed to sea level rise (described in Section 15.2), and also to an increased incidence of tropical cyclones (described in Section 15.3). Warm water can hold less carbon dioxide than cold water, so some of the ocean’s CO2 is being transferred to the atmosphere. Warm water can also hold less oxygen than cold water, and that is slowly contributing to lower oxygen levels in the oceans and in lakes.

An important implication of warming ocean water is the breakdown of reef ecosystems. Damage to corals within tropical reefs occurs when the water temperature exceeds their range of tolerance and the symbiotic relationship between the coral structures and the algae (zooxanthellae) living within their tissues breaks down. The result is bleached—and therefore, likely dead—coral. Coral reefs are a vital component of ocean ecosystems, and their breakdown also has implications for marine sedimentation and the stability of the sea floor.
Exercise 15.1 Mountain Pine Beetles
The image below shows a forest in the Fraser Lake region of central British Columbia that has been affected by Mountain Pine Beetles (MPB, Dendroctonus ponderosae). The trees that are brown will soon be dead and bare of needles, and it will take decades for the forest to recover. Since the late 1990s the MPB has affected BC forests over an area of 180,000 km2, about 16% of the total area of the province, or an area as large as Washington State. The MPB has thrived in BC’s pine forests because it no longer gets cold enough in winters to kill most of the beetle larvae, because summers are warmer and drier, and also because forestry policies in BC (and elsewhere) have turned massive areas that used to have diverse ecosystems, into monoculture tree farms.

Based on what you can see in the photo above, describe some likely geological implications of the MPB infestation for this region, and other areas similarly affected.
Exercise answers are provided Appendix 2.
Media Attributions
- Figure 15.1.1 Steven Earle, CC BY 4.0, based on data from NASA Goddard Institute for Space Studies (accessed April, 2021), public domain, https://data.giss.nasa.gov/gistemp/t...LB.Ts+dSST.txt
- Figure 15.1.2Making Sense of climate Sensitivity from NASA, public domain, https://climate.nasa.gov/blog/3017/m...e-sensitivity/
- Figure 15.1.3 Steven Earle, CC BY 4.0, based on Open Government Licence – Canada data from Environment Canada.
- Figure 15.1.4 Steven Earle, CC BY 4.0, based on data from National Oceanic and Atmospheric Administration (NOAA) (2016). Extended reconstructed sea surface temperature (ERSST.v4). National Centers for Environmental Information/ Environmental Protection Agency. https://www.epa.gov/climate-indicato...mperature#ref6
- Figure 15.1.5Mt. Fraser Pine Beetle Damage by Themightyquill, 2006, CC BY-SA 3.0, via Wikimedia Commons, https://commons.wikimedia.org/wiki/F...tle_Damage.JPG


