
4.4.2: How do geologists find oil and natural gas?
- Page ID
- 15649

\( \newcommand{\vecs}[1]{\overset { \scriptstyle \rightharpoonup} {\mathbf{#1}} } \)
\( \newcommand{\vecd}[1]{\overset{-\!-\!\rightharpoonup}{\vphantom{a}\smash {#1}}} \)
\( \newcommand{\dsum}{\displaystyle\sum\limits} \)
\( \newcommand{\dint}{\displaystyle\int\limits} \)
\( \newcommand{\dlim}{\displaystyle\lim\limits} \)
\( \newcommand{\id}{\mathrm{id}}\) \( \newcommand{\Span}{\mathrm{span}}\)
( \newcommand{\kernel}{\mathrm{null}\,}\) \( \newcommand{\range}{\mathrm{range}\,}\)
\( \newcommand{\RealPart}{\mathrm{Re}}\) \( \newcommand{\ImaginaryPart}{\mathrm{Im}}\)
\( \newcommand{\Argument}{\mathrm{Arg}}\) \( \newcommand{\norm}[1]{\| #1 \|}\)
\( \newcommand{\inner}[2]{\langle #1, #2 \rangle}\)
\( \newcommand{\Span}{\mathrm{span}}\)
\( \newcommand{\id}{\mathrm{id}}\)
\( \newcommand{\Span}{\mathrm{span}}\)
\( \newcommand{\kernel}{\mathrm{null}\,}\)
\( \newcommand{\range}{\mathrm{range}\,}\)
\( \newcommand{\RealPart}{\mathrm{Re}}\)
\( \newcommand{\ImaginaryPart}{\mathrm{Im}}\)
\( \newcommand{\Argument}{\mathrm{Arg}}\)
\( \newcommand{\norm}[1]{\| #1 \|}\)
\( \newcommand{\inner}[2]{\langle #1, #2 \rangle}\)
\( \newcommand{\Span}{\mathrm{span}}\) \( \newcommand{\AA}{\unicode[.8,0]{x212B}}\)
\( \newcommand{\vectorA}[1]{\vec{#1}} % arrow\)
\( \newcommand{\vectorAt}[1]{\vec{\text{#1}}} % arrow\)
\( \newcommand{\vectorB}[1]{\overset { \scriptstyle \rightharpoonup} {\mathbf{#1}} } \)
\( \newcommand{\vectorC}[1]{\textbf{#1}} \)
\( \newcommand{\vectorD}[1]{\overrightarrow{#1}} \)
\( \newcommand{\vectorDt}[1]{\overrightarrow{\text{#1}}} \)
\( \newcommand{\vectE}[1]{\overset{-\!-\!\rightharpoonup}{\vphantom{a}\smash{\mathbf {#1}}}} \)
\( \newcommand{\vecs}[1]{\overset { \scriptstyle \rightharpoonup} {\mathbf{#1}} } \)
\(\newcommand{\longvect}{\overrightarrow}\)
\( \newcommand{\vecd}[1]{\overset{-\!-\!\rightharpoonup}{\vphantom{a}\smash {#1}}} \)
\(\newcommand{\avec}{\mathbf a}\) \(\newcommand{\bvec}{\mathbf b}\) \(\newcommand{\cvec}{\mathbf c}\) \(\newcommand{\dvec}{\mathbf d}\) \(\newcommand{\dtil}{\widetilde{\mathbf d}}\) \(\newcommand{\evec}{\mathbf e}\) \(\newcommand{\fvec}{\mathbf f}\) \(\newcommand{\nvec}{\mathbf n}\) \(\newcommand{\pvec}{\mathbf p}\) \(\newcommand{\qvec}{\mathbf q}\) \(\newcommand{\svec}{\mathbf s}\) \(\newcommand{\tvec}{\mathbf t}\) \(\newcommand{\uvec}{\mathbf u}\) \(\newcommand{\vvec}{\mathbf v}\) \(\newcommand{\wvec}{\mathbf w}\) \(\newcommand{\xvec}{\mathbf x}\) \(\newcommand{\yvec}{\mathbf y}\) \(\newcommand{\zvec}{\mathbf z}\) \(\newcommand{\rvec}{\mathbf r}\) \(\newcommand{\mvec}{\mathbf m}\) \(\newcommand{\zerovec}{\mathbf 0}\) \(\newcommand{\onevec}{\mathbf 1}\) \(\newcommand{\real}{\mathbb R}\) \(\newcommand{\twovec}[2]{\left[\begin{array}{r}#1 \\ #2 \end{array}\right]}\) \(\newcommand{\ctwovec}[2]{\left[\begin{array}{c}#1 \\ #2 \end{array}\right]}\) \(\newcommand{\threevec}[3]{\left[\begin{array}{r}#1 \\ #2 \\ #3 \end{array}\right]}\) \(\newcommand{\cthreevec}[3]{\left[\begin{array}{c}#1 \\ #2 \\ #3 \end{array}\right]}\) \(\newcommand{\fourvec}[4]{\left[\begin{array}{r}#1 \\ #2 \\ #3 \\ #4 \end{array}\right]}\) \(\newcommand{\cfourvec}[4]{\left[\begin{array}{c}#1 \\ #2 \\ #3 \\ #4 \end{array}\right]}\) \(\newcommand{\fivevec}[5]{\left[\begin{array}{r}#1 \\ #2 \\ #3 \\ #4 \\ #5 \\ \end{array}\right]}\) \(\newcommand{\cfivevec}[5]{\left[\begin{array}{c}#1 \\ #2 \\ #3 \\ #4 \\ #5 \\ \end{array}\right]}\) \(\newcommand{\mattwo}[4]{\left[\begin{array}{rr}#1 \amp #2 \\ #3 \amp #4 \\ \end{array}\right]}\) \(\newcommand{\laspan}[1]{\text{Span}\{#1\}}\) \(\newcommand{\bcal}{\cal B}\) \(\newcommand{\ccal}{\cal C}\) \(\newcommand{\scal}{\cal S}\) \(\newcommand{\wcal}{\cal W}\) \(\newcommand{\ecal}{\cal E}\) \(\newcommand{\coords}[2]{\left\{#1\right\}_{#2}}\) \(\newcommand{\gray}[1]{\color{gray}{#1}}\) \(\newcommand{\lgray}[1]{\color{lightgray}{#1}}\) \(\newcommand{\rank}{\operatorname{rank}}\) \(\newcommand{\row}{\text{Row}}\) \(\newcommand{\col}{\text{Col}}\) \(\renewcommand{\row}{\text{Row}}\) \(\newcommand{\nul}{\text{Nul}}\) \(\newcommand{\var}{\text{Var}}\) \(\newcommand{\corr}{\text{corr}}\) \(\newcommand{\len}[1]{\left|#1\right|}\) \(\newcommand{\bbar}{\overline{\bvec}}\) \(\newcommand{\bhat}{\widehat{\bvec}}\) \(\newcommand{\bperp}{\bvec^\perp}\) \(\newcommand{\xhat}{\widehat{\xvec}}\) \(\newcommand{\vhat}{\widehat{\vvec}}\) \(\newcommand{\uhat}{\widehat{\uvec}}\) \(\newcommand{\what}{\widehat{\wvec}}\) \(\newcommand{\Sighat}{\widehat{\Sigma}}\) \(\newcommand{\lt}{<}\) \(\newcommand{\gt}{>}\) \(\newcommand{\amp}{&}\) \(\definecolor{fillinmathshade}{gray}{0.9}\)Geologists use a lot of the information that you now have to locate oil and natural gas. First, geologists think about where oil and gas form. We know that they form rocks like shale, which form in deep marine environments. So, a geologist would start out by looking for shale. There are a couple of ways to go about this.
One way is to look at the rocks exposed at the surface of the earth. By making a geologic map and extrapolating what we find at the surface beneath, we can form a reasonable guess about what rocks are below. One problem with this is that oil and gas can be far beneath the surface, and it’s possible that faults or folds could exist below that we cannot see at the surface. Here’s an example of a geologic map that shows rock units at the surface, and the cross section that was made based on the data collected at the surface.
Another way to find out what’s below the surface is to drill a core through the earth. Cores can be thousands of feet long, and provide a snapshot of what exists beneath a particular point. By drilling several cores miles apart, geologists can correlate the rock units and create an image of what exists and where below the surface. Combining this information with rocks exposed at the surface, which can give clues about rock orientations below, can be a powerful tool in locating oil and gas. This generalized geologic cross section provided by Penn State’s Marcellus Center for Outreach and Research (MCOR) was created based on information from cores that were drilled across Pennsylvania. Once you have an idea of what the big picture is, you can figure out where the particular rock type you’re looking for might be. Walther’s law is particularly important here, because you can get a sense of which direction in the rock unit you need to move to get to the rock you want.
Check Your Understanding
If you want to find a shale and your section of core looks like this, should you move up section or down section? Remember that older rocks are on the bottom, and younger rocks are on top. OR two cores, with correlations between them. Which way is the basin?
beach - meandering river - braided river: Answer - down in the core. This progression has depositional environments that are getting progressively ‘shallower’, and shale is found in a very deep marine depositional environment.
A third way to get an idea of what is below the surface is to run a seismic survey. Remember from the very beginning of the geology lesson that a Seismologist is a geologist who studies earthquakes, and the properties of elastic waves through the earth. Earthquakes create natural waves that move through the earth, and by recording them seismologists can study the earthquake itself in addition to the properties of the different layers of the earth. It’s in large part thanks to earthquakes that we know the outer core is liquid!
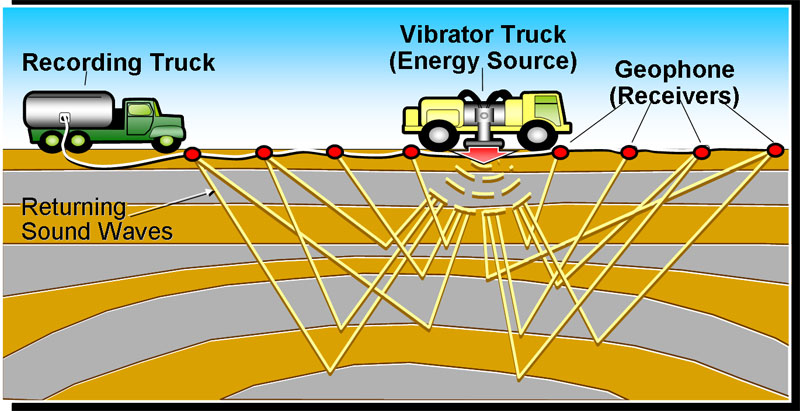
In a seismic survey a human-generated wave is sent through the earth using a thumper truck, dynamite, or simply a hammer (the more energy in the wave, the farther it will go before dissipating). Just as P-waves can pass through the entirety of the earth (if they have enough energy) and S-waves cannot pass through liquids, different rocks interact with the waves caused by thumper trucks in different ways. Depending on the properties of the rock, the thumper-truck wave can either pass through, be reflected, or some combination of the two. In a seismic survey there will be a point source for the wave (the place the wave comes from) and a number of ‘geophones’ set up around the point source that ‘listen’ for the reflections of the waves when they come back to the surface. The length of time it takes for the wave to return depends on the properties of the rock that reflects it and how deep the rock is.
Credit: Chesapeake Energy Corp
Seismic surveys can’t tell you precisely what types of rock are below the surface, but they can give you an idea of what the structures below the surface are. Here’s an example of the data that comes out of a seismic survey.
Each solid line drawn in and labeled represents a particular stratigraphic surface, which we haven’t discussed in this course. For more information on stratigraphic sequences, including what they are and how to identify them, visit the SEPM (link is external)website, or the website of Dr. Steve Holland at the University of Georgia, UGA Stratigraphy Lab(link is external). When looking at seismic data, it’s important to remember that the Y-axis represents time: How long it took for the wave to go from the source to the layer to the geophone. Seismic data also includes a number of ‘echoes’, or doubled seismic reflectors. These are identifiable by a series of perfectly duplicated lines, and they form when the wave bounces inside a layer before coming out. Usually only the first of these represents a real surface in the rock.
Uncertainties
Each of these methods for identifying what’s going on beneath the surface of the earth comes with its own set of uncertainties. Figuring out what’s going on beneath the surface is a little like putting together a puzzle while blindfolded: we only know the shapes of the pieces we touch, and we can’t see the whole picture. We have to use all the tools and technology at our disposal in order to make the best picture of what’s below the surface that we possibly can based on what we know. Even then, the interpretation could be missing information, or could be wrong. Notice how the seismic data interpretation was correlated with a core (this is the information directly beneath the well symbol). Seismic data and cores often are taken together: By taking a core sample, geologists can identify with more certainty which of the seismic reflectors represents a surface or a change in rock type, and by taking a seismic survey, geologists can extend their interpretation of the core to get a much bigger picture without having to do more drilling.
Credit: Marcellus Center for Outreach and Research
Check Your Understanding
Using the graph of peak oil and gas depths, where should we drill for oil?
(overlay lines on the image above at the peak oil and peak gas zones, ~2800 and 4000m, straight line to the surface, curve across the top to show likely drilling locations)