15.5: Anthropogenic Causes of Climate Change
- Page ID
- 6940
\( \newcommand{\vecs}[1]{\overset { \scriptstyle \rightharpoonup} {\mathbf{#1}} } \)
\( \newcommand{\vecd}[1]{\overset{-\!-\!\rightharpoonup}{\vphantom{a}\smash {#1}}} \)
\( \newcommand{\id}{\mathrm{id}}\) \( \newcommand{\Span}{\mathrm{span}}\)
( \newcommand{\kernel}{\mathrm{null}\,}\) \( \newcommand{\range}{\mathrm{range}\,}\)
\( \newcommand{\RealPart}{\mathrm{Re}}\) \( \newcommand{\ImaginaryPart}{\mathrm{Im}}\)
\( \newcommand{\Argument}{\mathrm{Arg}}\) \( \newcommand{\norm}[1]{\| #1 \|}\)
\( \newcommand{\inner}[2]{\langle #1, #2 \rangle}\)
\( \newcommand{\Span}{\mathrm{span}}\)
\( \newcommand{\id}{\mathrm{id}}\)
\( \newcommand{\Span}{\mathrm{span}}\)
\( \newcommand{\kernel}{\mathrm{null}\,}\)
\( \newcommand{\range}{\mathrm{range}\,}\)
\( \newcommand{\RealPart}{\mathrm{Re}}\)
\( \newcommand{\ImaginaryPart}{\mathrm{Im}}\)
\( \newcommand{\Argument}{\mathrm{Arg}}\)
\( \newcommand{\norm}[1]{\| #1 \|}\)
\( \newcommand{\inner}[2]{\langle #1, #2 \rangle}\)
\( \newcommand{\Span}{\mathrm{span}}\) \( \newcommand{\AA}{\unicode[.8,0]{x212B}}\)
\( \newcommand{\vectorA}[1]{\vec{#1}} % arrow\)
\( \newcommand{\vectorAt}[1]{\vec{\text{#1}}} % arrow\)
\( \newcommand{\vectorB}[1]{\overset { \scriptstyle \rightharpoonup} {\mathbf{#1}} } \)
\( \newcommand{\vectorC}[1]{\textbf{#1}} \)
\( \newcommand{\vectorD}[1]{\overrightarrow{#1}} \)
\( \newcommand{\vectorDt}[1]{\overrightarrow{\text{#1}}} \)
\( \newcommand{\vectE}[1]{\overset{-\!-\!\rightharpoonup}{\vphantom{a}\smash{\mathbf {#1}}}} \)
\( \newcommand{\vecs}[1]{\overset { \scriptstyle \rightharpoonup} {\mathbf{#1}} } \)
\( \newcommand{\vecd}[1]{\overset{-\!-\!\rightharpoonup}{\vphantom{a}\smash {#1}}} \)
\(\newcommand{\avec}{\mathbf a}\) \(\newcommand{\bvec}{\mathbf b}\) \(\newcommand{\cvec}{\mathbf c}\) \(\newcommand{\dvec}{\mathbf d}\) \(\newcommand{\dtil}{\widetilde{\mathbf d}}\) \(\newcommand{\evec}{\mathbf e}\) \(\newcommand{\fvec}{\mathbf f}\) \(\newcommand{\nvec}{\mathbf n}\) \(\newcommand{\pvec}{\mathbf p}\) \(\newcommand{\qvec}{\mathbf q}\) \(\newcommand{\svec}{\mathbf s}\) \(\newcommand{\tvec}{\mathbf t}\) \(\newcommand{\uvec}{\mathbf u}\) \(\newcommand{\vvec}{\mathbf v}\) \(\newcommand{\wvec}{\mathbf w}\) \(\newcommand{\xvec}{\mathbf x}\) \(\newcommand{\yvec}{\mathbf y}\) \(\newcommand{\zvec}{\mathbf z}\) \(\newcommand{\rvec}{\mathbf r}\) \(\newcommand{\mvec}{\mathbf m}\) \(\newcommand{\zerovec}{\mathbf 0}\) \(\newcommand{\onevec}{\mathbf 1}\) \(\newcommand{\real}{\mathbb R}\) \(\newcommand{\twovec}[2]{\left[\begin{array}{r}#1 \\ #2 \end{array}\right]}\) \(\newcommand{\ctwovec}[2]{\left[\begin{array}{c}#1 \\ #2 \end{array}\right]}\) \(\newcommand{\threevec}[3]{\left[\begin{array}{r}#1 \\ #2 \\ #3 \end{array}\right]}\) \(\newcommand{\cthreevec}[3]{\left[\begin{array}{c}#1 \\ #2 \\ #3 \end{array}\right]}\) \(\newcommand{\fourvec}[4]{\left[\begin{array}{r}#1 \\ #2 \\ #3 \\ #4 \end{array}\right]}\) \(\newcommand{\cfourvec}[4]{\left[\begin{array}{c}#1 \\ #2 \\ #3 \\ #4 \end{array}\right]}\) \(\newcommand{\fivevec}[5]{\left[\begin{array}{r}#1 \\ #2 \\ #3 \\ #4 \\ #5 \\ \end{array}\right]}\) \(\newcommand{\cfivevec}[5]{\left[\begin{array}{c}#1 \\ #2 \\ #3 \\ #4 \\ #5 \\ \end{array}\right]}\) \(\newcommand{\mattwo}[4]{\left[\begin{array}{rr}#1 \amp #2 \\ #3 \amp #4 \\ \end{array}\right]}\) \(\newcommand{\laspan}[1]{\text{Span}\{#1\}}\) \(\newcommand{\bcal}{\cal B}\) \(\newcommand{\ccal}{\cal C}\) \(\newcommand{\scal}{\cal S}\) \(\newcommand{\wcal}{\cal W}\) \(\newcommand{\ecal}{\cal E}\) \(\newcommand{\coords}[2]{\left\{#1\right\}_{#2}}\) \(\newcommand{\gray}[1]{\color{gray}{#1}}\) \(\newcommand{\lgray}[1]{\color{lightgray}{#1}}\) \(\newcommand{\rank}{\operatorname{rank}}\) \(\newcommand{\row}{\text{Row}}\) \(\newcommand{\col}{\text{Col}}\) \(\renewcommand{\row}{\text{Row}}\) \(\newcommand{\nul}{\text{Nul}}\) \(\newcommand{\var}{\text{Var}}\) \(\newcommand{\corr}{\text{corr}}\) \(\newcommand{\len}[1]{\left|#1\right|}\) \(\newcommand{\bbar}{\overline{\bvec}}\) \(\newcommand{\bhat}{\widehat{\bvec}}\) \(\newcommand{\bperp}{\bvec^\perp}\) \(\newcommand{\xhat}{\widehat{\xvec}}\) \(\newcommand{\vhat}{\widehat{\vvec}}\) \(\newcommand{\uhat}{\widehat{\uvec}}\) \(\newcommand{\what}{\widehat{\wvec}}\) \(\newcommand{\Sighat}{\widehat{\Sigma}}\) \(\newcommand{\lt}{<}\) \(\newcommand{\gt}{>}\) \(\newcommand{\amp}{&}\) \(\definecolor{fillinmathshade}{gray}{0.9}\)As shown in the previous section, prehistoric changes in climate have been very slow. Climate changes typically occur slowly over many millions of years. The climate changes observed today are rapid and largely human-caused. Evidence shows that climate is changing, but what is causing that change? Scientists have suspected since the late 1800s that human-produced (anthropogenic) changes in atmospheric greenhouse gases would likely cause climate change, as changes in these gases have been the case every time in the geologic past. By the middle 1900s, systematic measurements began which confirmed that human-produced carbon dioxide was accumulating in the atmosphere and other earth systems, like forests and the oceans. By the end of the 1900s and into the early 2000’s the Theory of Anthropogenic Climate Change was solidified as evidence from thousands of ground-based studies and continuous satellite measurements of land and ocean mounted in number revealing the expected temperature increase. Theories evolve and transform as new data and new techniques become available, but they represent the state of thinking for that field. The Theory of Anthropogenic Climate Change is that humans are causing most of the current changes to climate by burning fossil fuels such as coal, oil, and natural gas. This section summarizes the scientific understanding of anthropogenic climate change.
Scientific Consensus
The overwhelming majority of climate studies indicate that human activity is causing rapid changes to the climate, which will cause severe environmental damage. There is a strong scientific consensus on the issue. Studies published in peer-reviewed scientific journals show that 97 percent of climate scientists agree that climate warming is from human activities [52]. There is no alternative explanation for the observed link between human-produced greenhouse gas emissions and the changing modern climate. Most leading scientific organizations endorse this position, including the U.S. National Academy of Science which was established in 1863 by an act of Congress under President Lincoln. Congress charged the National Academy of Science “with providing independent, objective advice to the nation on matters related to science and technology” [53]. Therefore, the National Academy of Science is the leading authority when it comes to policy advice related to scientific issues.
One way we know that the increased greenhouse gas emissions are from human activities is with isotopic fingerprints. For example, fossil fuels have a ratio of stable carbon-13 to carbon-12 (13C/12C) that is different from today’s stable carbon ratio in the atmosphere. Studies have been using isotopic carbon signatures to identify anthropogenic carbon in the atmosphere since the 1980s. Isotopic records from the Antarctic Ice Sheet show stable isotopic signature from ~1000 AD to ~1800 AD and a steady isotopic signature gradually changing since 1800 followed by rapid change after 1950. These changes show the atmosphere having a carbon isotopic signature increasingly more similar to that of fossil fuels [42; 54].
Anthropogenic Sources of Greenhouse Gases
Anthropogenic emissions of greenhouse gases have increased since pre-industrial times due to global economic growth and population growth. Atmospheric concentrations of the leading greenhouse gas, carbon dioxide, are at unprecedented levels that haven’t been observed in at least the last 800,000 years [6]. The pre-industrial level of carbon dioxide was at about 278 parts per million (ppm). As of 2016, carbon dioxide was, for the first time, above 400 ppm for the entirety of the year. Measurements of atmospheric carbon at the Mauna Loa Carbon Dioxide Observatory show a continuous increase since 1957 when the observatory was established from 315 ppm to over 410 ppm in 2017. The daily reading today can be seen at Daily CO2. Based on the ice core record over the past 800,000 years, carbon dioxide ranged from about 185 ppm during ice ages to 300 ppm during warm times [52]. View the data-accurate NOAA animation below of carbon dioxide trends over the last 800,000 years.

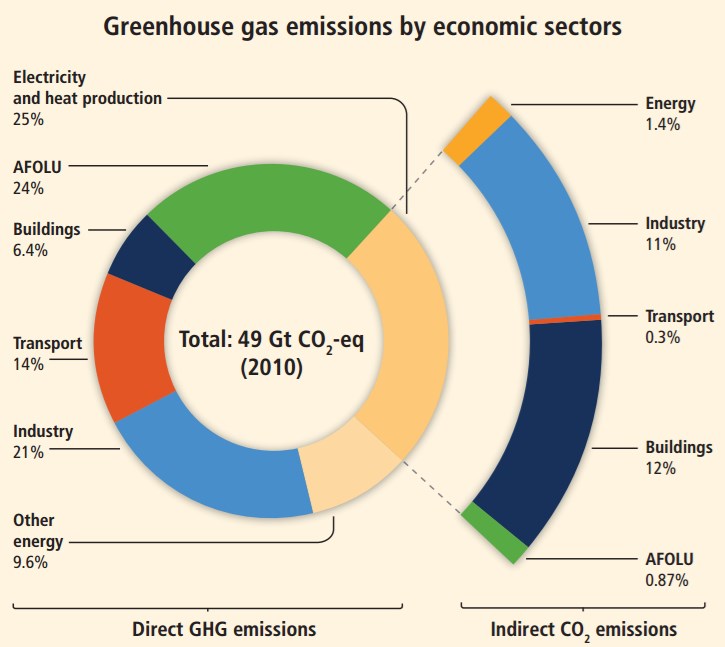
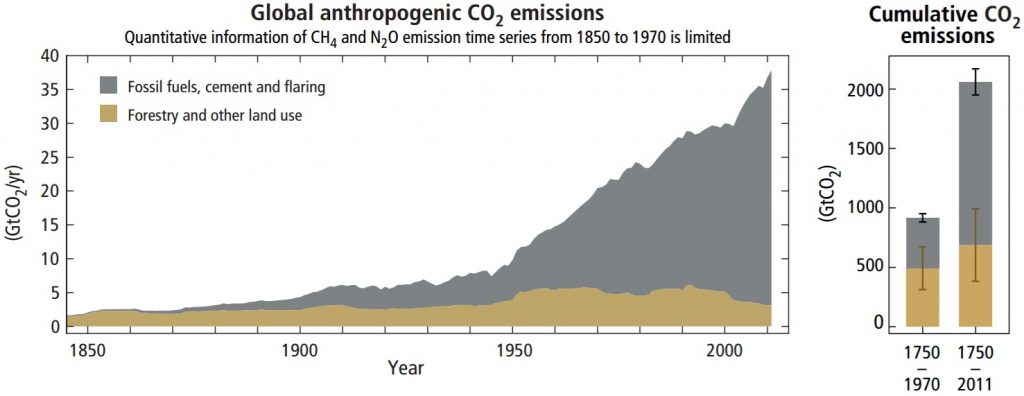
What is the source of these anthropogenic greenhouse gas emissions? Fossil fuel combustion and industrial processes contributed 78% of all emissions since 1970. Sectors of the economy responsible for most of this include electricity and heat production (25%); agriculture, forestry, and land use (24%); industry (21%); transportation including automobiles (14%); other energy production (9.6%); and buildings (6.4%) [6]. More than half of greenhouse gas emissions have occurred in the last 40 years (Figure 1.5 p.45 of [6] and 40% of these emissions have stayed in the atmosphere. Unfortunately, despite scientific consensus, efforts to mitigate climate change require political action. Despite the growing amount of climate change concern, mitigation efforts, legislation, and international agreements have reduced emissions in some places, yet the continued economic growth of the less developed world has increased global greenhouse gas emissions. In fact, the time between 2000 and 2010 saw the largest increases since 1970 [6].


