11.5: Water Use and Distribution
- Page ID
- 6912
\( \newcommand{\vecs}[1]{\overset { \scriptstyle \rightharpoonup} {\mathbf{#1}} } \)
\( \newcommand{\vecd}[1]{\overset{-\!-\!\rightharpoonup}{\vphantom{a}\smash {#1}}} \)
\( \newcommand{\id}{\mathrm{id}}\) \( \newcommand{\Span}{\mathrm{span}}\)
( \newcommand{\kernel}{\mathrm{null}\,}\) \( \newcommand{\range}{\mathrm{range}\,}\)
\( \newcommand{\RealPart}{\mathrm{Re}}\) \( \newcommand{\ImaginaryPart}{\mathrm{Im}}\)
\( \newcommand{\Argument}{\mathrm{Arg}}\) \( \newcommand{\norm}[1]{\| #1 \|}\)
\( \newcommand{\inner}[2]{\langle #1, #2 \rangle}\)
\( \newcommand{\Span}{\mathrm{span}}\)
\( \newcommand{\id}{\mathrm{id}}\)
\( \newcommand{\Span}{\mathrm{span}}\)
\( \newcommand{\kernel}{\mathrm{null}\,}\)
\( \newcommand{\range}{\mathrm{range}\,}\)
\( \newcommand{\RealPart}{\mathrm{Re}}\)
\( \newcommand{\ImaginaryPart}{\mathrm{Im}}\)
\( \newcommand{\Argument}{\mathrm{Arg}}\)
\( \newcommand{\norm}[1]{\| #1 \|}\)
\( \newcommand{\inner}[2]{\langle #1, #2 \rangle}\)
\( \newcommand{\Span}{\mathrm{span}}\) \( \newcommand{\AA}{\unicode[.8,0]{x212B}}\)
\( \newcommand{\vectorA}[1]{\vec{#1}} % arrow\)
\( \newcommand{\vectorAt}[1]{\vec{\text{#1}}} % arrow\)
\( \newcommand{\vectorB}[1]{\overset { \scriptstyle \rightharpoonup} {\mathbf{#1}} } \)
\( \newcommand{\vectorC}[1]{\textbf{#1}} \)
\( \newcommand{\vectorD}[1]{\overrightarrow{#1}} \)
\( \newcommand{\vectorDt}[1]{\overrightarrow{\text{#1}}} \)
\( \newcommand{\vectE}[1]{\overset{-\!-\!\rightharpoonup}{\vphantom{a}\smash{\mathbf {#1}}}} \)
\( \newcommand{\vecs}[1]{\overset { \scriptstyle \rightharpoonup} {\mathbf{#1}} } \)
\( \newcommand{\vecd}[1]{\overset{-\!-\!\rightharpoonup}{\vphantom{a}\smash {#1}}} \)
\(\newcommand{\avec}{\mathbf a}\) \(\newcommand{\bvec}{\mathbf b}\) \(\newcommand{\cvec}{\mathbf c}\) \(\newcommand{\dvec}{\mathbf d}\) \(\newcommand{\dtil}{\widetilde{\mathbf d}}\) \(\newcommand{\evec}{\mathbf e}\) \(\newcommand{\fvec}{\mathbf f}\) \(\newcommand{\nvec}{\mathbf n}\) \(\newcommand{\pvec}{\mathbf p}\) \(\newcommand{\qvec}{\mathbf q}\) \(\newcommand{\svec}{\mathbf s}\) \(\newcommand{\tvec}{\mathbf t}\) \(\newcommand{\uvec}{\mathbf u}\) \(\newcommand{\vvec}{\mathbf v}\) \(\newcommand{\wvec}{\mathbf w}\) \(\newcommand{\xvec}{\mathbf x}\) \(\newcommand{\yvec}{\mathbf y}\) \(\newcommand{\zvec}{\mathbf z}\) \(\newcommand{\rvec}{\mathbf r}\) \(\newcommand{\mvec}{\mathbf m}\) \(\newcommand{\zerovec}{\mathbf 0}\) \(\newcommand{\onevec}{\mathbf 1}\) \(\newcommand{\real}{\mathbb R}\) \(\newcommand{\twovec}[2]{\left[\begin{array}{r}#1 \\ #2 \end{array}\right]}\) \(\newcommand{\ctwovec}[2]{\left[\begin{array}{c}#1 \\ #2 \end{array}\right]}\) \(\newcommand{\threevec}[3]{\left[\begin{array}{r}#1 \\ #2 \\ #3 \end{array}\right]}\) \(\newcommand{\cthreevec}[3]{\left[\begin{array}{c}#1 \\ #2 \\ #3 \end{array}\right]}\) \(\newcommand{\fourvec}[4]{\left[\begin{array}{r}#1 \\ #2 \\ #3 \\ #4 \end{array}\right]}\) \(\newcommand{\cfourvec}[4]{\left[\begin{array}{c}#1 \\ #2 \\ #3 \\ #4 \end{array}\right]}\) \(\newcommand{\fivevec}[5]{\left[\begin{array}{r}#1 \\ #2 \\ #3 \\ #4 \\ #5 \\ \end{array}\right]}\) \(\newcommand{\cfivevec}[5]{\left[\begin{array}{c}#1 \\ #2 \\ #3 \\ #4 \\ #5 \\ \end{array}\right]}\) \(\newcommand{\mattwo}[4]{\left[\begin{array}{rr}#1 \amp #2 \\ #3 \amp #4 \\ \end{array}\right]}\) \(\newcommand{\laspan}[1]{\text{Span}\{#1\}}\) \(\newcommand{\bcal}{\cal B}\) \(\newcommand{\ccal}{\cal C}\) \(\newcommand{\scal}{\cal S}\) \(\newcommand{\wcal}{\cal W}\) \(\newcommand{\ecal}{\cal E}\) \(\newcommand{\coords}[2]{\left\{#1\right\}_{#2}}\) \(\newcommand{\gray}[1]{\color{gray}{#1}}\) \(\newcommand{\lgray}[1]{\color{lightgray}{#1}}\) \(\newcommand{\rank}{\operatorname{rank}}\) \(\newcommand{\row}{\text{Row}}\) \(\newcommand{\col}{\text{Col}}\) \(\renewcommand{\row}{\text{Row}}\) \(\newcommand{\nul}{\text{Nul}}\) \(\newcommand{\var}{\text{Var}}\) \(\newcommand{\corr}{\text{corr}}\) \(\newcommand{\len}[1]{\left|#1\right|}\) \(\newcommand{\bbar}{\overline{\bvec}}\) \(\newcommand{\bhat}{\widehat{\bvec}}\) \(\newcommand{\bperp}{\bvec^\perp}\) \(\newcommand{\xhat}{\widehat{\xvec}}\) \(\newcommand{\vhat}{\widehat{\vvec}}\) \(\newcommand{\uhat}{\widehat{\uvec}}\) \(\newcommand{\what}{\widehat{\wvec}}\) \(\newcommand{\Sighat}{\widehat{\Sigma}}\) \(\newcommand{\lt}{<}\) \(\newcommand{\gt}{>}\) \(\newcommand{\amp}{&}\) \(\definecolor{fillinmathshade}{gray}{0.9}\)
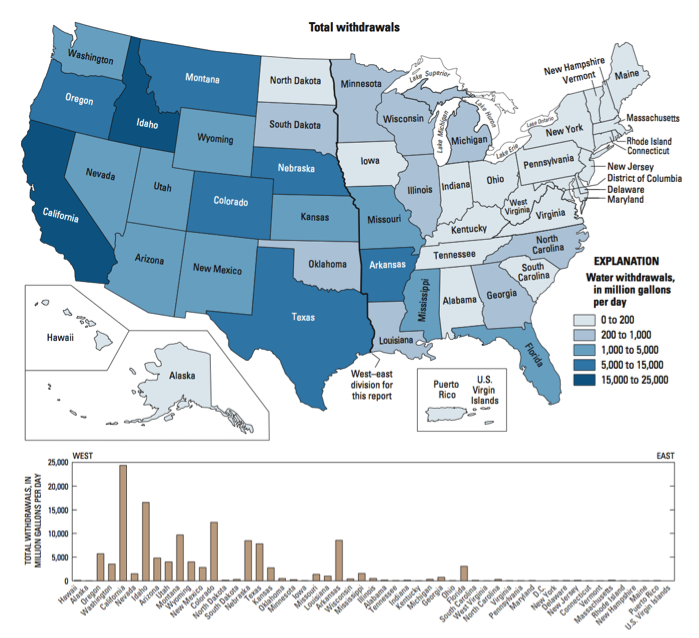
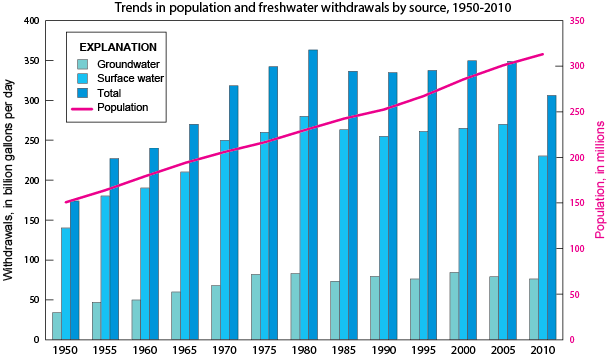
In the United States, 355 billion gallons of ground and surface water are withdrawn for use each day, of which 76 billion gallons are fresh groundwater. The state of California accounts for 16% of national groundwater withdrawals [8].
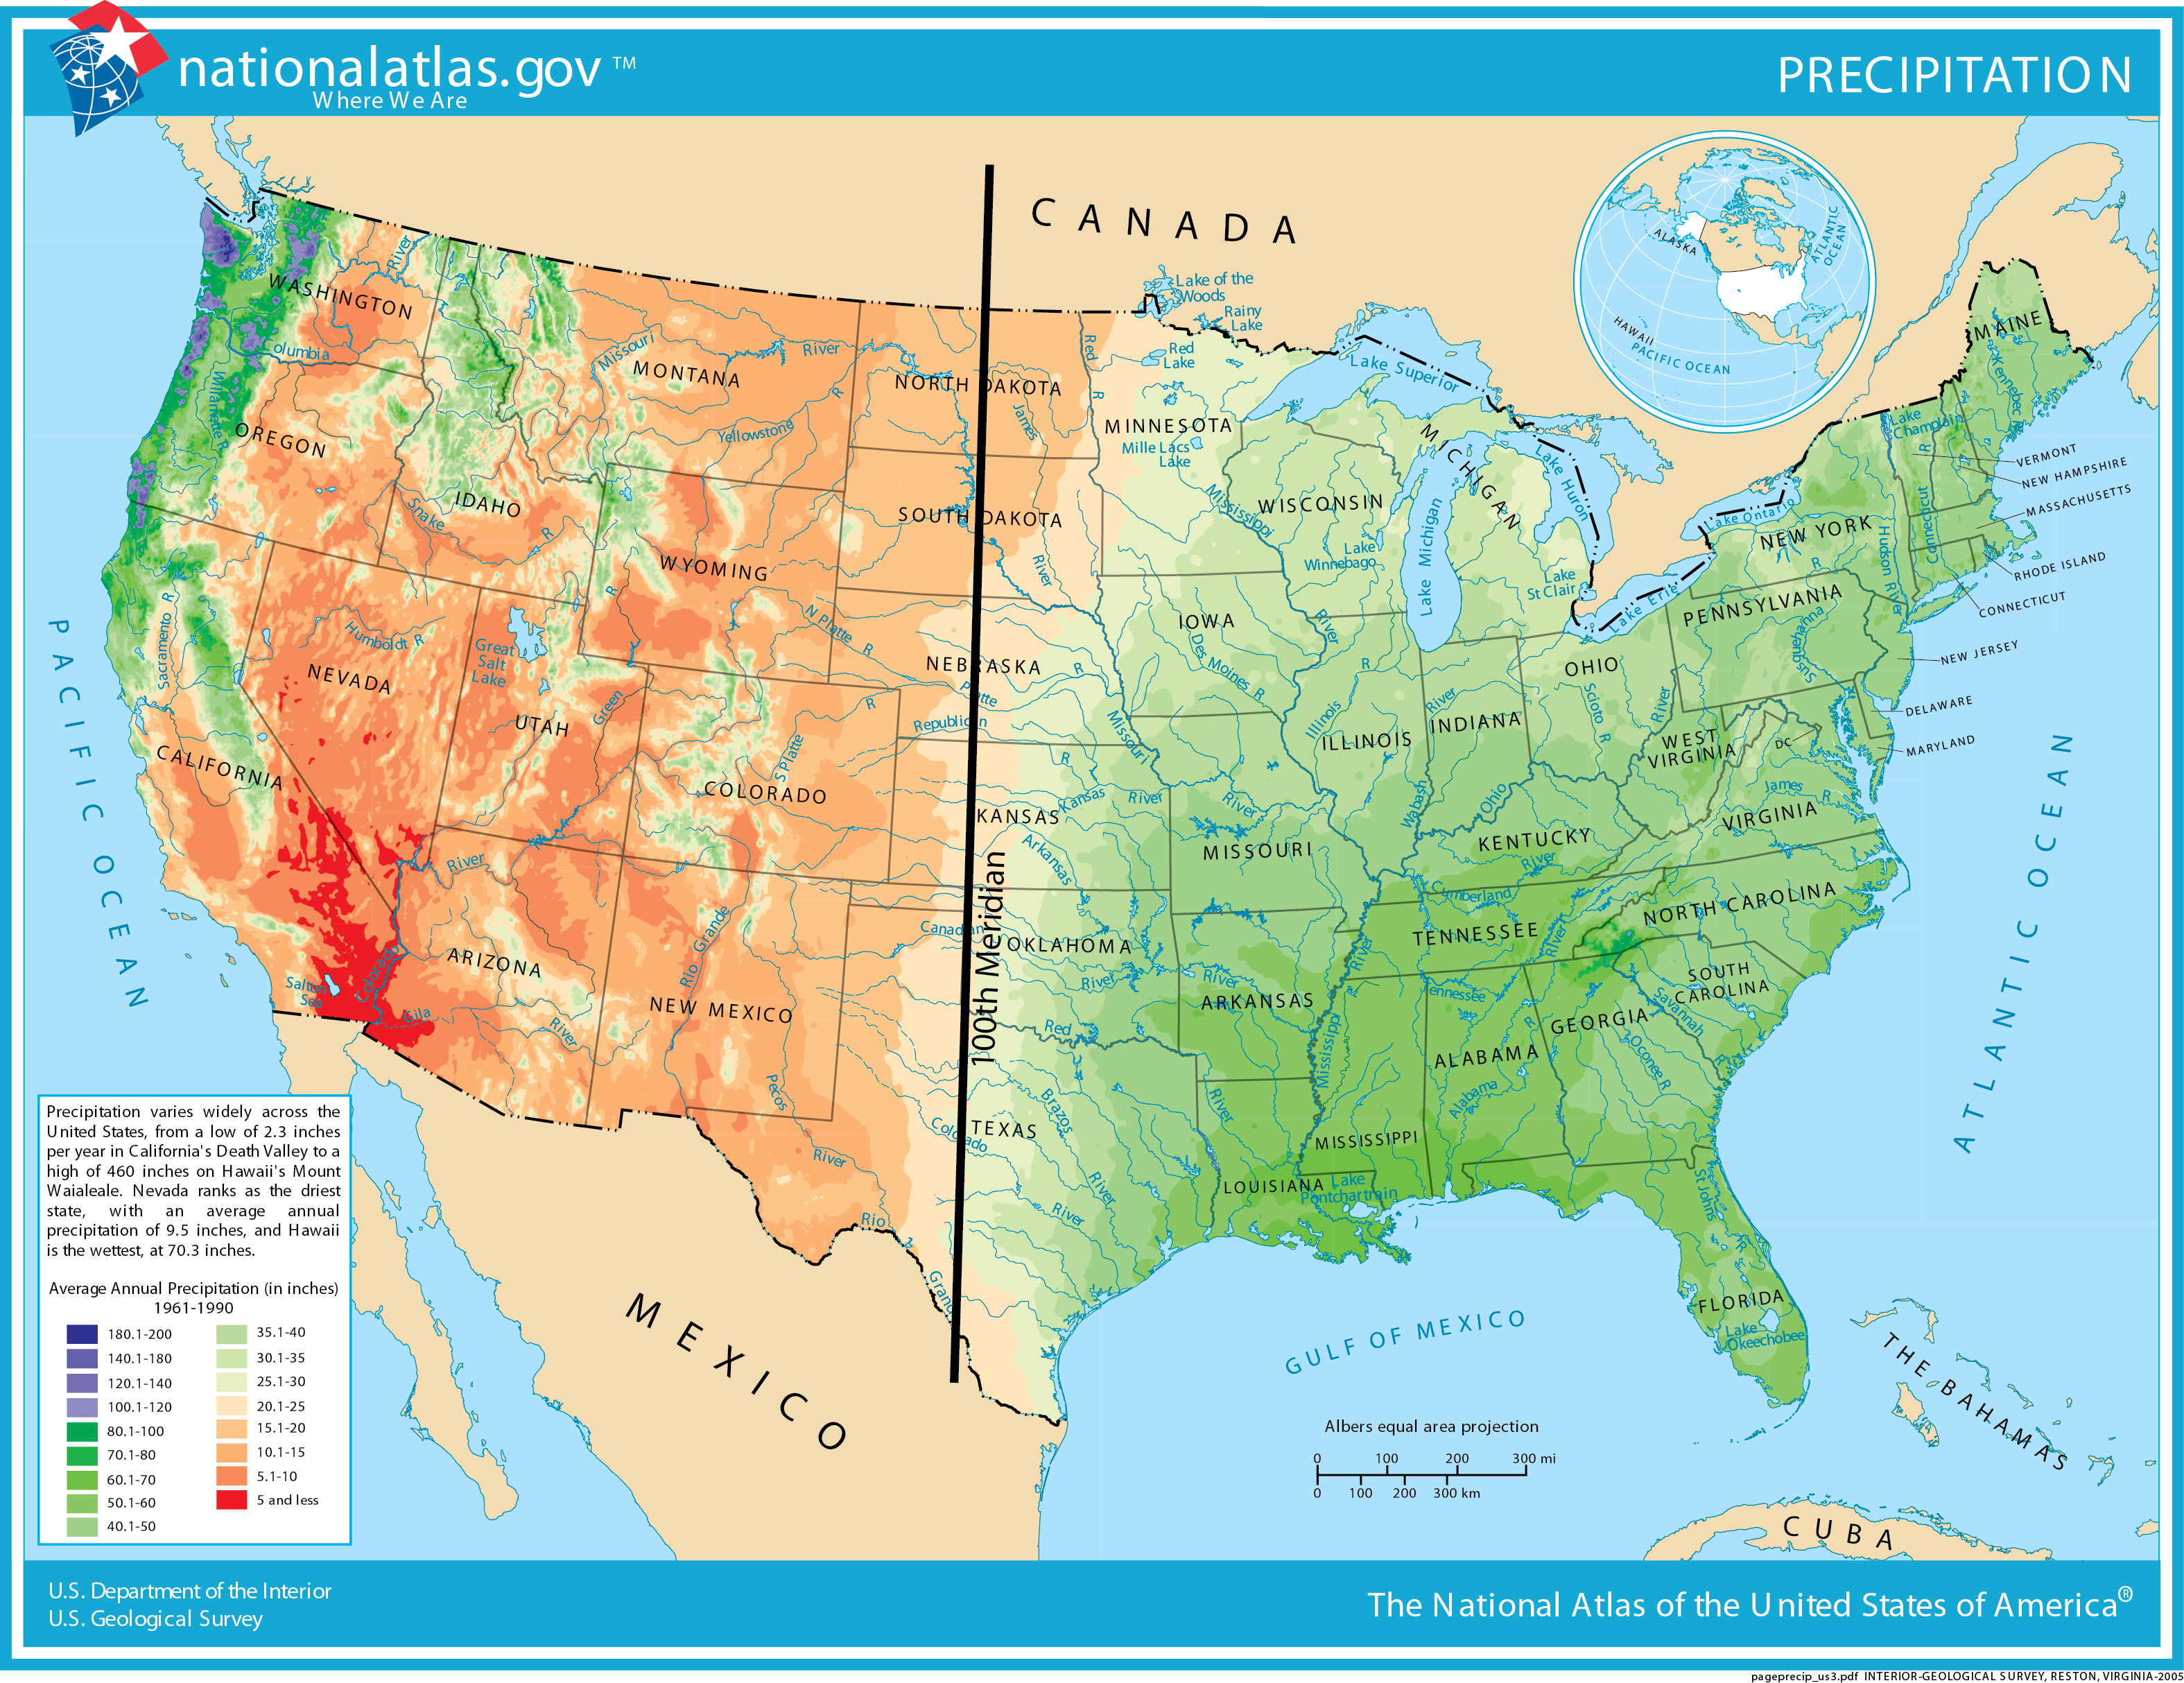
Utah is the second driest state in the United States behind its neighbor Nevada, having a mean statewide precipitation of 12.2 inches per year. Utah also has the second-highest per capita rate of total domestic water use [8] of 167 gallons per day per person. With the combination of relatively high demand and limited quantity, Utah is at risk for water budget deficits.

Surface Water Distribution
Surface water makes up only 1.2% of the freshwater available on the planet, and 69% of that surface water is trapped in ground ice and permafrost. Water in rivers accounts for only 0.006% of all freshwater and lakes contain only 0.26% of the world’s freshwater [9]. Freshwater is a precious resource and should not be taken for granted, especially in dry climate areas.
Global circulation patterns are the most important factor in precipitation, and thus, the distribution of surface water. In general, due to the Coriolis effect and the uneven heating of the Earth, air rises near the equator and near 60° north and south latitude and sinks at the poles and 30° north and south latitude (see Chapter 13 on Deserts). Landmasses near rising air are more prone to humid and wet climates while sinking air inhibits precipitation and creates dry conditions [10; 11]. Prevailing winds, ocean circulation patterns (e.g. the Gulf Stream’s effects on eastern North America, rain shadows (dry leeward sides of mountains), and even the proximity of bodies of water can affect local climate patterns. For example, when cold winds blow across the relatively warm Great Salt Lake, the air warms, which causes it to pick up moisture. This local increase in the moisture content of the air may eventually fall as snow or rain on nearby mountains, a phenomenon known as “lake-effect precipitation” [12].

In the United States, the 100th Meridian roughly marks the boundary between the humid and arid parts of the country while west of the 100th Meridian, irrigation is required to grow crops [13]. In the West, surface water is stored in reservoirs and mountain snowpacks [14], then strategically released through a system of canals during times of high use.
Some of the driest parts of the western United States are in the Basin and Range. The Basin and Range have multiple mountain ranges that are oriented north to south. Most of the basin valleys in the Basin and Range are dry, receiving less than 12 inches of precipitation per year. However, some of the mountain ranges can receive more than 60 inches of water as snow (snow-water-equivalent). The snow-water equivalent is the amount of water that would result if the snow were melted, as the snowpack is generally much thicker than the equivalent amount of water that it would produce [12].
Groundwater Distribution
| Water source | Water volume
(cubic miles) |
Freshwater (%) | Total water (%) |
|---|---|---|---|
| Oceans, Seas, & Bays | 321,000,000 | — | 96.5 |
| Ice caps, Glaciers, & Permanent Snow | 5,773,000 | 68.7 | 1.74 |
| Groundwater | 5,614,000 | — | 1.69 |
| — Fresh | 2,526,000 | 30.1 | 0.76 |
| — Saline | 3,088,000 | — | 0.93 |
| Soil Moisture | 3,959 | 0.05 | 0.001 |
| Ground Ice & Permafrost | 71,970 | 0.86 | 0.022 |
| Lakes | 42,320 | — | 0.013 |
| — Fresh | 21,830 | 0.26 | 0.007 |
| — Saline | 20,490 | — | 0.006 |
| Atmosphere | 3,095 | 0.04 | 0.001 |
| Swamp Water | 2,752 | 0.03 | 0.0008 |
| Rivers | 509 | 0.006 | 0.0002 |
| Biological Water | 269 | 0.003 | 0.0001 |
| Source: Igor Shiklomanov’s chapter “World freshwater resources” in Peter H. Gleick (editor), 1993, Water in Crisis: A Guide to the World’s Fresh Water Resources (Oxford University Press, New York) | |||
Groundwater makes up 30.1% of the freshwater on the planet, making it the most abundant reservoir of freshwater accessible to most humans. The majority of freshwater, 68.7%, is stored in glaciers and ice caps as ice [9]. As the glaciers and ice caps melt due to global warming, this freshwater is lost as it flows into the oceans.


