4.3: The Physics of Groundwater Movement
- Page ID
- 13470
\( \newcommand{\vecs}[1]{\overset { \scriptstyle \rightharpoonup} {\mathbf{#1}} } \)
\( \newcommand{\vecd}[1]{\overset{-\!-\!\rightharpoonup}{\vphantom{a}\smash {#1}}} \)
\( \newcommand{\id}{\mathrm{id}}\) \( \newcommand{\Span}{\mathrm{span}}\)
( \newcommand{\kernel}{\mathrm{null}\,}\) \( \newcommand{\range}{\mathrm{range}\,}\)
\( \newcommand{\RealPart}{\mathrm{Re}}\) \( \newcommand{\ImaginaryPart}{\mathrm{Im}}\)
\( \newcommand{\Argument}{\mathrm{Arg}}\) \( \newcommand{\norm}[1]{\| #1 \|}\)
\( \newcommand{\inner}[2]{\langle #1, #2 \rangle}\)
\( \newcommand{\Span}{\mathrm{span}}\)
\( \newcommand{\id}{\mathrm{id}}\)
\( \newcommand{\Span}{\mathrm{span}}\)
\( \newcommand{\kernel}{\mathrm{null}\,}\)
\( \newcommand{\range}{\mathrm{range}\,}\)
\( \newcommand{\RealPart}{\mathrm{Re}}\)
\( \newcommand{\ImaginaryPart}{\mathrm{Im}}\)
\( \newcommand{\Argument}{\mathrm{Arg}}\)
\( \newcommand{\norm}[1]{\| #1 \|}\)
\( \newcommand{\inner}[2]{\langle #1, #2 \rangle}\)
\( \newcommand{\Span}{\mathrm{span}}\) \( \newcommand{\AA}{\unicode[.8,0]{x212B}}\)
\( \newcommand{\vectorA}[1]{\vec{#1}} % arrow\)
\( \newcommand{\vectorAt}[1]{\vec{\text{#1}}} % arrow\)
\( \newcommand{\vectorB}[1]{\overset { \scriptstyle \rightharpoonup} {\mathbf{#1}} } \)
\( \newcommand{\vectorC}[1]{\textbf{#1}} \)
\( \newcommand{\vectorD}[1]{\overrightarrow{#1}} \)
\( \newcommand{\vectorDt}[1]{\overrightarrow{\text{#1}}} \)
\( \newcommand{\vectE}[1]{\overset{-\!-\!\rightharpoonup}{\vphantom{a}\smash{\mathbf {#1}}}} \)
\( \newcommand{\vecs}[1]{\overset { \scriptstyle \rightharpoonup} {\mathbf{#1}} } \)
\( \newcommand{\vecd}[1]{\overset{-\!-\!\rightharpoonup}{\vphantom{a}\smash {#1}}} \)
\(\newcommand{\avec}{\mathbf a}\) \(\newcommand{\bvec}{\mathbf b}\) \(\newcommand{\cvec}{\mathbf c}\) \(\newcommand{\dvec}{\mathbf d}\) \(\newcommand{\dtil}{\widetilde{\mathbf d}}\) \(\newcommand{\evec}{\mathbf e}\) \(\newcommand{\fvec}{\mathbf f}\) \(\newcommand{\nvec}{\mathbf n}\) \(\newcommand{\pvec}{\mathbf p}\) \(\newcommand{\qvec}{\mathbf q}\) \(\newcommand{\svec}{\mathbf s}\) \(\newcommand{\tvec}{\mathbf t}\) \(\newcommand{\uvec}{\mathbf u}\) \(\newcommand{\vvec}{\mathbf v}\) \(\newcommand{\wvec}{\mathbf w}\) \(\newcommand{\xvec}{\mathbf x}\) \(\newcommand{\yvec}{\mathbf y}\) \(\newcommand{\zvec}{\mathbf z}\) \(\newcommand{\rvec}{\mathbf r}\) \(\newcommand{\mvec}{\mathbf m}\) \(\newcommand{\zerovec}{\mathbf 0}\) \(\newcommand{\onevec}{\mathbf 1}\) \(\newcommand{\real}{\mathbb R}\) \(\newcommand{\twovec}[2]{\left[\begin{array}{r}#1 \\ #2 \end{array}\right]}\) \(\newcommand{\ctwovec}[2]{\left[\begin{array}{c}#1 \\ #2 \end{array}\right]}\) \(\newcommand{\threevec}[3]{\left[\begin{array}{r}#1 \\ #2 \\ #3 \end{array}\right]}\) \(\newcommand{\cthreevec}[3]{\left[\begin{array}{c}#1 \\ #2 \\ #3 \end{array}\right]}\) \(\newcommand{\fourvec}[4]{\left[\begin{array}{r}#1 \\ #2 \\ #3 \\ #4 \end{array}\right]}\) \(\newcommand{\cfourvec}[4]{\left[\begin{array}{c}#1 \\ #2 \\ #3 \\ #4 \end{array}\right]}\) \(\newcommand{\fivevec}[5]{\left[\begin{array}{r}#1 \\ #2 \\ #3 \\ #4 \\ #5 \\ \end{array}\right]}\) \(\newcommand{\cfivevec}[5]{\left[\begin{array}{c}#1 \\ #2 \\ #3 \\ #4 \\ #5 \\ \end{array}\right]}\) \(\newcommand{\mattwo}[4]{\left[\begin{array}{rr}#1 \amp #2 \\ #3 \amp #4 \\ \end{array}\right]}\) \(\newcommand{\laspan}[1]{\text{Span}\{#1\}}\) \(\newcommand{\bcal}{\cal B}\) \(\newcommand{\ccal}{\cal C}\) \(\newcommand{\scal}{\cal S}\) \(\newcommand{\wcal}{\cal W}\) \(\newcommand{\ecal}{\cal E}\) \(\newcommand{\coords}[2]{\left\{#1\right\}_{#2}}\) \(\newcommand{\gray}[1]{\color{gray}{#1}}\) \(\newcommand{\lgray}[1]{\color{lightgray}{#1}}\) \(\newcommand{\rank}{\operatorname{rank}}\) \(\newcommand{\row}{\text{Row}}\) \(\newcommand{\col}{\text{Col}}\) \(\renewcommand{\row}{\text{Row}}\) \(\newcommand{\nul}{\text{Nul}}\) \(\newcommand{\var}{\text{Var}}\) \(\newcommand{\corr}{\text{corr}}\) \(\newcommand{\len}[1]{\left|#1\right|}\) \(\newcommand{\bbar}{\overline{\bvec}}\) \(\newcommand{\bhat}{\widehat{\bvec}}\) \(\newcommand{\bperp}{\bvec^\perp}\) \(\newcommand{\xhat}{\widehat{\xvec}}\) \(\newcommand{\vhat}{\widehat{\vvec}}\) \(\newcommand{\uhat}{\widehat{\uvec}}\) \(\newcommand{\what}{\widehat{\wvec}}\) \(\newcommand{\Sighat}{\widehat{\Sigma}}\) \(\newcommand{\lt}{<}\) \(\newcommand{\gt}{>}\) \(\newcommand{\amp}{&}\) \(\definecolor{fillinmathshade}{gray}{0.9}\)Once surface water infiltrates below the surface of the soil and keeps on moving downward by percolation, it has become groundwater. At this point we have to deal with the physics of groundwater movement. This comes under a branch of fluid dynamics known as flow through porous media. The essential features of flow through porous media are in common with flow in pipes and channels, (Chapter 1), but certain aspects are distinctive to groundwater flow.
I’ll say some things about the basic nature of groundwater movement by means of another rewarding home experiment (Figure 4-6). This one is quite simple to do and would be easy and inexpensive to set up in just a short time in your basement or in your backyard. For this experiment you will need to have a large vessel, open at the top, that will hold water without too many leaks. You could nail something together out of wood and make it leak-proof with a caulking gun, or you could borrow or buy a 55 gallon metal drum. A large plastic rubbish barrel would be good also. Mount the barrel on a stand above the floor or the ground, and attach a horizontal pipe to the wall of the vessel just above the bottom. Don’t worry too much about the practical problem of how to attach the pipe to the barrel in a way that’s leak-proof or nearly so. Tack a piece of fine metal screening over the entrance to the pipe as it leaves the barrel. From the downstream end of the pipe, stuff the pipe full of some natural granular material like the soil in your garden or the sand in your sandbox. When the pipe is full, attach another piece of fine metal screening to the downstream end of the pipe.
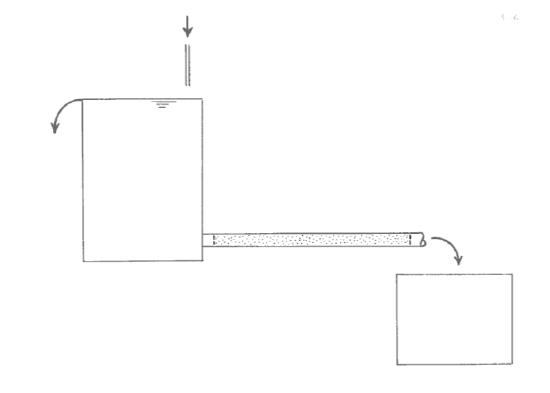
Run your garden hose into the vessel until water overflows, and then leave it running during the experiment to ensure a constant level of water in the vessel. What you want to do is measure the discharge (that is, the volume rate of flow) of water through the porous medium and out the downstream end of the pipe. You can easily measure this by using a catch tub at the downstream end of the pipe and measuring the volume of water caught in the catch tub with a measuring cup and measuring the time of flow with a stopwatch.
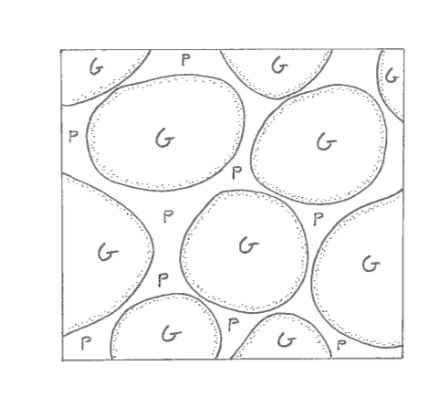
Think now about the nature of the porous granular medium in the pipe: it consists of an enormous number of little solid particles, of more or less irregular geometry, each in contact with some small number of neighboring particles. Look at some representative unit volume of the porous material. It’s made up of two different sub-volumes (Figure 4-7): solid granular material, and empty interstitial spaces, which might be called void spaces or pore spaces. Before you start the experiment, these pore spaces are filled with air. One of the important physical properties of the porous medium is the porosity, defined as the volume of pore spaces divided by the bulk volume of the material. Loose sands or gravels typically have porosities of something like 20–30%, depending mainly on the size distribution of the material: a well sorted granular material has a larger porosity, other things being equal, than a poorly sorted granular material.
What I want you to study in your experiment is the discharge of water through the pipe as a function of the height of water in the vessel. You can easily vary the height of the water in the barrel by cutting holes in the side of the vessel so that the excess water runs out of the vessel at different levels above the entrance to the pipe.
Before we discuss the results of this experiment, let’s think about the nature of flow through the porous medium in the pipe. You can’t easily observe that flow, because even if you made the pipe out of a transparent material like glass or acrylic plastic you would still have a hard time observing the details of flow among the grains. But you could imagine shrinking yourself down to microscopic size and taking a submarine trip through the porous medium by drifting along with the flow.
The flow through the porous medium is like flow through a large number of tiny pipes with very irregular geometry, branching and rejoining, which narrow as they pass around grains and widen as they pass between grains. The narrow, constricted places among grains are called pore throats. Although the patterns of flow are very complicated in detail, the essential nature of the flow is not greatly different from the flow through a pipe; it’s just that the “pipe” is now narrow, tortuous (with lots of twists and turns, that is), and very intricate geometrically.
The question now arises: Is the flow through the porous medium laminar or turbulent? In laminar flow, the fluid moves along in regular straight paths, without mixing sideways. When you pour a stiff (that is, very viscous) liquid like oil or paint, you are observing laminar flow. Flow of water or air at all but the slowest speeds, however, is turbulent. By putting little floating tracers in the flow you can observe how flow paths are sinuous and irregular. An even better way to observe turbulence is to watch smoke as it rises from a chimney or smokestack: you can see the irregular swirls, called turbulent eddies. Go back to Chapter 1 for more details on laminar and turbulent flow.
Whether a flow of fluid is laminar or turbulent depends on four factors: the speed of the flow, the depth or width of the flow, and the density and viscosity of the fluid that’s flowing. The deeper and faster the flow, and the greater the fluid density and the smaller the fluid viscosity, the more likely the flow is to be turbulent. In the case of flow through the porous medium in the pipe, the passageways are very small, and the flow velocity is in almost all cases rather small, so you should expect that flow in porous media is laminar rather than turbulent, except in unusual situations where the passageways are very large and the velocities are very great, as for example in very coarse open gravels, or in certain kinds of basalt flows with large connected tunnels or passageways, or in solution tunnels in limestones (Figure 4-8).
What drives the flow through the sand-filled pipe is the downstream pressure gradient (that is, the rate of decrease of fluid pressure with downstream distance in the pipe). That’s the same thing that causes the water to flow out through your home piping system! It should make good sense to you that the speed of flow through the porous medium in the pipe depends upon the pressure gradient: the greater the pressure gradient (the driving force that causes the flow), the greater the speed of flow. But you should expect two other factors to affect the speed of flow as well: the size of the solid particles of the porous medium, and the viscosity of the fluid. The particle size is important because larger particles mean wider the pore throats, and therefore less frictional resistance to flow, because the friction arises from contact of the fluid with solid surfaces. (Go back to Chapter 2 and review how the ratio of surface area to volume increases with decreasing particle size.) The viscosity of the fluid is a measure of the resistance of the fluid to a deforming force: the greater the viscosity, the more difficult it is to make the fluid flow—as all of you know from trying to make the honey flow out of the bottle, compared to water.
Advanced Topic: Mathematical Analysis of Flow Through A Porous Medium
It should make sense to you that there must be some mathematical relationship between the various physical quantities involved in the flow described in the preceding paragraphs: the average speed of flow V in the pipe, the pressure gradient G, which drives the flow through the pipe, the grain size D of the particles that constitute the porous medium, and the viscosity μ of the fluid flowing through the porous medium. Provided that the flow is sufficiently slow, the accelerations of the fluid as it flows through the little passageways are very small, so we can neglect the inertial properties of the flow as embodied in the density ρ. So some function of V, G, D, and μ has to be equal to a constant:
\[f (V, G, D, μ) = const_1 \label{2}\]
Because the right side of Equation \ref{2} is a constant number and has no physical dimensions, the variable or variables involved in the left side of the equation have to be dimensionless as well. You can easily demonstrate for yourself that the mass, length, and time dimensions of the quantity GD2/Vμ all cancel out, so it’s a dimensionless quantity. So the functional relationship has to look like this:
\[\frac{G D^{2}}{V \mu}=\text { const }_{1} \label{3}\]
You can easily rearrange Equation \ref{3} to show that the velocity \(V\) of flow through the porous medium is linearly related to the quantity GD2/μ:
\[V=\text { const }_{2} \cdot \frac{G D^{2}}{\mu} \label{4}\]
(where const2 is just the inverse of const1). The value of const1 (or const2) depends on the shape and packing of the particles in the pipe.
If now you made a number of runs with different water levels in your supply tank, you’d get a graph of the results that looks like Figure 4-9: you’d see a linear relationship between the velocity V and the quantity GD2/μ. (How do you measure G and V, you might be thinking. Well, G is just the difference between the pressure at the upstream end of the pipe, which by the hydrostatic equation is just ρgh, where h is the height of the pipe entrance below the water surface, and the pressure at the downstream end of the pipe, which is the same as the atmospheric pressure, divided by the length of the pipe. And V is equal to the discharge divided by the cross-sectional area of the pipe.) Experiments like this have been done many times, and they show that there’s a function like this for all porous media. But you should expect that the value of the constant is different for different porous media, because of the differences in particle shape and packing geometry.
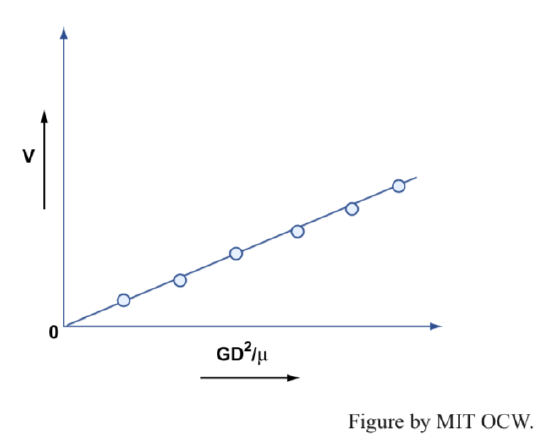
4. Incidentally, the fact that you indeed find a linear relationship in your experiment shows you that we were correct in our assumption that the flow in the porous medium is laminar and that the density can therefore be neglected.
5. The results of the barrel experiment are a manifestation of a well-known law in the flow of porous media called Darcy’s law. Darcy’s law states that the flow speed through a porous medium is directly proportional to the pressure gradient through that medium, and directly proportional to the square of the characteristic size of the pore spaces of the medium, and inversely proportional to the viscosity of the medium.
What’s usually done with Equation 4 is to absorb the D2 into the constant:

The constant const3 depends on the size distribution of the porous medium as well as on the particle shape and packing. It’s called the intrinsic permeability of the porous medium, and it’s usually denoted by small k. (It’s misleading to call this quantity a constant. It’s constant only for the particular porous medium we used in our home experiment! Each porous medium has its own value of intrinsic permeability.)
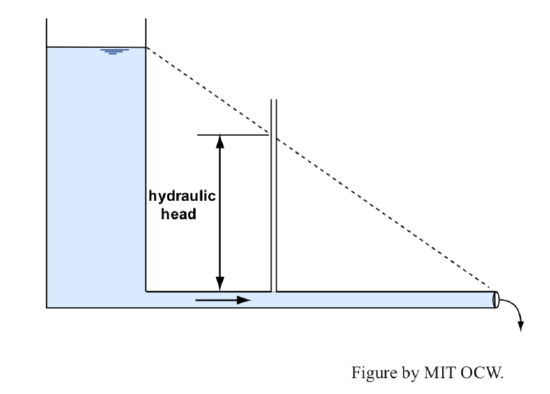
6. One final massaging of the relationship that started out as Equation 3 leads to another measure of permeability, called the hydraulic conductivity, which is more commonly used in dealing specifically with groundwater flow. You have to make use of the concept of the hydraulic head, which is the level to which a column of water would rise if a tiny test column is inserted anywhere in the flow system (Figure 4-10). This height h is related to the pressure p in the liquid by the hydrostatic equation,

where γ is the weight per unit volume of the liquid. Remember that the pressure gradient G in Equation 3 should really be written Δp/Δx, where x is the direction down the pipe. Substitution of the expression for p in Equation 6 into Δh/Δx gives γ Δh/Δx, and substituting this resulting quantity into Equation 5 gives

where const3(γ/μ) is the hydraulic conductivity. The hydraulic conductivity is usually denoted by capital K. You can easily see for yourself that the dimensions of K are velocity, because Δh/Δx is a ratio of length variables, and therefore dimensionless; values of K are commonly cited in meters per day.
What you would find, when you run the barrel experiment, is that the flow speed is directly proportional to the pressure gradient, and directly proportional to the size of the particles of the porous medium, and inversely proportional to the viscosity of the medium. This result is a manifestation of a well-known law in the flow of porous media called Darcy’s law. See the “advanced topic” above for details, if you are interested.
How the speed of flow depends on the pressure gradient, the particle size, and the fluid viscosity in this way is a reflection of a physical property of the medium that is known as the permeability of the medium. In a qualitative sense, the permeability is a measure of how easy it is to force fluid through the porous medium by imposing a pressure gradient. The permeability is related to the porosity (the permeability can’t be very high unless there is substantial porosity), but it’s not the same as the porosity. In fact, it’s possible for the medium to have a high porosity but a low permeability, if the pore spaces are not sufficiently well connected; hence the concept of connected porosity. The permeability of the medium is of great importance for groundwater studies, and it is also very important in the petroleum industry: you can’t pump oil and gas out of deep sedimentary rock unless the both the porosity and the permeability are sufficiently great.
The home experiment on flow through a porous medium is realistic in all respects but one important one: the direction of flow is constrained to be straight down the pipe. That’s not necessarily relevant to flow within a large volume of porous medium, as in the subsurface of the Earth. The critical question here is: What determines the particular direction of groundwater flow within a large volume of a porous medium? I can’t pursue that question in any detail here, because it depends in a complex way on the dynamics of the water flow. There will be a bit more on this matter later in the chapter. If you would like to get some further insight into the patterns of flow, look into the following “advanced topic”.
Advanced Topic: What Controls the Pattern of Flow of a Fluid
1. Think about the pressure of the water in some large tank like the supply tank for your home experiment when the water isn’t moving. Think about a little unit area at the bottom of the tank. The pressure of the water at the bottom of the tank is equal to the weight per unit area of the water in the column overlying that small unit area, times the height of the column of water above that unit area. If the weight of the water per unit volume is γ and the depth to the bottom of the tank is h, then the pressure p at bottom of the tank is just γh. And by extension of that argument, the pressure of the water at any depth h within the tank is also equal to γ times that depth h. This water pressure in still water is called the hydrostatic pressure.
2. The hydrostatic pressure within the still water in the tank is a manifestation of a balance between the weight of the water overlying a given point, which acts vertically downward, and the pressure gradient at that point, which acts vertically upward. So although there’s a gradient of pressure in the tank, the water doesn’t move, because that pressure gradient is offset by an equal and opposite force, namely the weight of the water.
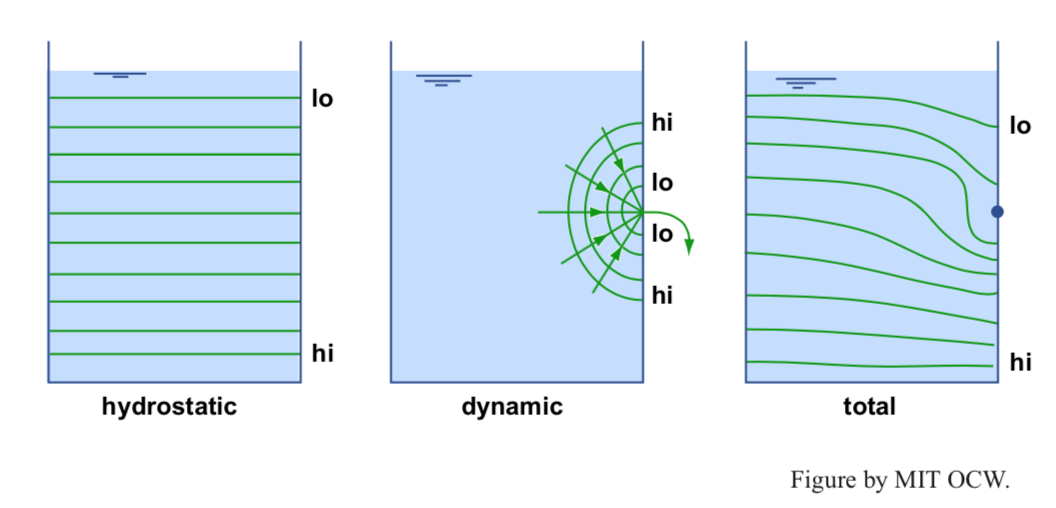
3. Now suppose you took your ice pick (does anybody still have an ice pick?) and poked a hole in the side of the supply tank. Water would squirt out of the hole. In the interior of the tank in the vicinity of the hole the water is now in motion toward the hole. What you’ve done is impose a low pressure (namely, the atmospheric pressure) on the water at the hole, just the same as at the upper surface of the water in the tank. In doing so, you have disrupted the previously hydrostatic distribution of pressure near the hole-to-be and caused non-hydrostatic pressure gradients in the water near the hole—that is, pressure gradients that are no longer balanced by the weight of the water. That’s the mechanical reason why the water flows from the tank!
4. The exact distribution of pressure in the vicinity of the hole and the resulting patterns of water motion are much too complicated for us to deal with here, but this example suggests that the direction of water movement at any point is in the direction in which the difference between total pressure and hydrostatic pressure (a quantity called the dynamic pressure) decreases most rapidly. It’s differences in this dynamic pressure that cause fluid in any situation to move. So you can be confident that, whenever you are dealing with groundwater flow, the flow will always be in the direction of most rapid decrease in dynamic pressure. Figure 4-11 shows qualitatively the distributions of total pressure, hydrostatic pressure, and dynamic pressure in the tank once you’ve punched the hole and the water is flowing out. Note how the flow lines are everywhere normal to the contours of dynamic pressure.
5. Of course, the reasons for the distribution of dynamic pressure are always very complicated, and really beyond the scope of this course. Prediction of the spatial distribution of the dynamic pressure, and therefore the spatial pattern and speeds of water movement in the porous medium, are one of the major topics in the study of groundwater hydraulics. I’m not doing anything more than giving you the barest flavor of this endeavor.
I don’t know what your intuition tells you about representative speeds of flow in your home experiment as a function of the nature of the porous medium, but Table 4-1 gives some representative values for various common kinds of porous media within the Earth. The values range enormously from coarse gravel, in which speeds are of the order of centimeters per second, to solid rock (which in reality is porous because of tiny spaces at grain boundaries and other miscellaneous rock fractures), in which speeds are of the order of a thousandth of a millimeter per second. Table 1 also gives corresponding values of hydraulic conductivity K, discussed in the following paragraph.
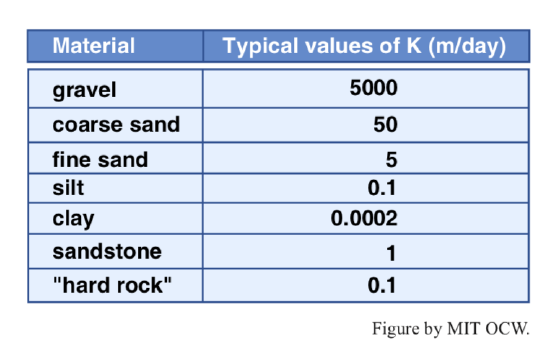
Table 4-1. Representative values of hydraulic conductivity K for various kinds of porous media.
Figure 4-12 shows a practical application of the principles we dealt with on the basis of the home experiment. There’s a sloping land surface in which the deeper bedrock is covered by a fairly uniform but perhaps rather thick layer of loose and much more permeable material. High up on the slope is a source of pollutants, and farther down the slope, ten meters let’s say, is your home or summer place, where you might have a water well. The groundwater flow is directly down the slope through the porous surficial layer at some speed that depends on the intrinsic permeability of the porous medium. If you know the slope of the ground and the intrinsic permeability of the material, you can compute the travel time of a pollutant tracer from the input point to the water well beneath your house. Assume for the sake of discussion that the slope of the ground is one in ten. The gradient in hydraulic head, Δh/Δx, within the porous medium is then 0.1. Using Equation 7 we find that V, the characteristic velocity of the groundwater, is 0.1K. Using the representative values for K given in Table 4-1 you can obtain travel times for various kinds of porous medium (Table 4-2). You can see that depending on the permeability of the medium the grace period between the time of introduction of the pollutant and the time it pollutes your water well varies enormously.
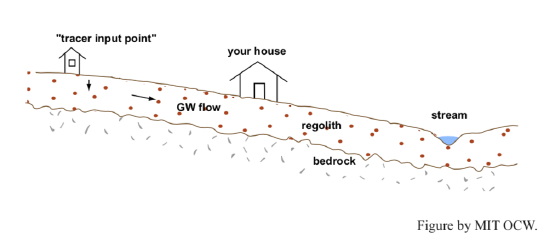
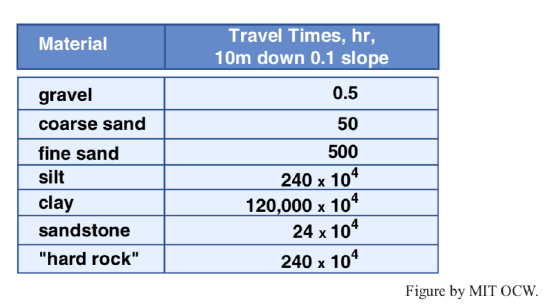
Table 4-2. Ten-meter travel times for the same kinds of porous media as in Table 4-1.
A Home Experiment on Groundwater Flow
Now it’s time to do a more realistic and ambitious experiment on the flow of groundwater (Figure 4-13). For this purpose you will need to build a very large shallow square tank in your backyard or use an entire spare room in your home. If you decide to use the spare room, you had better shore up the floor with some big timbers, because otherwise it’s likely to collapse.
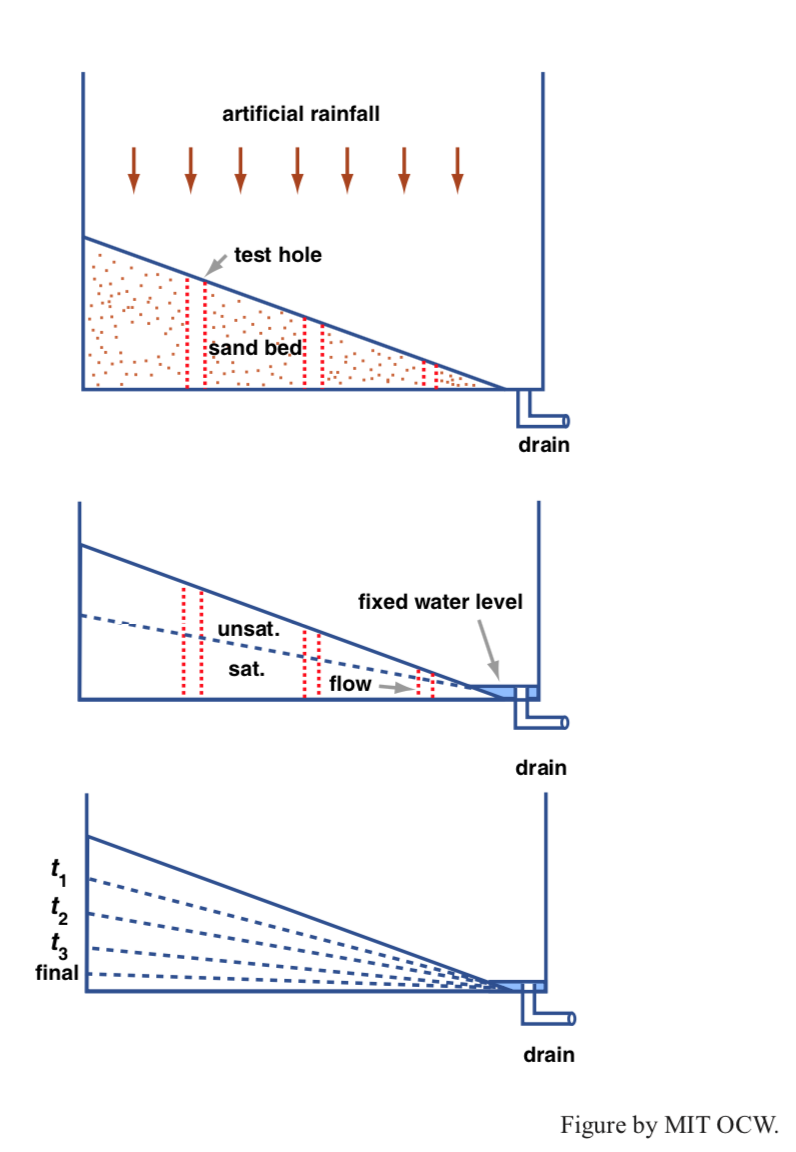
Line the tank or the room with a large new polyethylene tarpaulin tucked in neatly at the corners, and fill the space with something like a meter of sand. Taper the layer of sand so that it has maximum depth at one side and zero depth at the other side, and along that latter side provide a drain or a sump pump at one corner. Put in several test holes or wells across the space, and line the holes with window-screen cylinders so that the sand doesn’t fall into the holes. Now connect the hose to your kitchen sink and spray the sand surface to simulate a brief and heavy rainstorm.
Here’s a summary of the results you would obtain:
- There will be water in the drain, and it will flow long after the rain stops.
- There will be water in all the test holes.
- The profile connecting the water level in the test holes will show the same sense of slope as the surface of the sand; this defines the groundwater table. The water table, also called the groundwater table, is the locus of points where the water pressure is equal to the atmospheric pressure. It’s the top of the permanently saturated zone.
- The slope of the groundwater table is less than the slope of the sand surface, and it decreases with time (see the lowest part of Figure 4-13).
- The movement of groundwater is in the downslope direction, toward the drain. You can tell this by injecting food coloring in the uppermost test hole and seeing it appear in successive holes and finally at the surface, at the drain.
- If the rainfall is too heavy there will be some surface runoff down to the drain, but even in this case most of the water will infiltrate and become part of the groundwater flow.
This is a very realistic experiment in groundwater flow. The only problems with it are these:
- The scale is too small, and things happen too fast.
- The material is uniform and has a fixed and permeable floor. In real life there’s usually a gradual downward decrease in both porosity and permeability—although in glaciated areas the structure of the subsurface is often just the same as in this experiment.


