4.2: A Home Experiment on Infiltration
- Page ID
- 13469
\( \newcommand{\vecs}[1]{\overset { \scriptstyle \rightharpoonup} {\mathbf{#1}} } \)
\( \newcommand{\vecd}[1]{\overset{-\!-\!\rightharpoonup}{\vphantom{a}\smash {#1}}} \)
\( \newcommand{\id}{\mathrm{id}}\) \( \newcommand{\Span}{\mathrm{span}}\)
( \newcommand{\kernel}{\mathrm{null}\,}\) \( \newcommand{\range}{\mathrm{range}\,}\)
\( \newcommand{\RealPart}{\mathrm{Re}}\) \( \newcommand{\ImaginaryPart}{\mathrm{Im}}\)
\( \newcommand{\Argument}{\mathrm{Arg}}\) \( \newcommand{\norm}[1]{\| #1 \|}\)
\( \newcommand{\inner}[2]{\langle #1, #2 \rangle}\)
\( \newcommand{\Span}{\mathrm{span}}\)
\( \newcommand{\id}{\mathrm{id}}\)
\( \newcommand{\Span}{\mathrm{span}}\)
\( \newcommand{\kernel}{\mathrm{null}\,}\)
\( \newcommand{\range}{\mathrm{range}\,}\)
\( \newcommand{\RealPart}{\mathrm{Re}}\)
\( \newcommand{\ImaginaryPart}{\mathrm{Im}}\)
\( \newcommand{\Argument}{\mathrm{Arg}}\)
\( \newcommand{\norm}[1]{\| #1 \|}\)
\( \newcommand{\inner}[2]{\langle #1, #2 \rangle}\)
\( \newcommand{\Span}{\mathrm{span}}\) \( \newcommand{\AA}{\unicode[.8,0]{x212B}}\)
\( \newcommand{\vectorA}[1]{\vec{#1}} % arrow\)
\( \newcommand{\vectorAt}[1]{\vec{\text{#1}}} % arrow\)
\( \newcommand{\vectorB}[1]{\overset { \scriptstyle \rightharpoonup} {\mathbf{#1}} } \)
\( \newcommand{\vectorC}[1]{\textbf{#1}} \)
\( \newcommand{\vectorD}[1]{\overrightarrow{#1}} \)
\( \newcommand{\vectorDt}[1]{\overrightarrow{\text{#1}}} \)
\( \newcommand{\vectE}[1]{\overset{-\!-\!\rightharpoonup}{\vphantom{a}\smash{\mathbf {#1}}}} \)
\( \newcommand{\vecs}[1]{\overset { \scriptstyle \rightharpoonup} {\mathbf{#1}} } \)
\( \newcommand{\vecd}[1]{\overset{-\!-\!\rightharpoonup}{\vphantom{a}\smash {#1}}} \)
\(\newcommand{\avec}{\mathbf a}\) \(\newcommand{\bvec}{\mathbf b}\) \(\newcommand{\cvec}{\mathbf c}\) \(\newcommand{\dvec}{\mathbf d}\) \(\newcommand{\dtil}{\widetilde{\mathbf d}}\) \(\newcommand{\evec}{\mathbf e}\) \(\newcommand{\fvec}{\mathbf f}\) \(\newcommand{\nvec}{\mathbf n}\) \(\newcommand{\pvec}{\mathbf p}\) \(\newcommand{\qvec}{\mathbf q}\) \(\newcommand{\svec}{\mathbf s}\) \(\newcommand{\tvec}{\mathbf t}\) \(\newcommand{\uvec}{\mathbf u}\) \(\newcommand{\vvec}{\mathbf v}\) \(\newcommand{\wvec}{\mathbf w}\) \(\newcommand{\xvec}{\mathbf x}\) \(\newcommand{\yvec}{\mathbf y}\) \(\newcommand{\zvec}{\mathbf z}\) \(\newcommand{\rvec}{\mathbf r}\) \(\newcommand{\mvec}{\mathbf m}\) \(\newcommand{\zerovec}{\mathbf 0}\) \(\newcommand{\onevec}{\mathbf 1}\) \(\newcommand{\real}{\mathbb R}\) \(\newcommand{\twovec}[2]{\left[\begin{array}{r}#1 \\ #2 \end{array}\right]}\) \(\newcommand{\ctwovec}[2]{\left[\begin{array}{c}#1 \\ #2 \end{array}\right]}\) \(\newcommand{\threevec}[3]{\left[\begin{array}{r}#1 \\ #2 \\ #3 \end{array}\right]}\) \(\newcommand{\cthreevec}[3]{\left[\begin{array}{c}#1 \\ #2 \\ #3 \end{array}\right]}\) \(\newcommand{\fourvec}[4]{\left[\begin{array}{r}#1 \\ #2 \\ #3 \\ #4 \end{array}\right]}\) \(\newcommand{\cfourvec}[4]{\left[\begin{array}{c}#1 \\ #2 \\ #3 \\ #4 \end{array}\right]}\) \(\newcommand{\fivevec}[5]{\left[\begin{array}{r}#1 \\ #2 \\ #3 \\ #4 \\ #5 \\ \end{array}\right]}\) \(\newcommand{\cfivevec}[5]{\left[\begin{array}{c}#1 \\ #2 \\ #3 \\ #4 \\ #5 \\ \end{array}\right]}\) \(\newcommand{\mattwo}[4]{\left[\begin{array}{rr}#1 \amp #2 \\ #3 \amp #4 \\ \end{array}\right]}\) \(\newcommand{\laspan}[1]{\text{Span}\{#1\}}\) \(\newcommand{\bcal}{\cal B}\) \(\newcommand{\ccal}{\cal C}\) \(\newcommand{\scal}{\cal S}\) \(\newcommand{\wcal}{\cal W}\) \(\newcommand{\ecal}{\cal E}\) \(\newcommand{\coords}[2]{\left\{#1\right\}_{#2}}\) \(\newcommand{\gray}[1]{\color{gray}{#1}}\) \(\newcommand{\lgray}[1]{\color{lightgray}{#1}}\) \(\newcommand{\rank}{\operatorname{rank}}\) \(\newcommand{\row}{\text{Row}}\) \(\newcommand{\col}{\text{Col}}\) \(\renewcommand{\row}{\text{Row}}\) \(\newcommand{\nul}{\text{Nul}}\) \(\newcommand{\var}{\text{Var}}\) \(\newcommand{\corr}{\text{corr}}\) \(\newcommand{\len}[1]{\left|#1\right|}\) \(\newcommand{\bbar}{\overline{\bvec}}\) \(\newcommand{\bhat}{\widehat{\bvec}}\) \(\newcommand{\bperp}{\bvec^\perp}\) \(\newcommand{\xhat}{\widehat{\xvec}}\) \(\newcommand{\vhat}{\widehat{\vvec}}\) \(\newcommand{\uhat}{\widehat{\uvec}}\) \(\newcommand{\what}{\widehat{\wvec}}\) \(\newcommand{\Sighat}{\widehat{\Sigma}}\) \(\newcommand{\lt}{<}\) \(\newcommand{\gt}{>}\) \(\newcommand{\amp}{&}\) \(\definecolor{fillinmathshade}{gray}{0.9}\)Experiment on Infiltration
Here’s a home experiment that would not be difficult for you to do if you are a home gardener. It’s a very realistic experiment on the controls on infiltration rate and infiltration capacity.
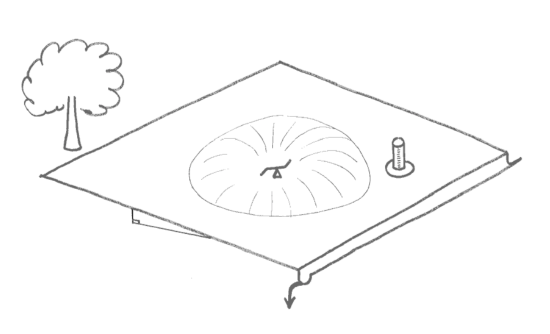
Set up an adjustable-rate lawn sprinkler on a very gently sloping and freshly spaded and raked plot in your garden (Figure 4-1). Measure the “precipitation” from the lawn sprinkler with a little rain gauge, and measure the surface runoff directly by collecting it or catching it at the downslope edge of the plot. You can compute the infiltration rate indirectly by the equation
\[S=P-I (1)\]
where \(S\) is surface runoff, \(P\) is precipitation rate, and \(I\) is infiltration rate. You have to express \(S\) in units that are the same as \(I\) and \(P\): depth of water per unit area per unit time. You can easily spot the point of nonzero \(S\) when you’re watering your garden: water stands on the soil surface as a thin, smooth sheet instead of soaking in immediately.
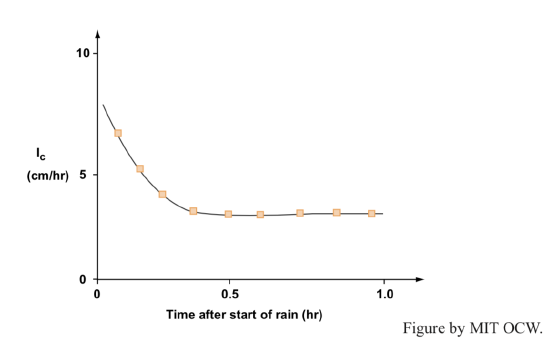
But there’s a little more to it than this. Figure 4-2 is a typical plot of infiltration capacity Ic against time, for a given soil. There’s a rapid decrease from very high Ic in the first few minutes, but then it levels off to a steady value. (It’s hard to measure Ic at the very beginning.) Why the initial decrease?
- Some soil particles, like clay or organics, have a tendency to swell when they come in contact with liquid water, and this tends to close off the pore spaces. And your intuition should tell you that the smaller the passageways, the more difficult it is to push water through them.
- The impact of raindrops pulverizes the soil structure at the surface and washes fine particles into the uppermost pore spaces, producing a kind of "micro- armor".
How is the infiltration capacity measured?
- With an infiltrometer: a tube about one foot in diameter, driven about one foot into the soil. You maintain the water level in the tube at some height above the ground surface, and you measure the rate of input of new water needed to replenish the water lost to infiltration. The advantages of this arrangement are that it’s inexpensive and easy to use; the disadvantage is that it disturbs the soil.
- With a sprinkler on an experimental plot, as in the home experiment above. The advantage of this is that it’s accurate, realistic, and non-disruptive, but the disadvantage is that it’s expensive and time-consuming, and you can’t do it very well on irregular ground.
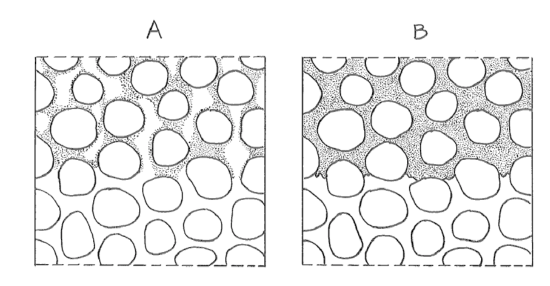
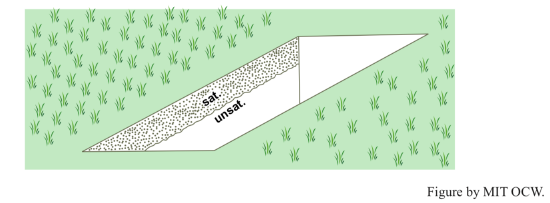
What is going on, physically, during infiltration and percolation? It's simple: a raindrop falls on the granular surface and then drains down through the interconnected pores of the soil by the pull of gravity. The passageways are diverse: they might be intergranular interstices, animal burrows, shrinkage cracks, or rotted rootways. If the precipitation rate is less than the infiltration capacity (P < Ic), then some of the pores are occupied by downward-draining water but others are occupied by air (Figure 4-3A). If the precipitation rate is greater than the infiltration capacity (P > Ic), then all of the pores are occupied by downward-draining water (Figure 4-3B). In both cases the downward-moving layer of water is marked by a blurred but recognizable front or lower boundary. You can see this nicely for yourself by excavating and examining a little vertical wall of soil in your garden after a heavy brief shower or a longer rain after a dry spell (Figure 4-4). After the rain stops, the infiltrated water keeps descending as a coherent layer.
You perform an experiment like this every time you water your house plants! Take a pot with established soil structure, dry it to total dryness in the oven, weigh it, and then water it very fast, to simulate the condition that P is greater than Ic. As the leading or lower boundary of the percolating layer passes the bottom of the pot, water starts pouring out onto the floor. Then, as the trailing boundary of the percolating layer passes, water stops coming out of the bottom of the pot rather abruptly. Now weigh the pot again, and convert the difference between final weight and initial weight to volume of water per unit bulk volume of the soil. This quantity is call the field capacity of the soil: the maximum concentration of soil water that can be held by the soil against the pull of gravity. The field capacity is substantially greater than zero in most soils. It’s much smaller, but still nonzero, even in very coarse gravel soils.
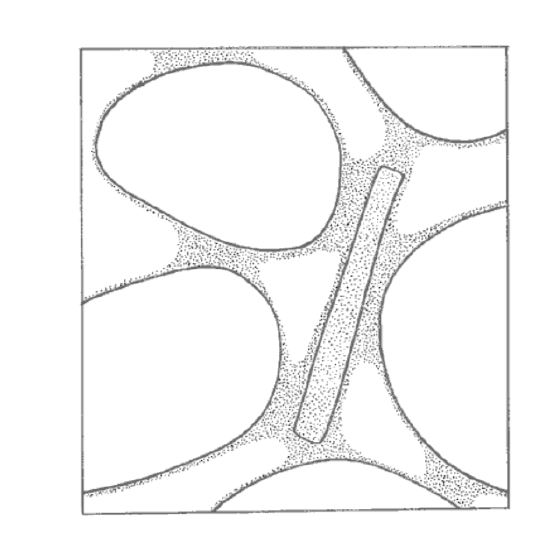
The water that remains in the soil after initial drainage is called soil moisture. The water that constitutes this soil moisture is located in several kinds of places in the soil (Figure 4-5):
- as thin films on all particles
- as fillets at points of grain contact
- suffusing porous organic matter
Soil moisture makes up a very small percentage of freshwater, but it’s of critical importance for life on the Earth’s surface, because it’s what plants use. Plants pull water out of the soil and transpire it, until the remaining soil moisture is held so tightly that plants can’t take it up, and then they wilt. This level of moisture is called the wilting point. The soil moisture is depleted in two other important ways as well:
- slow residual drainage downward
- evaporation at the surface, after upward diffusion as water vapor through the soil or by capillary rise as a liquid through the soil
Background: Surface Tension and Capillarity
Inside a liquid like water, each molecule is attracted by molecules all around it. A molecule at the surface of the liquid, however, is attracted by molecules below it and beside it but not above it, because none are there. The net effect of that asymmetry of forces is that the surface water molecules attract one another in the plane of the surface, and the result is analogous to the tensile force in a thin sheet of stretched rubber. That’s why the effect is called surface tension. It’s as if the surface wants to “pull itself together”. It’s for that reason that globules of water, and soap bubbles as well, try to take on the shape of a sphere.
Now think about a small mass of water resting on a solid surface. If the attraction between the water molecules is greater than the force of attraction between the water molecules and the atoms or molecules of the solid, then the mass of water “balls up” on the surface. We say that the liquid does not wet the solid surface. If the force of attraction between the water molecules is less than the attraction between the water molecules and the atoms or molecules of the solid surface, then the liquid spreads out as a uniform thin film. We say that the liquid wets the surface.
If you put a hollow tube with a very small diameter into a liquid that wets the surface of the solid of which the tube is composed, the liquid rises up in the tube, above the liquid level outside the tube, because of the tendency for the liquid to spread itself upward onto the solid surface. The effect is called capillarity or capillary rise.
The smaller the diameter of the tube, the higher the capillary rise in the tube. That’s because the height of capillary rise is the outcome of two competing effects: the upward force of capillarity, and the downward force of gravity. The surface area within the tube goes as the square of the diameter, whereas the perimeter of the tube goes as the first power of the diameter. Because the capillary rise depends on the perimeter but the downward gravity force depends on the cross-sectional area, the smaller the tube, the greater the upward capillary force relative to the downward gravity force.
You may had noticed that in such a situation the water surface inside the tube is concave upward, with the level higher at the wall of the tube than in the middle of the tube. That curved surface is called a meniscus.


