
1.4: Mapping Technology
- Page ID
- 20747
Geographic Grid Systems
The earth has 360 degrees, and they are measured using a grid pattern called the graticule. Lines of latitude and longitude allow any absolute location on the planet to have an identifiable address of degrees north or south and east or west, which will enable geographers to locate, measure, and study spatial activity accurately.
Geographers and cartographers organize locations on the earth using a series of imaginary lines that encircle the globe. The two primary lines are the equator and the prime meridian. The systems of longitude and latitude are formed from these lines, allowing users to locate themselves anywhere on the planet. The line is the longest when one travels along in an east-west direction. At the equator, the sun is directly overhead at noon on the two equinoxes, which occur in March and September.

Latitude and Parallels
The equator is the largest circle of latitude on Earth. The equator divides the earth into the Northern and Southern Hemispheres and is called 0 degrees latitude. The other lines of latitude are numbered from 0 to 90 degrees, going toward each of the poles. The lines north of the equator toward the North Pole are north latitude, and each of the numbers is followed by the letter “N.” The lines south of the equator toward the South Pole are south latitude, and the letter “S follows each of the numbers.” The equator (0 latitude) is the only line of latitude without any letter following the number. Notice that all lines of latitude are parallel to the equator (they are often called parallels) and that the North Pole equals 90 degrees N, and the South Pole equals 90 degrees S. Noted parallels include both the Tropic of Cancer and the Tropic of Capricorn, which are 23.5 degrees from the equator. At 66.5 degrees from the equator are the Arctic Circle and the Antarctic Circle near the North and South Pole, respectively. The following are the essential parallel lines:
- Equator, 0 degrees
- Tropic of Cancer, 23.5 degrees north
- Tropic of Capricorn, 23.5 degrees south
- Arctic Circle, 66.5 degrees north
- Antarctic Circle, 66.5 degrees south
- North Pole, 90 degrees north (infinitely small circle)
- South Pole, 90 degrees south (infinitely small circle)
Longitude and Meridians
The prime meridian sits at 0 degrees longitude and divides the earth into the Eastern and Western Hemispheres. The prime meridian is defined as an imaginary line that runs through the Royal Observatory in Greenwich, England, a suburb of London. The Eastern Hemisphere includes the continents of Europe, Asia, and Australia, while the Western Hemisphere includes North and South America. All meridians (lines of longitude) east of the prime meridian (0 and 180) are numbered from 1 to 180 degrees east (E); the lines west of the prime meridian (0 and 180) are numbered from 1 to 180 degrees west (W). The 0 and 180 lines do not have a letter attached to them. The meridian at 180 degrees is called the International Date Line. The International Date Line (180 degrees longitude) is opposite the prime meridian and indicates the start of each day (Monday, Tuesday, etc.). Each day officially starts at 12:01 a.m., at the International Date Line. Do not confuse the International Date Line with the prime meridian (0 longitude). The actual International Date Line does not follow the 180-degree meridian exactly. Several alterations have been made to the International Date Line to accommodate political agreements to include an island or country on one side of the line or another. Latitude is also sometimes described as zones of latitude. Some of these zones of latitude include:
- Low latitude – generally between the equator and 30 degrees north
- Midlatitude – between 30 degrees and 60 degrees north and south
- High latitude – latitudes greater than about 60 degrees north and south
- Equatorial – within a few degrees of the equator
- Tropical – within the tropics (between 23.5 degrees north and 23.5 degrees south
- Subtropical – slightly pole-ward of the tropics, generally around 25-30 degrees north and south
- Polar – within a few degrees of the North Pole or South Pole

A YouTube element has been excluded from this version of the text. You can view it online here: https://slcc.pressbooks.pub/physicalgeography/?p=41
Great and Small Circles

Much of Earth’s grid system is based on the location of the North Pole, South Pole, and the Equator. The poles are an imaginary line running from the axis of Earth’s rotation. The plane of the equator is an imaginary horizontal line that cuts the earth into two halves. This brings up the topic of great and small circles. A great circle is any circle that divides the earth into a circumference of two halves. It is also the largest circle that can be drawn on a sphere. The line connecting any points along a great circle is also the shortest distance between those two points. Examples of great circles include the Equator, all lines of longitude, the line that divides the earth into day and night called the circle of illumination, and the ecliptic plane, which divides the earth into equal halves along the equator. Small circles are circles that cut the earth, but not into equal halves. Examples of small circles include all latitude lines except the equator, the Tropical of Cancer, Tropic of Capricorn, the Arctic Circle, and Antarctic Circle.
Climate and Latitude

The earth is tilted on its axis 23.5 degrees. As it rotates around the sun, the tilt of the earth’s axis provides different climatic seasons because of the variations in the angle of direct sunlight on the planet. Places receiving more direct sunlight experience a warmer climate. Elsewhere, the increased angle of incoming solar radiation near the earth’s poles results in more reflected sunlight and a colder climate. The Northern Hemisphere experiences winter when sunlight is reflected off the earth’s surface, and less of the sun’s energy is absorbed from the sun’s sharper angle.
Time Zones
Universal Time (UT), Coordinated Universal Time (UTC), Greenwich Mean Time (GMT), or Zulu Time (Z): all four terms can be defined as the local time at 0 degrees longitude, which is the prime meridian (location of Greenwich, England). This is the same time under which many military operations, international radio broadcasts, and air traffic control systems operate worldwide. UTC is set in zero- to twenty-four-hour time periods, as opposed to two twelve-hour periods (a.m. and p.m.). The designations of a.m. and p.m. are relative to the central meridian: a.m. refers to ante meridiem, or “before noon,” and p.m. refers to post meridiem, or “after-noon.” UT, UTC, GMT, and Z all refer to the same twenty-four-hour time system that assists in unifying a standard time regarding global operations. For example, all air flights use the twenty-four-hour time system so the pilots can coordinate flights across time zones and around the world.
The earth rotates on its axis once every twenty-four hours at the rate of 15 degrees per hour (15 × 24 = 360). Time zones are established roughly every 15 degrees longitude so that local times correspond to similar hours of day and night. With this system, the sun is generally overhead at noon in every time zone that follows the 15-degree-wide system. The twenty-four times zones are based on the prime meridian regarding Universal Coordinated Time (UTC), Greenwich Mean Time (GMT), or Zulu Time (Z), which all operate on the twenty-four-hour time clock. Local time zones are either plus or minus determined by the distance from the prime meridian.
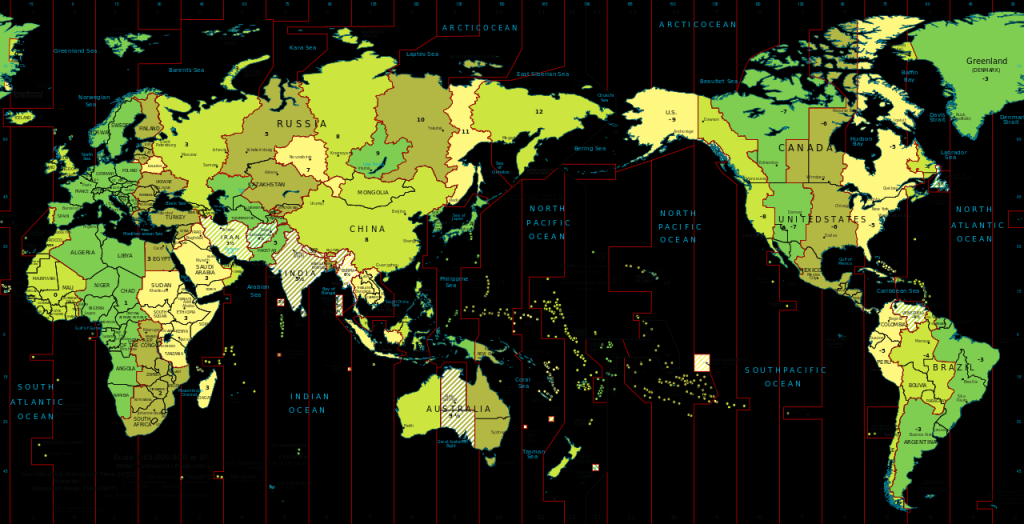
The 15-degree time zone problem is that the zones do not necessarily follow state, regional, or local boundaries. The result is that time zones are seldom precisely 15 degrees wide and usually have various boundary lines. In the United States, the boundaries between the different time zones are inconsistent with the lines of longitude; in some cases, time zones zigzag to follow state lines or to keep cities within a single time zone. Other countries address the problem differently. China, for example, is a significant inland area as the United States yet operates on only one time zone for the entire country.

A YouTube element has been excluded from this version of the text. You can view it online here: https://slcc.pressbooks.pub/physicalgeography/?p=41
Coordinate Systems
Just as all maps have a map scale, all maps have locations, too. Coordinate systems are frameworks that are used to define unique positions. For instance, in geometry, we use x (horizontal) and y (vertical) coordinates to define points on a two-dimensional plane. The coordinate system that is most commonly used to define locations on the three-dimensional earth is called the geographic coordinate system (GCS), and it is based on a sphere or spheroid. A spheroid (a.k.a. ellipsoid) is simply a sphere that is slightly wider than it is tall and approximates more closely the actual shape of the earth. Spheres are commonly used as models of the earth for simplicity.
The unit of measure in the GCS is degrees, and their respective latitude and longitude define locations within the GCS. Latitude is measured relative to the equator at zero degrees, with maxima of either ninety degrees north at the North Pole or ninety degrees south at the South Pole. Longitude is measured relative to the prime meridian at zero degrees, with maxima of 180 degrees west or 180 degrees east.
Note that latitude and longitude can be expressed in degrees-minutes-seconds (DMS) or decimal degrees (DD). When using decimal degrees, latitudes above the equator and longitudes east of the prime meridian are positive, and latitudes below the equator and longitudes west of the prime meridian are negative (see the following table for examples).
Converting from DMS to DD is a relatively straightforward exercise. For example, since there are sixty minutes in one degree, we can convert 118° 15 minutes to 118.25 (118 + 15/60). Note that an online search of the term “coordinate conversion” will return several coordinate conversion tools.
When we want to map things like mountains, rivers, streets, and buildings, we need to define how the lines of latitude and longitude will be oriented and positioned on the sphere. A datum serves this purpose and specifies precisely the orientation and origins of the lines of latitude and longitude relative to the center of the earth or spheroid.
Depending on the need, situation, and location, there are several datums to choose from. For instance, local datums try to match the spheroid closely to the earth’s surface in a local area and return accurate local coordinates. A typical local datum used in the United States is called NAD83 (i.e., North American Datum of 1983). For locations in the United States and Canada, NAD83 returns relatively accurate positions, but positional accuracy deteriorates when outside of North America.
The global WGS84 datum (i.e., World Geodetic System of 1984) uses the center of the earth as the origin of the GCS and is used for defining locations across the globe. Because the datum uses the center of the earth as its origin, locational measurements tend to be more consistent regardless of where they are obtained on the earth. However, they may be less accurate than those returned by a local datum. Note that switching between datums will alter the coordinates (i.e., latitude and longitude) for all locations of interest.

A YouTube element has been excluded from this version of the text. You can view it online here: https://slcc.pressbooks.pub/physicalgeography/?p=41
Map Projections
The Earth is not flat or round, but a spherical shape, called a spheroid. A globe is an excellent representation of the three-dimensional, spheroid earth. One of the problems with globes, however, is that they are not very portable (i.e., you cannot fold a globe and put in it in your pocket), and their small scale makes them of limited practical use (i.e., geographic detail is sacrificed). To overcome these issues, it is necessary to transform the three-dimensional shape of the earth to a two-dimensional surface like a flat piece of paper, computer screen, or mobile device display in order to obtain more useful map forms and map scales. Enter the map projection.
Map projections refer to the methods and procedures that are used to transform the spherical three-dimensional earth into two-dimensional planar surfaces. Specifically, map projections are mathematical formulas that are used to translate latitude and longitude on the surface of the earth to x and y coordinates on a plane. Since there is an infinite number of ways this translation can be performed, there is an infinite number of map projections. The mathematics behind map projections are beyond the scope of this introductory overview for simplicity, the following discussion focuses on describing types of map projections, the distortions inherent to map projections, and the selection of appropriate map projections.

A YouTube element has been excluded from this version of the text. You can view it online here: https://slcc.pressbooks.pub/physicalgeography/?p=41
To illustrate the concept of a map projection, imagine that we place a light bulb in the center of a translucent globe. On the globe are outlines of the continents and the lines of longitude and latitude called the graticule. When we turn the light bulb on, the outline of the continents and the graticule will be “projected” as shadows on the wall, ceiling, or any other nearby surface. This is what is meant by map “projection.”
Within the realm of maps and mapping, there are three surfaces used for map projections (i.e., surfaces on which we project the shadows of the graticule). These surfaces are the plane, the cylinder, and the cone. Referring again to the previous example of a light bulb in the center of a globe, note that during the projection process, we can situate each surface in any number of ways. For example, surfaces can be tangential to the globe along the equator or poles, they can pass through or intersect the surface, and they can be oriented at any number of angles.
Naming conventions for many map projections include the surface as well as its orientation. For example, as the name suggests, “planar” projections use the plane, “cylindrical” projections use cylinders, and “conic” projections use the cone. For cylindrical projections, the “normal” or “standard” aspect refers to when the cylinder is tangential to the equator (i.e., the axis of the cylinder is oriented north-south). When the axis of the cylinder is perfectly oriented east-west, the aspect is called “transverse,” and all other orientations are referred to as “oblique.” Regardless of the orientation or the surface on which a projection is based, a number of distortions will be introduced that will influence the choice of map projection.
When moving from the three-dimensional surface of the earth to a two-dimensional plane, distortions are not only introduced but also inevitable. Generally, map projections introduce distortions in distance, angles, and areas. Depending on the purpose of the map, a series of trade-offs will need to be made concerning such distortions.

A YouTube element has been excluded from this version of the text. You can view it online here: https://slcc.pressbooks.pub/physicalgeography/?p=41
Map projections that accurately represent distances are referred to as equidistant projections. Note that distances are only correct in one direction, usually running north-south, and are not correct everywhere across the map. Equidistant maps are frequently used for small-scale maps that cover large areas because they do an excellent job of preserving the shape of geographic features such as continents.
Maps that represent angles between locations also referred to as bearings, are called conformal. Conformal map projections are used for navigational purposes due to the importance of maintaining a bearing or heading when traveling great distances. The cost of preserving bearings is that areas tend to be quite distorted in conformal map projections. Though shapes are more or less preserved over small areas, at small scales areas become wildly distorted. The Mercator projection is an example of a conformal projection and is famous for distorting Greenland.
As the name indicates, equal area or equivalent projections preserve the quality of the area. Such projections are of particular use when accurate measures or comparisons of geographical distributions are necessary (e.g., deforestation, wetlands). To maintain true proportions in the surface of the earth, features sometimes become compressed or stretched depending on the orientation of the projection. Moreover, such projections distort distances as well as angular relationships.
As noted earlier, there is theoretically an infinite number of map projections to choose from. One of the key considerations behind the choice of map projection is to reduce the amount of distortion. The geographical object being mapped and the respective scale at which the map will be constructed are also essential factors to think about. For instance, maps of the North and South Poles usually use planar or azimuthal projections, and conical projections are best suited for the middle latitude areas of the earth. Features that stretch east-west, such as the country of Russia, are represented well with the standard cylindrical projection, while countries oriented north-south (e.g., Chile, Norway) are better represented using a transverse projection.
If a map projection is unknown, sometimes it can be identified by working backward and carefully examining the nature and orientation of the graticule (i.e., grid of latitude and longitude), as well as the varying degrees of distortion. There are trade-offs made concerning distortion on every map. There are no hard-and-fast rules as to which distortions are more preferred over others. Therefore, the selection of map projection largely depends on the purpose of the map.
Within the scope of GIS, knowing, and understanding map projections are critical. For instance, in order to perform an overlay analysis as the one described earlier, all map layers need to be in the same projection. If they are not, geographical features will not be appropriately aligned, and any analyses performed will be inaccurate and incorrect. Most GIS includes functions to assist in the identification of map projections, as well as to transform between projections in order to synchronize spatial data. Despite the capabilities of technology, an awareness of the potential and pitfalls that surround map projections is essential.
Geospatial Technology
Traditionally, the field of cartography, or mapmaking, has been a vital discipline for geographers. While cartography is an essential part of geography, geographers also look at spatial (space) and temporal (time) relationships between various types of data, including physical landscape types, economies, and human activity. Geography also examines the relationships between and the processes of humans and their physical and cultural environments. Because maps are powerful visual graphics tools that illustrate relationships and processes at work in the world, cartography and geographic information systems have become prominent in modern science. Maps are the most common method of illustrating different spatial qualities, and geographers create and use maps to communicate spatial data about the earth’s surface.

A YouTube element has been excluded from this version of the text. You can view it online here: https://slcc.pressbooks.pub/physicalgeography/?p=41
Geospatial techniques are tools used by geographers to illustrate, manage, and manipulate spatial data. Cartography is the art and science of making maps, which illustrate data in a spatial form and are invaluable in understanding what is going on at a given place at a given time.
Global Positioning Systems

Making maps and verifying a location has become more exact with the development of the global positioning system (GPS). A GPS unit can receive signals from orbiting satellites and calculate an exact location in latitude and longitude, which helps determine where one is located on the earth or for verifying a point on a map. GPS units are standard equipment for many transportation systems and have found their way into products such as cell phones, handheld computers, fish finders, and other mobile equipment. GPS technology is widely implemented in the transport of people, goods, and services around the world.

A YouTube element has been excluded from this version of the text. You can view it online here: https://slcc.pressbooks.pub/physicalgeography/?p=41
Remote Sensing
Remote sensing technology acquires data about the earth’s surface through aerial photographs taken from airplanes or images created from satellites orbiting the earth. Remotely sensed images allow geographers to identify, understand, or explain a particular landscape or determine the land use of a place. These images can serve as essential components in the cartographic (mapmaking) process. These technologies provide the means to examine and analyze changes on the earth’s surface caused by natural or human forces. Google Earth is an excellent example of a computer tool that illustrates remotely sensed images of locations on the earth.

A YouTube element has been excluded from this version of the text. You can view it online here: https://slcc.pressbooks.pub/physicalgeography/?p=41
Geographic Information Systems
Geographic information systems (GIS), uses a computer program to assimilate and manage many layers of map data, which then provide specific information about a given place. GIS data are usually in digital form and arranged in layers. The GIS computer program can sort or analyze layers of data to illustrate a specific feature or activity. GIS programs are used in a wide range of applications, from determining the habitat range of a bird species to mapping the hometowns of university students.

GIS specialists often create and analyze geographical information for government agencies or private businesses. They use computer programs to take raw data to develop the information these organizations need to make vital decisions. For example, in business applications, GIS can be used to determine a desirable location for a retail store based on the analysis of spatial data layers such as population distribution, highway or street arrangements, and the locations of similar stores or competitive establishments. GIS can integrate several maps into one to help analysts understand a place concerning their own specific needs.
GIS also focuses on storing information about the earth (both cultural and natural) in computer databases that can be retrieved and displayed in the form of specialized maps for specific purposes or analyses. GIS specialists require knowledge about computer and database systems. Over the last two decades, GIS has revolutionized the field of cartography: nearly all cartography is now done with the assistance of GIS software. Additionally, the analysis of various cultural and natural phenomena through the use of GIS software and specialized maps is an integral part of urban planning and other social and physical sciences. GIS can also refer to techniques used to represent, analyze, and predict spatial relationships between different phenomena.

A YouTube element has been excluded from this version of the text. You can view it online here: https://slcc.pressbooks.pub/physicalgeography/?p=41