
1.5: Lab 5 - Atmospheric Pressure and Wind
- Page ID
- 25329

\( \newcommand{\vecs}[1]{\overset { \scriptstyle \rightharpoonup} {\mathbf{#1}} } \)
\( \newcommand{\vecd}[1]{\overset{-\!-\!\rightharpoonup}{\vphantom{a}\smash {#1}}} \)
\( \newcommand{\dsum}{\displaystyle\sum\limits} \)
\( \newcommand{\dint}{\displaystyle\int\limits} \)
\( \newcommand{\dlim}{\displaystyle\lim\limits} \)
\( \newcommand{\id}{\mathrm{id}}\) \( \newcommand{\Span}{\mathrm{span}}\)
( \newcommand{\kernel}{\mathrm{null}\,}\) \( \newcommand{\range}{\mathrm{range}\,}\)
\( \newcommand{\RealPart}{\mathrm{Re}}\) \( \newcommand{\ImaginaryPart}{\mathrm{Im}}\)
\( \newcommand{\Argument}{\mathrm{Arg}}\) \( \newcommand{\norm}[1]{\| #1 \|}\)
\( \newcommand{\inner}[2]{\langle #1, #2 \rangle}\)
\( \newcommand{\Span}{\mathrm{span}}\)
\( \newcommand{\id}{\mathrm{id}}\)
\( \newcommand{\Span}{\mathrm{span}}\)
\( \newcommand{\kernel}{\mathrm{null}\,}\)
\( \newcommand{\range}{\mathrm{range}\,}\)
\( \newcommand{\RealPart}{\mathrm{Re}}\)
\( \newcommand{\ImaginaryPart}{\mathrm{Im}}\)
\( \newcommand{\Argument}{\mathrm{Arg}}\)
\( \newcommand{\norm}[1]{\| #1 \|}\)
\( \newcommand{\inner}[2]{\langle #1, #2 \rangle}\)
\( \newcommand{\Span}{\mathrm{span}}\) \( \newcommand{\AA}{\unicode[.8,0]{x212B}}\)
\( \newcommand{\vectorA}[1]{\vec{#1}} % arrow\)
\( \newcommand{\vectorAt}[1]{\vec{\text{#1}}} % arrow\)
\( \newcommand{\vectorB}[1]{\overset { \scriptstyle \rightharpoonup} {\mathbf{#1}} } \)
\( \newcommand{\vectorC}[1]{\textbf{#1}} \)
\( \newcommand{\vectorD}[1]{\overrightarrow{#1}} \)
\( \newcommand{\vectorDt}[1]{\overrightarrow{\text{#1}}} \)
\( \newcommand{\vectE}[1]{\overset{-\!-\!\rightharpoonup}{\vphantom{a}\smash{\mathbf {#1}}}} \)
\( \newcommand{\vecs}[1]{\overset { \scriptstyle \rightharpoonup} {\mathbf{#1}} } \)
\(\newcommand{\longvect}{\overrightarrow}\)
\( \newcommand{\vecd}[1]{\overset{-\!-\!\rightharpoonup}{\vphantom{a}\smash {#1}}} \)
\(\newcommand{\avec}{\mathbf a}\) \(\newcommand{\bvec}{\mathbf b}\) \(\newcommand{\cvec}{\mathbf c}\) \(\newcommand{\dvec}{\mathbf d}\) \(\newcommand{\dtil}{\widetilde{\mathbf d}}\) \(\newcommand{\evec}{\mathbf e}\) \(\newcommand{\fvec}{\mathbf f}\) \(\newcommand{\nvec}{\mathbf n}\) \(\newcommand{\pvec}{\mathbf p}\) \(\newcommand{\qvec}{\mathbf q}\) \(\newcommand{\svec}{\mathbf s}\) \(\newcommand{\tvec}{\mathbf t}\) \(\newcommand{\uvec}{\mathbf u}\) \(\newcommand{\vvec}{\mathbf v}\) \(\newcommand{\wvec}{\mathbf w}\) \(\newcommand{\xvec}{\mathbf x}\) \(\newcommand{\yvec}{\mathbf y}\) \(\newcommand{\zvec}{\mathbf z}\) \(\newcommand{\rvec}{\mathbf r}\) \(\newcommand{\mvec}{\mathbf m}\) \(\newcommand{\zerovec}{\mathbf 0}\) \(\newcommand{\onevec}{\mathbf 1}\) \(\newcommand{\real}{\mathbb R}\) \(\newcommand{\twovec}[2]{\left[\begin{array}{r}#1 \\ #2 \end{array}\right]}\) \(\newcommand{\ctwovec}[2]{\left[\begin{array}{c}#1 \\ #2 \end{array}\right]}\) \(\newcommand{\threevec}[3]{\left[\begin{array}{r}#1 \\ #2 \\ #3 \end{array}\right]}\) \(\newcommand{\cthreevec}[3]{\left[\begin{array}{c}#1 \\ #2 \\ #3 \end{array}\right]}\) \(\newcommand{\fourvec}[4]{\left[\begin{array}{r}#1 \\ #2 \\ #3 \\ #4 \end{array}\right]}\) \(\newcommand{\cfourvec}[4]{\left[\begin{array}{c}#1 \\ #2 \\ #3 \\ #4 \end{array}\right]}\) \(\newcommand{\fivevec}[5]{\left[\begin{array}{r}#1 \\ #2 \\ #3 \\ #4 \\ #5 \\ \end{array}\right]}\) \(\newcommand{\cfivevec}[5]{\left[\begin{array}{c}#1 \\ #2 \\ #3 \\ #4 \\ #5 \\ \end{array}\right]}\) \(\newcommand{\mattwo}[4]{\left[\begin{array}{rr}#1 \amp #2 \\ #3 \amp #4 \\ \end{array}\right]}\) \(\newcommand{\laspan}[1]{\text{Span}\{#1\}}\) \(\newcommand{\bcal}{\cal B}\) \(\newcommand{\ccal}{\cal C}\) \(\newcommand{\scal}{\cal S}\) \(\newcommand{\wcal}{\cal W}\) \(\newcommand{\ecal}{\cal E}\) \(\newcommand{\coords}[2]{\left\{#1\right\}_{#2}}\) \(\newcommand{\gray}[1]{\color{gray}{#1}}\) \(\newcommand{\lgray}[1]{\color{lightgray}{#1}}\) \(\newcommand{\rank}{\operatorname{rank}}\) \(\newcommand{\row}{\text{Row}}\) \(\newcommand{\col}{\text{Col}}\) \(\renewcommand{\row}{\text{Row}}\) \(\newcommand{\nul}{\text{Nul}}\) \(\newcommand{\var}{\text{Var}}\) \(\newcommand{\corr}{\text{corr}}\) \(\newcommand{\len}[1]{\left|#1\right|}\) \(\newcommand{\bbar}{\overline{\bvec}}\) \(\newcommand{\bhat}{\widehat{\bvec}}\) \(\newcommand{\bperp}{\bvec^\perp}\) \(\newcommand{\xhat}{\widehat{\xvec}}\) \(\newcommand{\vhat}{\widehat{\vvec}}\) \(\newcommand{\uhat}{\widehat{\uvec}}\) \(\newcommand{\what}{\widehat{\wvec}}\) \(\newcommand{\Sighat}{\widehat{\Sigma}}\) \(\newcommand{\lt}{<}\) \(\newcommand{\gt}{>}\) \(\newcommand{\amp}{&}\) \(\definecolor{fillinmathshade}{gray}{0.9}\)- Construct and interpret an atmospheric pressure profile.
- Identify the mechanisms that drive wind.
- Diagram a global circulation model.
- Analyze and interpret global atmospheric pressure and temperature maps.
- Explain different types of local and regional wind patterns.
Introduction
Although we cannot see it, air is all around us. Earth is covered in a layer of gasses, kept close to the surface by gravity. The gravitational pull of gasses to the surface creates air pressure. A variety of other atmospheric and surface conditions also influence the rising or subsiding (sinking) of air. This results in a wide range of pressure systems covering the Earth. It is these differences in air pressure from one location to another that causes the horizontal movement of air known as wind. This movement of air also distributes humidity and energy over the surface of the Earth and has a significant impact on the weather and climate patterns over the Earth.
In this lab you will explore a variety of ideas related to air pressure and its impacts on wind and weather patterns.
Part A. Measuring Air Pressure
Because of the gravitational pull on the gasses in the atmosphere, the greatest air pressure is at the bottom, with the “weight” of the overlying air pushing down on the surface. Further, the gas molecules are more closely packed together (have a higher density) at the surface than is found at higher altitudes. Figure 5.1 illustrates this idea.
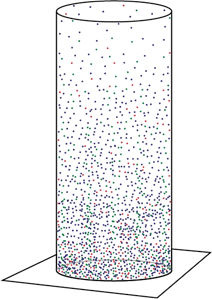
You may have experienced the impacts of less dense air at higher elevations. If you usually live, work, and recreate at lower elevations, you might find yourself getting short of breath while doing some of those same things at higher elevations. You may even get a headache or feel sluggish. This is because the molecules are further apart, resulting in air that is less dense, or “rarified”. Although you are filling your lungs, you still are not getting as many oxygen molecules in.
Air pressure is measured using an instrument called a barometer. A barometer is a specialized instrument that measures the pressure of the surrounding air. You may hear different terms like air pressure, atmospheric pressure, and barometric pressure; these all mean the same thing and refer to the force of the air on the surface of the Earth. Just like length or temperature can be recorded using different units of measurement, air pressure can also be reported in a variety of units. Most commonly you will find air pressure reported in inches of mercury (inHg) or in millibars (mb). On average, the air pressure at sea level is 29.92 inHg, or 1013.25 mb. Across the Earth, you will see a variety of pressure systems with higher or lower pressure. At higher elevations, you will typically find lower surface pressure. On average, air pressure on the surface ranges between 980 mb to 1050 mb, although there are periodic outliers.
The conversions between inches of mercury (inHg) and millibars (mb) are provided below.
1.0 inch Hg = 33.87 mb
1.0 mb = 0.0295 inch of Hg
Use the conversion formulas above to convert the following barometric pressure measurements.
- Highest recorded air pressure on Earth measured in Tosontsengel, Mongolia:
32.03 inHg = ________________ mb
- Lowest recorded air pressure on Earth measured in Typhoon Tip:
________ inHg = 869.9 mb
- Current air pressure outside lab today (search the internet to find this information):
Today’s date: _________________
Time: ____________________
______________ inHg and _________________ mb
- Current air pressure at your favorite/dream vacation destination (search the internet to find this information):
Location: ___________________
Today’s date: ___________
Time: ___________
______________ inHg and _________________ mb
Part B. Standard Atmospheric Pressure Profile
As discussed earlier, gravity has a significant influence on the vertical distribution of gasses within our atmosphere. Table 5.1 provides the average air pressure at a range of altitudes. You can see that the higher the altitude of the barometric readings, the lower the air pressure values will be. Because gravity is pulling the air down, at higher elevations you are only measuring the force from the overlying air.
- Using the data in Table 5.1, graph the atmospheric pressure profile on the graph provided below (Figure 5.2) and then connect the data points with a solid line.
| Altitude (km) | Pressure (mb) |
|---|---|
| 0 | 1013.25 |
| 1 | 898.746 |
| 2 | 794.952 |
| 3 | 701.085 |
| 4 | 616.402 |
| 5 | 540.199 |
| 6 | 471.810 |
| 7 | 410.607 |
| 8 | 355.998 |
| 9 | 307.425 |
| 10 | 264.363 |
| 15 | 120.446 |
| 20 | 54.7489 |
| 25 | 25.1102 |
| 30 | 11.7187 |
| 40 | 2.77522 |
| 50 | 0.759448 |
| 60 | 0.203143 |
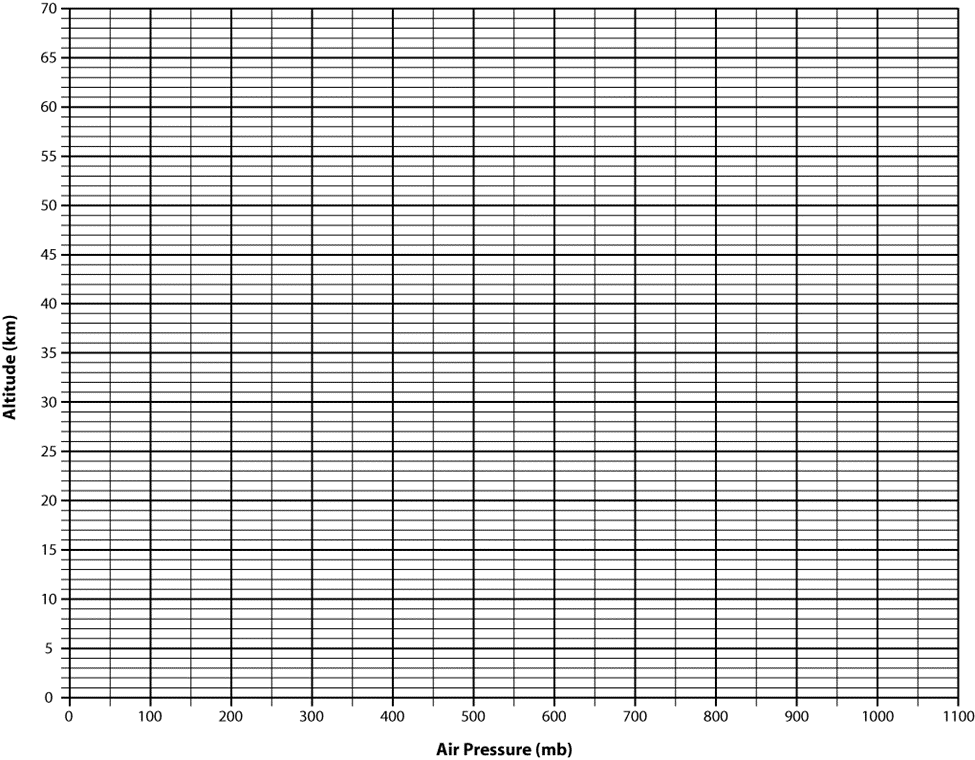
- Use your completed Figure 5.2 graph to answer the following questions:
- The highest peak in California (and the continental United States) is Mt. Whitney, outside of Lone Pine, California, with an elevation of 14,495 feet (4.4 kilometers). What is the average barometric pressure at the summit?
- The highest peak in all of North America is Mt. Denali in Alaska. It’s peak is at 20,310 feet (6 kilometers). What is the average barometric pressure there?
- Use Your Critical Thinking Skills: Considering your answer to the questions above, why do you think hikers are short of breath when they climb to some of these very high peaks?
- Most commercial jet planes fly at an altitude of 36,000 feet (approximately 11 kilometers). What is the average air pressure at this altitude?
- What is the highest elevation (on the surface; not in a plane) that you have been to? Search the internet to find the location’s elevation.
- Location:
- Elevation in meters:
- What is the average air pressure at that elevation? Tip: first, convert elevation in meters to kilometers by dividing by 1,000, and then use the Figure 5.2 graph.
Part C. Global Mechanisms of Wind
Wind is the horizontal movement of air across the surface of the earth. Although the main driver of wind is a difference in surface air pressure, there are several factors that interact to drive the winds. In this section, you will explore each of these factors.
Gravity
In the previous section, you learned that at higher elevations the air pressure is lower. If the low pressure is found at higher elevations, why does the air not rush towards those locations of lower pressure? This is because gravity is pulling the atmospheric gasses. So, while gravity does not have a direct impact on air movement, it does keep the air from rushing up the mountains to the low pressure found there (Figure 5.3).

Pressure Gradient
Although in the previous section you learned that, on average, the atmospheric pressure is 1013.25 millibars (mb), the pressure actually varies, significantly at times, across the surface of the Earth. There are many reasons for this, but one of the leading causes of this difference in pressure is temperature differences. As air warms, its density decreases. This causes the warm air to rise, creating a lower pressure. Inversely, cool air becomes more dense and subsides (sinks), causing higher pressure. What happens on the surface if in one location there is a higher pressure and in an adjacent location there is a lower pressure? This is referred to as a pressure gradient. The air would move away from the high pressure and move towards the lower pressure, as diagrammed below in Figure 5.4.

Coriolis Effect
As air moves between high and low pressure areas, it is affected by another important force. Due to the rotation of the Earth, as the atmosphere is moving over the moving surface, winds are deflected to the right in the northern hemisphere (clockwise) and to the left in the southern hemisphere (counterclockwise). This phenomenon is known as the Coriolis effect, also called the Coriolis force. The diagram below (Figure 5.5) illustrates the movement over a rotating globe.

 Check It Out! The Coriolis Effect
Watch this brief video from the U.K.’s Meteorological Office to see an experiment that demonstrates how the Coriolis effect works. (Video length is 1:53).
Friction
Upper atmospheric winds, called geostrophic winds, are pulled evenly by the pressure gradient and Coriolis effect. So, these high altitude winds typically run parallel to the lines of equal pressure, referred to as isobars. However, within about 30 meters of the surface, friction acts to slow the movement of the wind, countering the force of pressure gradient and the Coriolis effect, thus causing the wind to travel diagonally over the isobars, away from a high pressure towards a low pressure system.
 Pin It! Four Primary Factors of Atmospheric Circulation
These four factors influence atmospheric circulation:
- Gravity: Keeps air from rushing to higher elevations.
- Pressure Gradient: Air moves away from high pressure towards a low pressure system.
- Coriolis: Due to the rotation of the Earth, objects seem to deflect to the right in the northern hemisphere and to the left in the southern hemisphere.
- Friction: Causes a drag on the movement of air within approximately 30 meters of the Earth’s surface; air moves diagonally over the isobars.
In Figure 5.6 you can see how each of these factors influence the movement of air near the surface of the Earth.

As the air moves away from the high pressure system and closer to the low pressure, all three factors have an influence on the air movement. This is illustrated in Figure 5.7.

- In Table 5.2, indicate the movement of air in high and low pressure systems for each hemisphere. Fill in the table using one of the two choices given in italics in the far-left column.
| Location: | Northern Hemisphere High (Anticyclonic) | Northern Hemisphere Low (Cyclonic) | Southern Hemisphere High (Anticyclonic) | Southern Hemisphere Low (Cyclonic) |
|---|---|---|---|---|
| Surface air moves into or out of: | ||||
| Surface air will rise or subside in the center: | ||||
| Surface air motion is clockwise or counterclockwise: |
- The circles represent isobars on the diagrams shown in Table 5.3 . The arrows represent the surface wind direction. In the center of each system, write an “H” or “L,” indicating a high or low pressure system. In the space below each diagram, indicate if it represents a system in the Northern or Southern hemisphere.
| Questions | Diagram A | Diagram B | Diagram C | Diagram D |
|---|---|---|---|---|
| High or Low Pressure? |  |
 |
 |
 |
| Northern or Southern Hemisphere? |
- On Figure 5.8, label the center of the high with an “H” and the center of the low with an “L. Then draw arrows showing the direction of air movement within each of the pressure areas, and then draw a single arrow showing the direction of the surface air movement between these two pressure areas. Assume they are in the Northern Hemisphere.

Part D. The Global Circulation Model
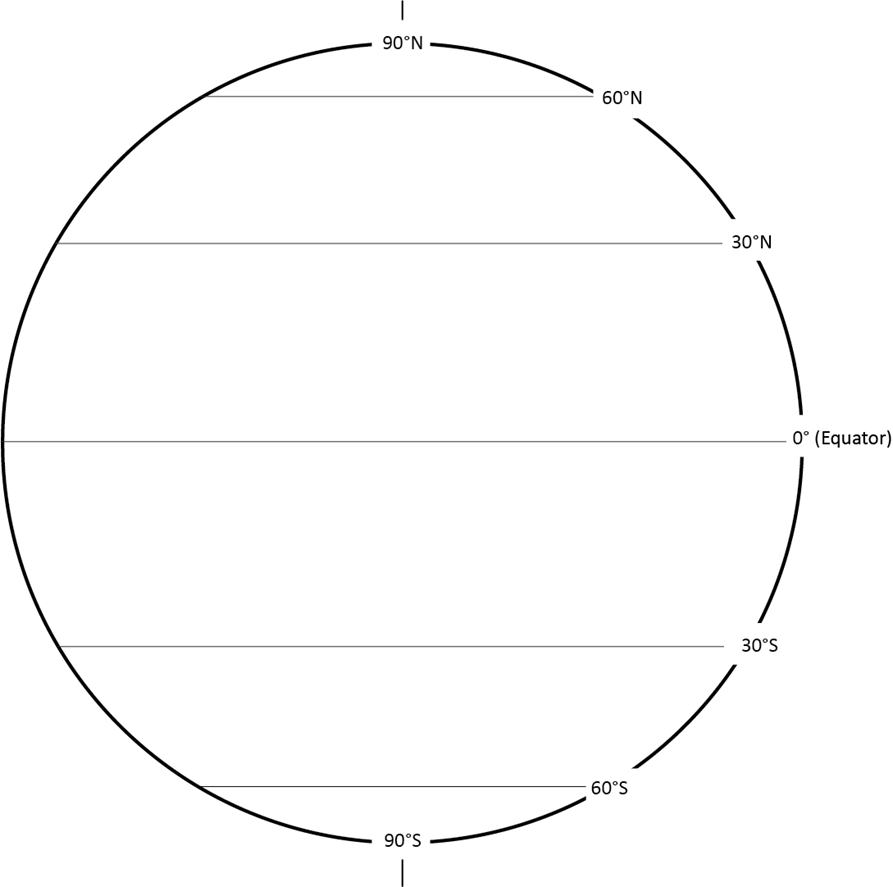
Before we take a look at the components of global atmospheric circulation, it will be helpful for you to know the terminology related to the latitudinal zones (Figure 5.9). When discussing the major wind patterns across the Earth, these latitudinal zones are referenced frequently.

- Refer to Figure 5.9.
- What is the range of latitudes for the tropical latitudinal zone?
- In the northern hemisphere, what is the range of latitudes for the subtropical latitudinal zone?
- In the northern hemisphere, what is the range of latitudes for the midlatitude latitudinal zone?
- In the northern hemisphere, what is the range of latitudes for the subarctic latitudinal zone?
- In the northern hemisphere, what is the range of latitudes for the arctic latitudinal zone?
You learned that warm, rising air can cause a low pressure system and that cool, subsiding air can cause a high pressure system. These pressure systems, developed because of the temperature of the air mass, are referred to as thermal pressure systems. Across the Earth, there are two major thermal pressure systems. Because of the more direct solar energy near the equator, warm air rises, creating a thermal low pressure system. At the polar regions, cool air subsides, creating a thermal high pressure system.
The second factor affecting surface air pressure patterns is more complicated and has more to do with conditions in the upper atmosphere. Simply stated, sometimes pressure conditions cause air to be “pushed downward” on the lower atmosphere, thereby creating a dynamic high pressure area at the surface. This dynamic high pressure system is found at approximately 25 to 35 degrees north and south latitude and is what causes the deserts surrounding the Earth in the subtropics.
At higher latitudes, cold, dry air from the polar region collides with warmer, more humid air from the midlatitudes. The warmer, less dense air is forced upwards. At the same time, upper atmospheric conditions are such that air from the lower atmosphere is allowed to rise upwards. This creates a dynamic low pressure area at the surface at approximately 55 to 66.5 degrees north and south latitude.
- Based on what you know about the global circulation model, complete Table 5.4. You may need to refer to your lecture notes or your textbook, or watch the Guided Practice video.
 Guided Practice: Global Circulation Model
Go step-by-step through the components of global atmospheric circulation with this video from Scott’s Geography Notebook, Global Circulation Model. (Video length is 13:27).
| Name | Pressure (High or Low) | Thermal or Dynamic | Latitude | General Air Temp (Hot, Warm, Cool or, Cold) | Air Moisture (Humid or Dry) |
|---|---|---|---|---|---|
| Polar | |||||
| Subpolar | |||||
| Subtropical | |||||
| Equatorial |
- Using the simplified drawing of the Earth below (Figure 5.10), use arrows along the outside edge of the globe to diagram the vertical movement of air within pressure systems (rising off or subsiding down to the surface) as well as the movement of wind between the global pressure systems.

The predominant pressure systems found in the Pacific have an impact on California’s weather systems. The low pressure region over the Aleutian Islands is referred to as the “Aleutian Low” while the high pressure region over Hawaii is referred to as the “Pacific High”.
To answer the following questions, refer to the global barometric pressure maps for January (Appendix 5.3) and July (Appendix 5.1). Your professor may require you to use Google Earth to access these maps. The instructions on how to do this are available in Appendix 5.5.
- Which of the four hemispheric pressure areas do you see offshore in the Pacific Ocean near California on the July map?
- On the January map, which of the four hemispheric pressure areas is located near the Aleutian Islands?
Prevailing Winds
Now that you have learned of the major pressure systems at different latitudes, you will now explore how these pressure systems contribute to larger, global patterns of wind referred to as prevailing winds. Figure 5.11 is a simplified drawing of the Earth with some predominant latitudes labeled.
- Across the corresponding latitudes on Figure 5.11 below, add several large H’s for high pressure systems and several L’s for low pressure systems. These will correspond with the global pressure systems you identified in Figure 5.10, above.
- Based on the three main factors of primary circulation (pressure gradient, Coriolis effect, and friction) draw arrows corresponding with the movement of air between the pressure systems on Figure 5.11.
- Label Figure 5.11 with the following prevailing winds:
- Northeast Trade Winds (found in the tropical region of the northern hemisphere)
- Southeast Trade Winds (found in the tropical region of the southern hemisphere)
- Prevailing Westerlies (found in the midlatitudes of both northern and southern hemisphere)
- Polar Easterlies (found in the Arctic and Antarctic latitudinal zones)
The Intertropical Convergence Zone (ITCZ)
Your completed Figure 5.11 shows a low pressure at the equator. This simplifies real-world conditions in order to help you understand the prevailing winds. You can advance your understanding by recognizing the following facts:
➢ Your Figure 5.11 does not include continents and oceans. Continents and oceans have different heat properties that impact atmospheric pressure systems. The topography of continents also impacts atmospheric pressure.
➢ Because the Earth is tilted, there are seasonal differences that cause atmospheric pressure systems to shift.
Rather than thinking of the equatorial low as a straight line, we can think of it as a zone where winds converge. The Intertropical Convergence Zone (ITCZ) is the region that circles the Earth, near the equator, where the trade winds of the Northern and Southern Hemispheres come together (Figure 5.12). The intense sun and warm water of the equator heats the air in the ITCZ, raising its humidity and making it buoyant. Aided by the convergence of the trade winds, the buoyant air rises. As the air rises it expands and cools, releasing the accumulated moisture in an almost perpetual series of thunderstorms. Seasonal shifts in the location of the ITCZ drastically affect rainfall in many equatorial nations, resulting in the wet and dry seasons of the tropics rather than the cold and warm seasons of higher latitudes. Long-term changes in the ITCZ can result in severe droughts or flooding in nearby areas.[81]

- Refer to Figure 5.12.
- Apply What You Learned: Why do you think that the ITCZ shifts to the north in July and shifts to the south in January? Hint: consider the Annual March of the Seasons and where higher levels of insolation would cause air to warm and rise. Explain your response in one to two sentences.
- Use Your Critical Thinking Skills: How does the shifting ITCZ affect the prevailing winds? Explain your response in one to two sentences.
Part E. Global Pressure and Temperature Patterns
- Using the data provided on the July global air pressure and temperature maps (Appendix 5.1 and 5.2, respectively) record the needed data in Table 5.5. Note that you are collecting temperature and pressure along 140°W, from the north to the south. (A few of the data values have been provided). Your professor may require you to use Google Earth to access these maps. The instructions on how to do this are available in Appendix 5.5.
| Coordinates | July Temp (°C) | July Pressure |
|---|---|---|
| 80°N, 140°W | ~ 0 | ~ 1011 |
| 60°N, 140°W | ~ 6 | ~ 1014 |
| 40°N, 140°W | ~ 16 | ~ 1024 |
| 20°N, 140°W | ||
| 0°N, 140°W | ||
| 20°S, 140°W | ||
| 40°S, 140°W | ||
| 60°S, 140°W | ||
| 80°S, 140°W |
- Plot the pressure and temperature trends along 140˚ W longitude on the graph provided below (Figure 5.13). Use a green pencil to plot air pressure values using the left-hand vertical axis and then draw a green line connecting the points. Then use a red pencil to plot temperature values using the right-hand vertical axis on each graph and then draw a red line connecting the points.

- In two to three sentences, describe the overall pattern of temperature when looking from pole to pole.
- What overall pattern do you observe with air pressure? Describe the pattern in one to two sentences.
- You will find two latitudes with slightly higher pressure than the surrounding latitudes. What global pressure systems do these represent?
- On the map, you will find significantly high pressure over Antarctica. What global pressure system does this represent?
- Using the data provided on the January global air pressure and temperature maps (Appendix 5.3 and 5.4, respectively) record the needed data in Table 5.6. Note that you are now collecting temperature and pressure along 60°N, from the western hemisphere, across the globe to the eastern hemisphere. (A few of the data values have been provided). Your professor may require you to use Google Earth to access these maps. The instructions on how to do this are available in Appendix 5.5.
| Coordinates | Jan Temp (°C) | Jan Pressure | Land or Sea? |
|---|---|---|---|
| 60°N, 160°W | ~ -13 | ~ 1001 | Land |
| 60°N, 140°W | ~ -14 | ~ 1006 | Land |
| 60°N, 120°W | ~ -22 | ~ 1016 | Land |
| 60°N, 100°W | ~ -27 | ~ 1015 | Land |
| 60°N, 80°W | ~ -25 | ~ 1006 | Sea |
| 60°N, 60°W | |||
| 60°N, 40°W | |||
| 60°N, 20°W | |||
| 60°N, 0° | |||
| 60°N, 20°E | |||
| 60°N, 40°E | |||
| 60°N, 60°E | |||
| 60°N, 80°E | |||
| 60°N, 100°E | |||
| 60°N, 120°E | |||
| 60°N, 140°E | |||
| 60°N, 160°E | |||
| 60°N, 180°E |
- Plot the pressure and temperature trends along 60°N latitude on the graph provided in Figure 5.14. Use a green pencil to plot air pressure values using the left-hand vertical axis and then draw a green line connecting the points. Then use a red pencil to plot temperature values using the right-hand vertical axis on each graph and then draw a red line connecting the points.

- In one to two sentences, describe the overall pattern of the temperature along 60°N latitude.
- Use Your Critical Thinking Skills: You will note some significant patterns regarding land masses and temperature. What relationship does your data suggest between land versus water and temperature in the northern hemisphere winter? Explain why in one to two sentences.
- What is the general relationship you observe between global air pressure and temperature values? Explain this relationship in one to two sentences.
Refer back to the pressure maps for January and July (Appendix 5.3 and 5.1, respectively). Notice that in some locations the isobars are very close to each other. In other areas, the isobars are far apart. When the isobars are close to one another, this indicates a stronger pressure gradient, resulting in stronger winds. Where the isobars are spaced further apart, there is a less severe pressure gradient, resulting in lighter winds.
- Which general locations would have the strongest winds in January?
- Which general locations would have the strongest winds in July?
Part F. Local and Regional Wind Patterns
Up to now, you have looked at larger, global scale pressure systems and their related wind patterns. There are, however, several local and regional wind patterns that are important to understand.
Onshore and Offshore Breezes
In the previous section, you observed the temperature differences between land and water. Although your observations were global and making observations between seasons, the same differences in land-water temperatures can be observed locally, and on a day versus night (diurnal) cycle. This difference is observed in many coastal areas.
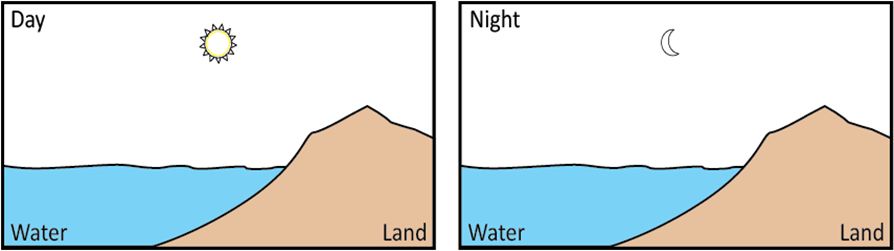
Although exposed to the same amount of solar energy, land masses become warmer than water during the day. This causes the overlying air to become warmer. This warmer air begins to rise, creating a slight low pressure system. This draws air in, off of the ocean. These are referred to as onshore breezes. Inversely, at night, the temperature of the land mass cools more than the water. The overlying air also cools and subsides, creating slightly higher pressure over the land. This higher pressure over the land mass causes the wind to blow off shore, referred to as offshore breezes.
- In the diagrams below (Figure 5.15), draw lines indicating the movement of air in the coastal areas. Label either an H (high) or L (low) above the land and water in both diagrams. Also label each diagram as either onshore breezes or offshore breezes.
- Apply What You Learned: Imagine you are standing on Stern’s Wharf in Santa Barbara, CA (34.41°N, 119.68°W) on a July afternoon. Would you expect the wind to be blowing towards the land or towards the ocean? Explain your answer in one to two sentences.
- Apply What You Learned: Now imagine that you are camping on Angel Island State Park, in San Francisco Bay (37.87° N, 122.43° W). You wake up just before sunrise. Would you expect the wind to be blowing towards the Golden Gate Bridge (towards the ocean) or towards Richmond and the rest of California? Explain your response in one to two sentences.
Mountain/Valley Breezes
Another diurnal pattern that can be observed throughout California are mountain/valley breezes. During the day, the sun on the slope of a mountain will warm the surface and the overlying air. This warmer air begins to rise, pulling with it some of the lower lying air from the valley floor. This causes a general movement of air up the slope and canyons during the daytime; these are called valley breezes. At night, the rarified air at higher elevations cools more quickly than the air down on the valley floor. This cooler air becomes more dense and begins to sink down the side of the slope. This creates downslope breezes called mountain breezes.
- In the diagrams below (Figure 5.16), draw lines indicating the movement of air in the mountain and valley areas. Label each diagram as either valley breezes or mountain breezes.

- Use Your Critical Thinking Skills: If there were a forest fire burning on the slope of the hill, what impacts might a mountain/valley breeze have on the fire? In two to three sentences, discuss the conditions during daytime and night time.
Santa Ana Winds
Southern California often experiences a regional wind pattern referred to as Santa Ana winds, also known as the Santa Anas. These winds are the result of seasonal pressure systems, elevation in the desert regions of Nevada and Eastern California, mountains surrounding Southern California, and the influence of the ocean.
Typically between March and October, there is periodically a cooler air mass that settles over central Nevada. Although still fairly dry, this cooler air is more dense, resulting in a high pressure system over Nevada. This can, at times be compounded with a low pressure system over the Pacific, generating a significant pressure gradient.
The situation however is compounded with the air moving over the Transverse Range and the Peninsular Range which surround Southern California. As the air moves from the high (elevation) desert and then down the slopes and through the canyons of the Southern California mountains, the air is heated by compression (Figure 5.17). This heating also decreases the relative humidity of the air, which makes these winds very dry. The arrows on Figure 5.16 indicate air movement over the Transverse and Peninsular Ranges. Air descends towards coastal valleys and basins (represented by the arrow labeled with “Air Warmed By Compression”) which results in warm, dry Santa Ana winds across the coastal valleys and basins.

The end result for Southern California is a seasonal hot and dry strong wind. Unfortunately, this also often occurs after the long dry summers and exacerbates the fire season of Southern California.
- On the map provided in Figure 5.18, draw lines indicating the flow of wind in the diagrammed Santa Ana conditions. Note: the winds will be more likely to move through passes and canyons.

- Based on the map provided in Figure 5.18, what natural areas (forests, grasslands, etc.) are most susceptible to Santa Ana winds in California? Your response should be two to three sentences in length.
Monsoonal Winds
When you hear the word monsoon, images of floods and torrential rains may come to mind. But monsoons can also include intense periods of dryness. A monsoon is a seasonal change in wind and rain patterns observed in certain parts of the world. The changes are driven by seasonal shifts in the temperature differences between the ocean and land. Across the Indian subcontinent and Southeast Asia, the summer and winter monsoons dominate the region’s climate. Between April and September, warm land temperatures drive pressure patterns and winds that draw in moist air from the Indian Ocean, producing heavy rainfall (Figure 15.19, top). During the winter months, the winds move in the opposite direction, blowing cool air over land toward the ocean, leading to very dry conditions (Figure 15.19, bottom).[89]

Dr. Angela Rowe writing for The GLOBE Program (2011, n.p.) explains that “the most well-known monsoon occurs in Asia, where the high elevations of the Tibetan Plateau, extending, on average, over 5,000 meters (~16,404 feet) in height above sea level, enhance the temperature difference between land and water. The Asian monsoon influences a large percentage of Asia” (Figure 5.20).

 Check It Out! Monsoons: Wet, Dry, Repeat...
Check out this video, Monsoons: Wet, Dry, Repeat…, from NASA’s Goddard Space Flight Center for a quick introduction to the variables that influence the monsoons. (Video length is 3:31).
The monsoon is a familiar pattern in middle latitudes, occurring alongside seasonal shifts in atmospheric circulation patterns. In 2020, the low-pressure systems of Asia’s summer monsoon were especially strong and stationary, allowing them to pick up even more moisture from the Indian and Pacific oceans and deliver it to land. Rainfall that accompanies Asia’s summer monsoon plays an important role in the region’s economy by refilling aquifers, generating hydroelectric energy, and providing water for crops. In some years, however, the amount of rainfall breaks records in certain areas. That was the case in 2020. By mid-July, severe flooding affected millions of people across South and East Asia. Figure 5.21 shows the rainfall accumulation across the region from June 1 (the start of the summer monsoon season) to July 20, 2020. The data are remotely-sensed estimates that come from the Integrated Multi-Satellite Retrievals for GPM (IMERG), a product of the Global Precipitation Measurement (GPM) mission. The darkest reds indicate places where GPM detected rainfall totals exceeding 100 centimeters (~39 inches) during this period. Due to averaging of the satellite data, local rainfall amounts may be significantly higher when measured from the ground.[92]

- One hundred centimeters is approximately 39 inches. Search the internet to find the annual precipitation for your location. How does the monsoonal precipitation from June 1 to July 20, 2020 shown in the darkest red color on Figure 5.20 compare to the annual precipitation at your location?
- Apply What You Learned: How would increasing Indian Ocean temperatures influence the monsoons affecting South Asia, Southeast Asia, and East Asia? Explain your response in one to two sentences.
- Draw and label the January and July positions of the ITCZ on Figure 5.21. Tip: refer to Figure 5.12 (shown earlier in the lab). Use a red pencil for the July ITCZ line and label. Use a blue pencil for the January ITCZ line and label. Use a blue pencil for the January ITCZ line and label. Use a red pencil for the July ITCZ line and label.
- Draw four arrows across the map that show the direction of the winds. Use a blue pencil for the winds in January and a red pencil for the winds in July.
- Apply What You Learned: How does the shifting ITCZ influence the monsoons? Explain your response in one to two sentences.
Part G. Wrap-Up
Consult with your geography lab instructor to find out which of the following wrap-up questions you should complete. Attach additional pages to answer the questions as needed.
- What is the most important idea that you learned in this lab? In two to three sentences, explain the concept and why it is important to know.
- What was the most challenging part of this lab? In two to three sentences, explain why it was challenging. If nothing challenged you in the lab, write about what you think challenged your classmates.
- What is one question that you have about what you learned in this lab? Write your question along with one to two sentences explaining why you think your question is important to ask.
- Review the learning objectives on page 1 of this lab. How would you rate your understanding or ability for each learning objective? Write one sentence that addresses each learning objective.
- Sketch a concept map that includes the key ideas from this lab. Include at least five of the terms shown in bold-faced type.
- Create an advertisement to educate your peers on the important information that you learned in this lab. Include at least three key terms in your advertisement. The advertisement should be about half a page in size (about 4 inches by 6 inches).
- One way to think of physical geography is that it is the study of the relationships among variables that impact the Earth's surface. Select two variables discussed in this lab and describe how they are related.
- How does what you learned in this lab relate to your everyday life? In two to three sentences, explain a concept that you learned in this lab and how it relates to your day-to-day actions.
- How does what you learned in this lab relate to current events?
- Write the title, source, and date of a news item that relates to this lab.
- In two to three sentences, discuss how the news item relates to what you have learned in this lab.
- In one to two sentences, discuss whether or not the news item accurately represents the science that you learned. Tip: consider whether or not the news item includes the complexity of the topic.
- Search O*NET OnLine to find an occupation that is relevant to the topics presented in today's lab. Your lab instructor may provide you with possible keywords to type in the Occupation Quick Search field on the O*NET website.
- What is the name of occupation that you found?
- Write two to three sentences that summarize the most important information that you learned about this occupation.
- What is one question that you would want to ask a person with this occupation?
Appendix 5.1: July Atmospheric Pressure Map

Appendix 5.2: July Temperature Map

Appendix 5.3: January Atmospheric Pressure Map

Appendix 5.4: January Temperature Map

Appendix 5.5: Accessing Atmospheric and Temperature Maps in Google Earth
 Guided Practice: Using kmz Files in Google Earth
Go through the steps to download kmz files and upload them in this video, Using a KML File in Google Earth. (Video length is 2:26).
Step 1
 Go to the google drive folder called “Lab 5. kmz files (Atmospheric Pressure and Wind)”.
Step 2
Download the kmz files to your computer. Right-click on the file, then select Download. Click Save File, then Okay. Select the folder where you want to save the kmz file, then click Save. Repeat this for all four files in the google drive folder.
Step 3
 Go to the Google Earth website.
Step 4
Click the Launch Earth button.
Step 5
On the left-side of your screen, click on the three horizontal lines.
Step 6
Click on Projects.
Step 7
Click New Project, then click on Open, and then select Import KML file from computer. Navigate to the location of the kmz files that you downloaded in Step 2 above. Select the first file and then click Open.
Step 8
Return to Projects and repeat Step 7 so that all four kmz files have been added as new projects in Google Earth.
Step 9
To answer the questions in the lab, it is helpful to know the following:
➢ You can move the globe view by clicking and dragging your mouse.
➢ You can “Turn on Gridlines” to view latitude and longitude on the map. Click on the Map Styles icon on the left-hand menu and scroll down to find this toggle button.
➢ You can click on a point to open a pop-up box with the data.
- For the temperature kmz files, temperature is shown in degrees Celsuis.
- Jan Temp (c) 9 means the average January temperature is 9°C.
- For the pressure kmz files, pressure is shown in millibars.
- Jan Pressure 1012 means the average January atmospheric pressure is 1012 mb.
- There is also a four-digit reference number shown in the pop-up boxes; you can disregard these numbers.
[81] Text by NASA’s Earth Observatory is in the public domain
[89] Text by NASA is in the public domain
[92] Text by NASA’s Earth Observatory is in the public domain