
1.3: Lab 3 - Earth-Sun Relationships
- Page ID
- 25327
\( \newcommand{\vecs}[1]{\overset { \scriptstyle \rightharpoonup} {\mathbf{#1}} } \)
\( \newcommand{\vecd}[1]{\overset{-\!-\!\rightharpoonup}{\vphantom{a}\smash {#1}}} \)
\( \newcommand{\id}{\mathrm{id}}\) \( \newcommand{\Span}{\mathrm{span}}\)
( \newcommand{\kernel}{\mathrm{null}\,}\) \( \newcommand{\range}{\mathrm{range}\,}\)
\( \newcommand{\RealPart}{\mathrm{Re}}\) \( \newcommand{\ImaginaryPart}{\mathrm{Im}}\)
\( \newcommand{\Argument}{\mathrm{Arg}}\) \( \newcommand{\norm}[1]{\| #1 \|}\)
\( \newcommand{\inner}[2]{\langle #1, #2 \rangle}\)
\( \newcommand{\Span}{\mathrm{span}}\)
\( \newcommand{\id}{\mathrm{id}}\)
\( \newcommand{\Span}{\mathrm{span}}\)
\( \newcommand{\kernel}{\mathrm{null}\,}\)
\( \newcommand{\range}{\mathrm{range}\,}\)
\( \newcommand{\RealPart}{\mathrm{Re}}\)
\( \newcommand{\ImaginaryPart}{\mathrm{Im}}\)
\( \newcommand{\Argument}{\mathrm{Arg}}\)
\( \newcommand{\norm}[1]{\| #1 \|}\)
\( \newcommand{\inner}[2]{\langle #1, #2 \rangle}\)
\( \newcommand{\Span}{\mathrm{span}}\) \( \newcommand{\AA}{\unicode[.8,0]{x212B}}\)
\( \newcommand{\vectorA}[1]{\vec{#1}} % arrow\)
\( \newcommand{\vectorAt}[1]{\vec{\text{#1}}} % arrow\)
\( \newcommand{\vectorB}[1]{\overset { \scriptstyle \rightharpoonup} {\mathbf{#1}} } \)
\( \newcommand{\vectorC}[1]{\textbf{#1}} \)
\( \newcommand{\vectorD}[1]{\overrightarrow{#1}} \)
\( \newcommand{\vectorDt}[1]{\overrightarrow{\text{#1}}} \)
\( \newcommand{\vectE}[1]{\overset{-\!-\!\rightharpoonup}{\vphantom{a}\smash{\mathbf {#1}}}} \)
\( \newcommand{\vecs}[1]{\overset { \scriptstyle \rightharpoonup} {\mathbf{#1}} } \)
\( \newcommand{\vecd}[1]{\overset{-\!-\!\rightharpoonup}{\vphantom{a}\smash {#1}}} \)
- Describe how Earth’s rotation, revolution, tilt, polarity, and shape influence the Annual March of the Seasons.
- Diagram the seven special lines of latitude and explain their relationship to solstices and equinoxes.
- Explain the relationship between the angle of incidence and radiation intensity.
- Identify vertical, oblique, and tangent rays from the Sun.
- Use an analemma to calculate solar altitude.
- Analyze daylength at different locations and times of the year.
Introduction
Earth’s annual revolution around the Sun influences the angle of incoming solar rays and the length of day at different latitudes. The amount of incoming solar radiation, or insolation, along with daylength influence the Earth’s seasons. In this lab, we will study the relationships between the Earth and the Sun and how those relationships influence the seasons we experience every year. This relationship results in what is known as the Annual March of the Seasons.
Part A. The Annual March of the Seasons
Earth has five key characteristics that play a role in the Annual March of the Seasons: rotation, revolution, tilt, polarity, and shape.
1. Rotation
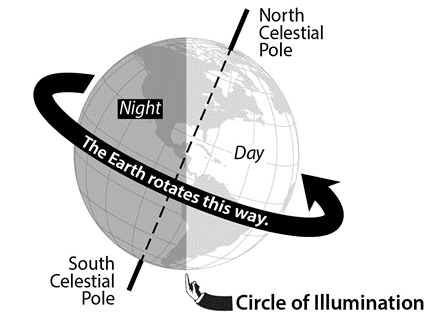
Earth rotates on its axis every 24 hours, which we consider to be one day (Figure 3.1). Each rotation can be seen in the daily change from day to night. The circle of illumination is the line separating the part of the planet receiving sunlight and the part of the planet in darkness.
Why does Earth rotate? It will help to understand how our solar system formed. Almost five billion years ago, our solar system had its beginnings as a vast cloud of dust and gas. The cloud began to collapse, flattening into a giant disk that rotated faster and faster, just as an ice skater spins faster as she brings her arms in. The Sun formed at the center, and the swirling gas and dust in the rest of the spinning disk clumped together to produce the planets, moons, asteroids, and comets. The reason so many objects orbit the Sun in nearly the same plane (called the ecliptic) and in the same direction is that they all formed from this same disk. While the planets were forming, clumps of matter of all sizes often collided, and either stuck together or side-swiped each other, knocking off pieces and sending each other spinning.[38]
2. Revolution
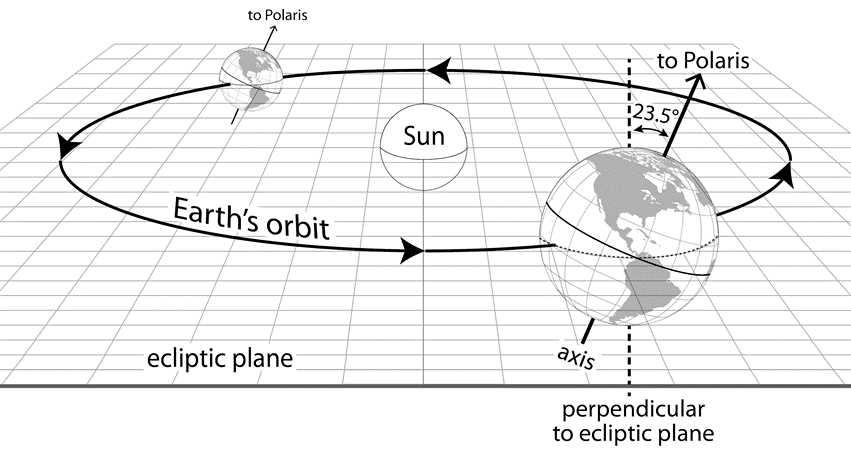
Earth revolves around the Sun every 365.25 days, which we consider to be one year. This orbit is not a perfect circle as we might imagine; it is actually an elliptical orbit (Figure 3.2). In one revolution, Earth travels approximately 940 million kilometers (584 million miles)! Because Earth is traveling in an elliptical orbit, it is closer to the Sun on or around January 3 (known as perihelion) than it is on or around July 4 (known as aphelion). At perihelion, Earth is 147.5 million kilometers (approximately 91 million miles) from the Sun and at aphelion Earth is 152.6 million kilometers (approximately 95 million miles) from the Sun. Tip: to help you remember that aphelion occurs when Earth is furthest away from the Sun, think of the “a” in aphelion as further “away”.

3. Tilt
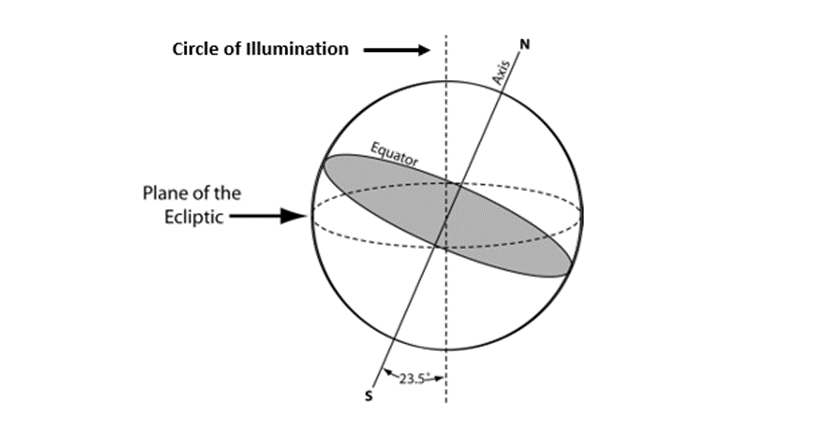
Currently, the axis of the Earth is tilted at 23.5°. Earth revolves around the Sun on an imaginary straight line known as the plane of the ecliptic (Figure 3.3).
4. Polarity
While Earth’s axis is currently pointing toward Polaris, known as the North Star, the top of the Earth or the North Pole is not always orientated toward the Sun. As you can see in Figure 3.3 sometimes the North Pole is orientated toward the Sun and other times it is orientated away from the Sun. This phenomenon influences the amount of daylight received by the Earth at various latitudes, known as daylength.
5. Shape
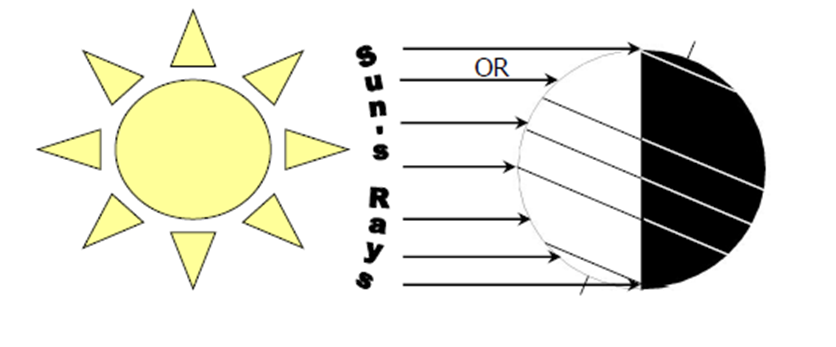
Earth is an oblate sphere and like all spheres, its surface is curved. This means that the Sun's rays strike the Earth at different angles for each latitude. As you can see in Figure 3.4, the Sun’s rays strike the Earth at the center (equator) directly, almost at 90°, while they strike toward the poles at a lower angle, more like 10° or 20°. Because the Earth is curved, the angle of incidence (the angle of the Sun’s rays) varies by latitude. And, because the Earth is titled, the angle of incidence also varies by season.

 Pin It! Annual March of the Seasons
Ever wonder why Earth has different seasons and variations in daylength? This video, Why Do We Have Different Seasons?, by the California Academy of Sciences demonstrates how Earth’s tilt and its revolution around the Sun influence the annual march of the seasons. Understanding the reasons for the seasons is important to know for your physical geography class. (Video length is 3:17).
The Sun’s vertical rays strike the Earth at the equator (0°) on the March equinox (March 20) and the September equinox (September 21). The March equinox is known as spring in the northern hemisphere and fall in the southern hemisphere, while the September equinox is known as fall in the northern hemisphere and spring in the southern hemisphere. During the equinoxes, the circle of illumination bisects all parallels (remember that parallels are lines measured in latitude). This even division creates an equal amount of daylight of exactly 12 hours for all latitudes. The circle of illumination can be seen in Figure 3.5.
The Sun’s vertical rays strike the Earth at the Tropic of Cancer (23.5°N), located in the northern hemisphere, on the June solstice (June 22). The Sun’s vertical rays strike the Earth at the Tropic of Capricorn (23.5°S), located in the southern hemisphere, on the December solstice (December 21). The June solstice is known as summer in the northern hemisphere and winter in the southern hemisphere, while the December solstice is known as winter in the northern hemisphere and summer in the southern hemisphere. In addition, both hemispheres experience longer daylength in the summer and shorter daylength in the winter. During the December Solstice the Arctic Circle receives 24 hours of darkness, while the Antarctic Circle receives 24 hours of daylight.
 Pin It! The Milankovitch Cycles
To get a better understanding of how changes in Earth’s orbit can impact climate and weather, watch this cool video on the natural cycles of Earth-Sun relations. These cycles will be important to remember later in the lab class when climate patterns and climate change are discussed. (Video length is 6:34).
Use what you have learned from the reading, your prior knowledge, and the Pin It! Annual March of the Seasons to answer the questions below.
- In which hemisphere do you currently live?
- On August 16th:
- What season are you experiencing?
- What is the daylength like during this season?
- What three key observations can you make about your daily routine?
- What activities might you do during this season that you might not do in other seasons? Why?
- On January 16th:
- What season are you experiencing?
- What is the daylength like during this season?
- What three key observations can you make about your daily routine?
- What activities might you do during this season that you might not do in other seasons? Why?
- Identify the seven special parallels of Earth and their latitude. Write each special parallel along with its degree latitude on the correct line on the diagram of the Earth (Figure 3.6). Use the following parallels and degrees:
- North Pole, 90°N
- South Pole, 90°S
- Tropic of Cancer, 23.5°N
- Tropic of Capricorn, 23.5°S
- Arctic Circle, 66.5°N
- Antarctic Circle, 66.5°S
- Equator, 0°

- Figure 3.7 shows Earth’s complete revolution around the Sun.
- Label the approximate point in the elliptical revolution when the perihelion and aphelion occur.
- Using the terms listed below (i and ii), label the correct equinoxes and solstices that occur during this annual revolution on the top line and the season for the northern hemisphere on the bottom line.
- March equinox, June solstice, September equinox, December solstice
- Season in northern hemisphere: winter, spring (vernal), summer, fall (autumnal)

- During which northern hemisphere season does the Sun’s rays strike the Earth at 23.5°N latitude?
- During which solstice does the south pole experience winter and receive no daylight?
- During which season in the northern hemisphere does Earth experience aphelion?
- During which season in the northern hemisphere does Earth experience perihelion?
- Use Your Critical Thinking Skills: According to your answers for 8 and 9, does distance between the Earth and the Sun determine the seasons of the year? Why or why not? Explain your response in at least one sentence.
As you have learned, Earth’s surface is curved. Therefore, the Sun’s rays strike Earth at different angles depending on latitude. Rays that strike Earth directly at a 90° angle are known as vertical rays (VR), rays that strike Earth at an angle less than 90° are known as oblique rays (OR), and rays that strike Earth at exactly 0° are known as tangent rays (TR). Note that there is only one location that experiences vertical rays on a given day, while there are multiple latitudes that experience oblique and tangent rays on a given day.
- On Figure 3.8, label each of the remaining seven rays correctly with terms listed below, you can see one has been done for you.
- vertical ray label as VR
- oblique rays label as OR
- tangent rays label as TR
- Refer to Figure 3.8. Study the position of the Earth in relation to the Sun in order to answer the following questions:
- What solstice is represented in this diagram? How can you tell?
- Which hemisphere is experiencing winter?
- Is daylength longer or shorter in the Southern Hemisphere?
- What latitude is the vertical ray striking?
- What parallel is the vertical ray striking?
- What type of ray is striking the equator?
- What type of ray is striking the Antarctic Circle?
As you have just learned, vertical rays are those that strike Earth at 90°. These are the most direct rays. Therefore, the latitudes on Earth that receive vertical rays will receive the most intense insolation compared to other latitudes. The latitude of the Sun's vertical rays is called the declination of the Sun.
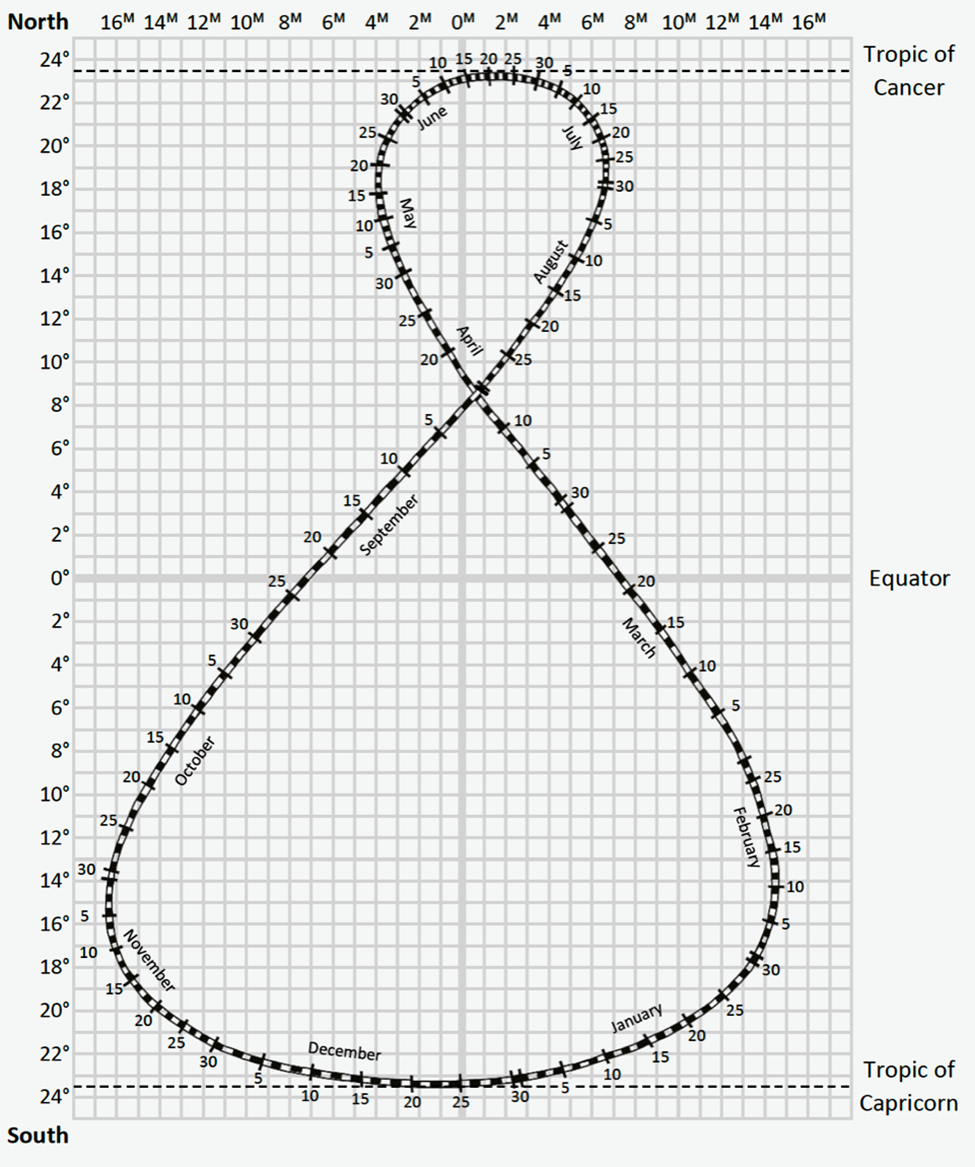
The declination of the Sun changes throughout the year. Let us determine the declination of the Sun for random days of the year so you can see how it changes. To do this, we can use a tool called the analemma (see Figure 3.9). An analemma looks like a figure-eight; it is basically a calendar displaying the Sun’s declination on each day of the year. On the vertical axis of the analemma, you can see the Sun’s declination with values ranging from 24°N to 24°S. Along the figure eight pattern itself, you can see each day of the year. The days of the year are shown with alternating black and white bars along the figure-eight pattern (each bar represents a day). For example, on November 16th, the Sun’s declination is approximately 19°S.
- Why is the analemma’s vertical axis limited to the range of 24°N to 24°S?
 Guided Practice: Using the Analemma
Go step-by-step on how to use the analemma with this video from Scott’s Geography Notebook, Using an Analemma. (Video length is 6:16).
- Use the analemma (Figure 3.9) to determine the Sun’s declination on the following days of the year. Tip: use a ruler or piece of paper to align the date to the vertical axis.
- January 1:
- February 16:
- May 16:
- July 4:
- August 16:
- November 16:
- Write your birthdate and the Sun’s declination on that date:
- Which solstice or equinox occurs closest to your birthdate?
Part B. Angle of Incidence
Angle of incidence is the angle at which Sun’s rays strike Earth’s surface. One way to understand angle of incidence is to think of someone shining a flashlight in your direction. If the flashlight is shining directly in your eyes, the light is intense and you look away. If the flashlight is shining on the ground below you, the light is less intense and you can see clearly. Figure 3.10 shows two angles of incidence represented by flashlights shining on two books.

- Refer to Figure 3.10.
- Does the flashlight on the left or right represent a 90° angle of incidence? (Hint: a 90° angle of incidence is also known as a direct ray or a perpendicular ray.)
- Does the higher or lower angle of incidence result in the flashlight’s energy being distributed over a wider area?
There is a direct relationship between the angle of incidence and the intensity of solar radiation that actually reaches the ground. Higher angles of incidence result in higher percentages of radiation reaching the surface of the Earth. When the angle of incidence is at a 90° angle to the Earth (called direct or perpendicular rays), approximately 75% of the radiation emitted from the Sun reaches the surface of the Earth.
Throughout the year, the angle of the Sun’s rays are low (less than 25°) at the poles, compared to those closer to the equator. As a result, insolation at the poles is spread out over a much wider area as represented by the yellow color on Figure 3.4 (shown previously in this lab). The more spread out the yellow color, the more diffused the radiation will be. The opposite is true at the equator. Throughout the year, the angle of the Sun’s rays at the equator is high (more than 65°) and at the equinoxes sunlight strikes the equator directly, which results in a 90° angle of incidence. Insolation at the equator is not as spread out as it is at the poles; therefore, the radiation is more intense.
- Refer to Figure 3.4 (shown previously in this lab).
- Which latitude has the highest angle of incidence?
- Which latitudes have the lowest angles of incidence?
- Apply What You Learned: Does this diagram represent the March equinox, June solstice, September equinox, or December solstice? Explain your response in one sentence.
Table 3.1 provides angle of incidence data for the special lines of latitude at the solstices and equinoxes. The data represent the angle of incidence at solar noon.
| Latitude | March Equinox | June Solstice | September Equinox | December Solstice |
|---|---|---|---|---|
| 90°N | 0° | 23.5° | 0° | 0° |
| 66.5°N | 23.5° | 47° | 23.5° | 0° |
| 23.5°N | 66.5° | 90° | 66.5° | 43° |
| 0° | 90° | 66.5° | 90° | 66.5° |
| 23.5°S | 66.5° | 43° | 66.5° | 90° |
| 66.5°S | 23.5° | 0° | 23.5° | 47° |
| 90°S | 0° | 0° | 0° | 23.5° |
- Refer to Table 3.1 above. On Figure 3.11 below, draw a Sun to represent the correct angle of incidence for each time of year at the equator. The Sun location at the March equinox has already been drawn for you.

- Refer to Table 3.1 above. On Figure 3.12 below, draw a Sun to represent the correct angle of incidence for each time of year at the Tropic of Cancer.

- Refer to Table 3.1 above. On Figure 3.13 below, draw a Sun to represent the correct angle of incidence for each time of year at the Arctic Circle.

- Refer to Table 3.1 above. On Figure 3.14 below, draw a Sun to represent the correct angle of incidence for each time of year at the North Pole.

- Refer to your completed Figures 3.11 through 3.14.
- Which latitude has the highest angle of incidence year-round?
- Which latitude has the lowest angle of incidence year-round?
- In one sentence, describe how the angles of incidence change throughout the year for the Tropic of Cancer.
- Apply What You Learned: When would the radiation intensity be highest for the Arctic Circle?
The amount of sunlight that strikes the Earth's surface in an hour and a half is enough to handle the entire world's energy consumption for a full year. Solar technologies convert sunlight into electrical energy either through photovoltaic (PV) panels or through mirrors that concentrate solar radiation. This energy can be used to generate electricity or be stored in batteries or thermal storage.[52] Solar panel installations require an understanding of the angle of incidence. The Solar Electricity Handbook (2019, n.p.) says “to get the best out of your photovoltaic panels, you need to angle them towards the Sun. The optimum angle varies throughout the year, depending on the seasons and your location”. If you lived at the Equator, you would want to lay your solar panel flat on the ground (at a 0° angle) during the equinoxes so that the maximum radiation is received.
- Apply What You Learned: Imagine that you want to install a solar panel at your latitude. At what angle(s) would you orientate the solar panel in order to maximize the amount of radiation that is received? Would you install the solar panels in a stationary position, or would you allow for the solar panels to move throughout the year? Explain your response in two to three sentences. Tip: estimate the angle of incidence at your latitude based on the data provided in Table 3.1. Hint: it may be easiest to sketch the surface of the Earth, your solar panel, and the estimated angle of incidence in order to respond to these questions.
Part C. Calculating Solar Altitude
The solar altitude (SA), also called the angle of the noon Sun, represents the elevation of the noon Sun in the sky. Another way of understanding this is to think of the SA as the point at which the Sun is highest in the sky at noon. The arc distance (AD) is the number of degrees of latitude between the latitude you are determining the SA for and the declination of the Sun. The equation to determine the SA for a given location is:
SA = 90 - AD
The following steps demonstrate how to calculate solar altitude at a particular location on a particular day. For the example, we will use November 1st and the latitude of 33°N in the following example:
Step 1
Use the analemma (Figure 3.9, shown previously in the lab) to determine the declination of the Sun for the day of the year in question.
November 1st = 14°S
Step 2
Calculate the arc distance between the declination of the Sun and the latitude for which you are determining the SA. To do this, take the latitude in question and add or subtract the declination of the Sun. Remember to pay attention to the latitude’s designated hemisphere (north or south). See Figure 3.15 for examples on how to calculate the arc distance for latitudes with the same hemisphere and those with opposite hemispheres. Note: values of the latitudes always remain positive in the equation, regardless of whether they are in the southern or northern hemisphere.
14° + 33° = 47 arc degrees (Refer to the bottom diagram of Figure 3.15).

Step 3
Calculate the SA by subtracting the arc distance from 90°. Remember, the equation from above is SA = 90°- AD.
90° - AD = SA
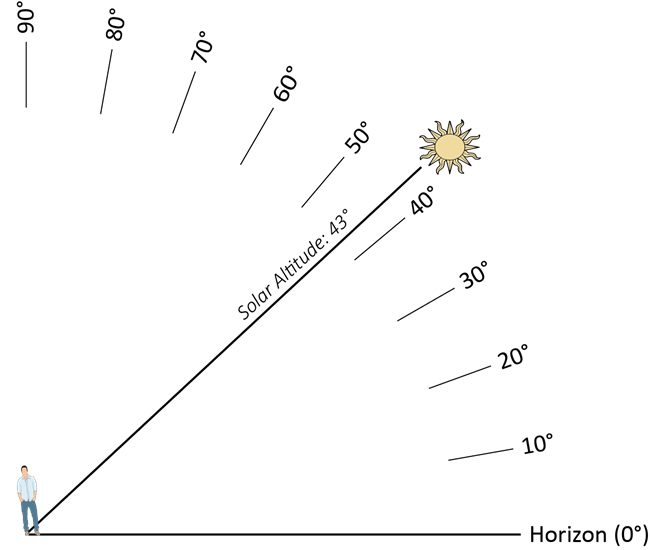
90° - 47° = 43°
On November 1st at 33°N, SA = 43°
Check out the diagram below (Figure 3.16). It shows where the noon Sun is in the sky on November 1st at 33°N.
 Guided Practice: Calculating Solar Altitude
This video, Calculating Solar Altitude, goes through the above example step-by-step, and provides an explanation of what to do when the declination of the Sun and the particular latitude happen to be in the same hemisphere. (Video length is 2:54).
- Use the SA equation and the analemma to calculate the Sun’s declination, arc distance (AD), and SA for the dates and latitudes shown in Table 3.2. Show your work in the space provided in the table. The first row has been done as an example.
| Date | Latitude | Declination of the Sun | Arc Distance (AD) | Solar Altitude (SA) |
|---|---|---|---|---|
| April 8th | 30°S | 6°N | AD = 30° + 6° = 36° | SA = 90° - AD SA = 90° - 36° SA = 54° |
| July 17th | 15°N | |||
| October 31st | 65°S | |||
| December 7th | 50°N |
- Use the information from Table 3.2 and draw the Sun in its correct place in the sky for each of the following four dates: April 8th, July 17th, October 31st, and December 7th. Use Figure 3.16 as a model for your diagrams and write captions with the same information shown in Figure 3.16.
- April 8th:
- July 17th:
- October 31st:
- December 7th:
Part D. Daylength Analysis
Table 3.3 shows the daylength for various locations on Earth on selected days of the year. The dates February 16th, May 16th, August 16th, and November 16th were chosen at random and do not align with the solstices and equinoxes to give you an idea of daylength during other times of the year. You found the declination of the Sun for these dates earlier in this lab.
- Apply What You Learned: Add the daylength information for the North Pole and South Pole into Table 3.3.
| Location (approximate latitude) | February 16th | May 16th | August 16th |
November 16th |
|---|---|---|---|---|
| North Pole (90°N) | ||||
| White Horse, Canada (60°N) | 8.78 | 16.81 | 15.36 | 7.09 |
| Tokyo, Japan (35°N) | 10.73 | 13.84 | 13.32 | 10.13 |
| Addis Ababa, Ethiopia (10°N) | 11.68 | 12.46 | 12.33 | 11.53 |
| Quito, Ecuador (0°) | 12.00 | 12.00 | 12.00 | 12.00 |
| Palmas, Brazil (10°S) | 12.32 | 11.54 | 11.67 | 12.47 |
| Canberra, Australia (35°S) | 13.27 | 10.16 | 10.68 | 13.87 |
| South Pole (90°S) |
- Refer to Table 3.3.
- Use Your Critical Thinking Skills: Why does Table 3.3 have a specific location for 60°N but no location for 60°S? Hint: look at a globe, an atlas, or Google Earth!
- Use Your Critical Thinking Skills: If a specific location had been provided for 60°S, would daylength at that location be similar to the daylength for 60°N? Explain why or why not in one to two sentences.
- Other than the poles, which of the eight locations has the greatest variation in daylength throughout the year? Explain why in one to two sentences. Tip: for each location, subtract the largest daylength number from the smallest to find the variation in daylength at that latitude.
- Other than the equator, which of the eight locations has the least variation in daylength throughout the year? Explain why in one to two sentences.
- Canberra and Tokyo are both located at a general latitude of 35°, however, their daylengths are different from each other on each of the four dates. Explain why in one to two sentences.
- On which date(s) does Palmas have a longer daylength than the equator? What are the seasons of these dates for Palmas?
- Does the equator have seasons? Why or why not?
- Find the latitude of your home city on a map, globe, or the internet.
- Which of the eight locations listed are you closest in latitude to?
- Apply What You Learned: Based on what you have learned so far, explain how daylength would vary for your city. Explain your response in two to three sentences.
- Use Your Critical Thinking Skills: Now that you have determined the declination of the Sun and daylength for February 16th, May 16th, August 16th, and November 16th, what connection can you make between the declination of the Sun and daylength for these dates? Explain your response in one to two sentences.
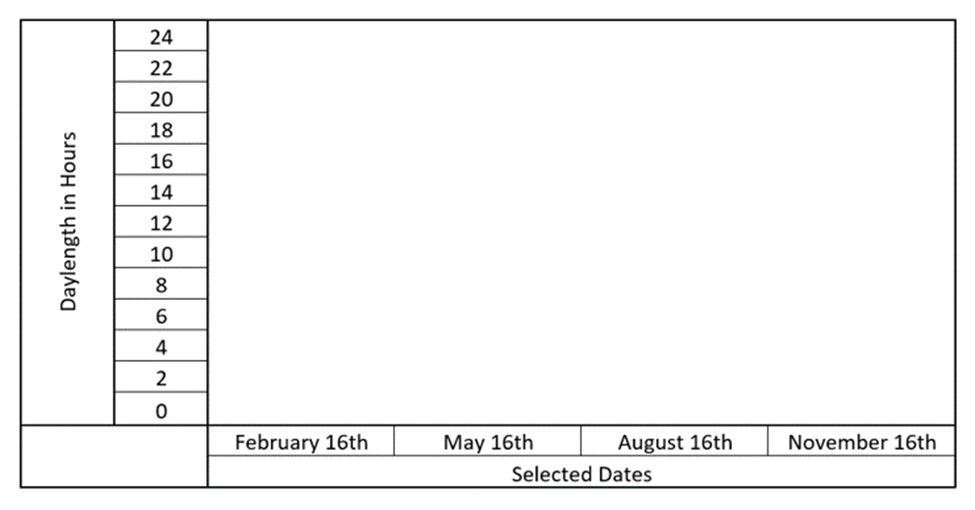
- Using the data from your completed Table 3.3, create a line graph on Figure 3.17 that shows daylength for each season for the South Pole, White Horse, Quito, and Canberra. Create a key for your graph; be sure to use a different color for each of the four locations.
- Refer to your completed Figure 3.17. Tip: when appropriate, be sure to discuss the title of the Earth or the circle of illumination in your responses.
- Discuss how daylength changes throughout the year for each of the four locations and why those changes occur. Provide a detailed answer that is three to four sentences in length.
- How does the data for the South Pole vary from the other three locations you graphed?
- During which season does White Horse have the longest daylength?
- How would you explain the seasonal variation for Quito, a city located on the equator?
- Of the four locations you graphed, which one would you like to live in year-round? Why? Explain your response in at least one sentence.
- Use Your Critical Thinking Skills: How could farming and other food services be impacted at latitudes with significantly less daylength throughout the year? Explain your response in at least one sentence.
- Use Your Critical Thinking Skills: If you lived on or near the equator, do you think it would be valuable for you to use renewable energy (solar and wind) versus nonrenewable energy (gas and oil)? Why or why not? Explain your response in at least one sentence.
Part E. Wrap-Up
Consult with your geography lab instructor to find out which of the following wrap-up questions you should complete. Attach additional pages to answer the questions as needed.
- What is the most important idea that you learned in this lab? In two to three sentences, explain the concept and why it is important to know.
- What was the most challenging part of this lab? In two to three sentences, explain why it was challenging. If nothing challenged you in the lab, write about what you think challenged your classmates.
- What is one question that you have about what you learned in this lab? Write your question along with one to two sentences explaining why you think your question is important to ask.
- Review the learning objectives on page 1 of this lab. How would you rate your understanding or ability for each learning objective? Write one sentence that addresses each learning objective.
- Sketch a concept map that includes the key ideas from this lab. Include at least five of the terms shown in bold-faced type.
- Create an advertisement to educate your peers on the important information that you learned in this lab. Include at least three key terms in your advertisement. The advertisement should be about half a page in size (about 4 inches by 6 inches).
- One way to think of physical geography is that it is the study of the relationships among variables that impact the Earth's surface. Select two variables discussed in this lab and describe how they are related.
- How does what you learned in this lab relate to your everyday life? In two to three sentences, explain a concept that you learned in this lab and how it relates to your day-to-day actions.
- How does what you learned in this lab relate to current events?
- Write the title, source, and date of a news item that relates to this lab.
- In two to three sentences, discuss how the news item relates to what you have learned in this lab.
- In one to two sentences, discuss whether or not the news item accurately represents the science that you learned. Tip: consider whether or not the news item includes the complexity of the topic.
- Search O*NET OnLine to find an occupation that is relevant to the topics presented in today's lab. Your lab instructor may provide you with possible keywords to type in the Occupation Quick Search field on the O*NET website.
- What is the name of the occupation that you found?
- Write two to three sentences that summarize the most important information that you learned about this occupation.
- What is one question that you would want to ask a person with this occupation?
[38] Text adapted from NASA is in the public domain
[52] Text by U.S. Department of Energy is in the public domain