
2.2: Map Scale, Coordinate Systems, and Map Projections
- Page ID
- 6309
\( \newcommand{\vecs}[1]{\overset { \scriptstyle \rightharpoonup} {\mathbf{#1}} } \)
\( \newcommand{\vecd}[1]{\overset{-\!-\!\rightharpoonup}{\vphantom{a}\smash {#1}}} \)
\( \newcommand{\dsum}{\displaystyle\sum\limits} \)
\( \newcommand{\dint}{\displaystyle\int\limits} \)
\( \newcommand{\dlim}{\displaystyle\lim\limits} \)
\( \newcommand{\id}{\mathrm{id}}\) \( \newcommand{\Span}{\mathrm{span}}\)
( \newcommand{\kernel}{\mathrm{null}\,}\) \( \newcommand{\range}{\mathrm{range}\,}\)
\( \newcommand{\RealPart}{\mathrm{Re}}\) \( \newcommand{\ImaginaryPart}{\mathrm{Im}}\)
\( \newcommand{\Argument}{\mathrm{Arg}}\) \( \newcommand{\norm}[1]{\| #1 \|}\)
\( \newcommand{\inner}[2]{\langle #1, #2 \rangle}\)
\( \newcommand{\Span}{\mathrm{span}}\)
\( \newcommand{\id}{\mathrm{id}}\)
\( \newcommand{\Span}{\mathrm{span}}\)
\( \newcommand{\kernel}{\mathrm{null}\,}\)
\( \newcommand{\range}{\mathrm{range}\,}\)
\( \newcommand{\RealPart}{\mathrm{Re}}\)
\( \newcommand{\ImaginaryPart}{\mathrm{Im}}\)
\( \newcommand{\Argument}{\mathrm{Arg}}\)
\( \newcommand{\norm}[1]{\| #1 \|}\)
\( \newcommand{\inner}[2]{\langle #1, #2 \rangle}\)
\( \newcommand{\Span}{\mathrm{span}}\) \( \newcommand{\AA}{\unicode[.8,0]{x212B}}\)
\( \newcommand{\vectorA}[1]{\vec{#1}} % arrow\)
\( \newcommand{\vectorAt}[1]{\vec{\text{#1}}} % arrow\)
\( \newcommand{\vectorB}[1]{\overset { \scriptstyle \rightharpoonup} {\mathbf{#1}} } \)
\( \newcommand{\vectorC}[1]{\textbf{#1}} \)
\( \newcommand{\vectorD}[1]{\overrightarrow{#1}} \)
\( \newcommand{\vectorDt}[1]{\overrightarrow{\text{#1}}} \)
\( \newcommand{\vectE}[1]{\overset{-\!-\!\rightharpoonup}{\vphantom{a}\smash{\mathbf {#1}}}} \)
\( \newcommand{\vecs}[1]{\overset { \scriptstyle \rightharpoonup} {\mathbf{#1}} } \)
\(\newcommand{\longvect}{\overrightarrow}\)
\( \newcommand{\vecd}[1]{\overset{-\!-\!\rightharpoonup}{\vphantom{a}\smash {#1}}} \)
\(\newcommand{\avec}{\mathbf a}\) \(\newcommand{\bvec}{\mathbf b}\) \(\newcommand{\cvec}{\mathbf c}\) \(\newcommand{\dvec}{\mathbf d}\) \(\newcommand{\dtil}{\widetilde{\mathbf d}}\) \(\newcommand{\evec}{\mathbf e}\) \(\newcommand{\fvec}{\mathbf f}\) \(\newcommand{\nvec}{\mathbf n}\) \(\newcommand{\pvec}{\mathbf p}\) \(\newcommand{\qvec}{\mathbf q}\) \(\newcommand{\svec}{\mathbf s}\) \(\newcommand{\tvec}{\mathbf t}\) \(\newcommand{\uvec}{\mathbf u}\) \(\newcommand{\vvec}{\mathbf v}\) \(\newcommand{\wvec}{\mathbf w}\) \(\newcommand{\xvec}{\mathbf x}\) \(\newcommand{\yvec}{\mathbf y}\) \(\newcommand{\zvec}{\mathbf z}\) \(\newcommand{\rvec}{\mathbf r}\) \(\newcommand{\mvec}{\mathbf m}\) \(\newcommand{\zerovec}{\mathbf 0}\) \(\newcommand{\onevec}{\mathbf 1}\) \(\newcommand{\real}{\mathbb R}\) \(\newcommand{\twovec}[2]{\left[\begin{array}{r}#1 \\ #2 \end{array}\right]}\) \(\newcommand{\ctwovec}[2]{\left[\begin{array}{c}#1 \\ #2 \end{array}\right]}\) \(\newcommand{\threevec}[3]{\left[\begin{array}{r}#1 \\ #2 \\ #3 \end{array}\right]}\) \(\newcommand{\cthreevec}[3]{\left[\begin{array}{c}#1 \\ #2 \\ #3 \end{array}\right]}\) \(\newcommand{\fourvec}[4]{\left[\begin{array}{r}#1 \\ #2 \\ #3 \\ #4 \end{array}\right]}\) \(\newcommand{\cfourvec}[4]{\left[\begin{array}{c}#1 \\ #2 \\ #3 \\ #4 \end{array}\right]}\) \(\newcommand{\fivevec}[5]{\left[\begin{array}{r}#1 \\ #2 \\ #3 \\ #4 \\ #5 \\ \end{array}\right]}\) \(\newcommand{\cfivevec}[5]{\left[\begin{array}{c}#1 \\ #2 \\ #3 \\ #4 \\ #5 \\ \end{array}\right]}\) \(\newcommand{\mattwo}[4]{\left[\begin{array}{rr}#1 \amp #2 \\ #3 \amp #4 \\ \end{array}\right]}\) \(\newcommand{\laspan}[1]{\text{Span}\{#1\}}\) \(\newcommand{\bcal}{\cal B}\) \(\newcommand{\ccal}{\cal C}\) \(\newcommand{\scal}{\cal S}\) \(\newcommand{\wcal}{\cal W}\) \(\newcommand{\ecal}{\cal E}\) \(\newcommand{\coords}[2]{\left\{#1\right\}_{#2}}\) \(\newcommand{\gray}[1]{\color{gray}{#1}}\) \(\newcommand{\lgray}[1]{\color{lightgray}{#1}}\) \(\newcommand{\rank}{\operatorname{rank}}\) \(\newcommand{\row}{\text{Row}}\) \(\newcommand{\col}{\text{Col}}\) \(\renewcommand{\row}{\text{Row}}\) \(\newcommand{\nul}{\text{Nul}}\) \(\newcommand{\var}{\text{Var}}\) \(\newcommand{\corr}{\text{corr}}\) \(\newcommand{\len}[1]{\left|#1\right|}\) \(\newcommand{\bbar}{\overline{\bvec}}\) \(\newcommand{\bhat}{\widehat{\bvec}}\) \(\newcommand{\bperp}{\bvec^\perp}\) \(\newcommand{\xhat}{\widehat{\xvec}}\) \(\newcommand{\vhat}{\widehat{\vvec}}\) \(\newcommand{\uhat}{\widehat{\uvec}}\) \(\newcommand{\what}{\widehat{\wvec}}\) \(\newcommand{\Sighat}{\widehat{\Sigma}}\) \(\newcommand{\lt}{<}\) \(\newcommand{\gt}{>}\) \(\newcommand{\amp}{&}\) \(\definecolor{fillinmathshade}{gray}{0.9}\)- The objective of this section is to describe and discuss the concepts of map scale, coordinate systems, and map projections and explain why they are central to maps, mapping, and geographic information systems (GISs).
All map users and map viewers have certain expectations about what is contained on a map. Such expectations are formed and learned from previous experience by working with maps. It is important to note that such expectations also change with increased exposure to maps. Understanding and meeting the expectations of map viewers is a challenging but necessary task because such expectations provide a starting point for the creation of any map.
The central purpose of a map is to provide relevant and useful information to the map user. In order for a map to be of value, it must convey information effectively and efficiently. Mapping conventions facilitate the delivery of information in such a manner by recognizing and managing the expectations of map users. Generally speaking, mapping or cartographic conventions refer to the accepted rules, norms, and practices behind the making of maps. One of the most recognized mapping conventions is that “north is up” on most maps. Though this may not always be the case, many map users expect north to be oriented or to coincide with the top edge of a map or viewing device like a computer monitor.
Several other formal and informal mapping conventions and characteristics, many of which are taken for granted, can be identified. Among the most important cartographic considerations are map scale, coordinate systems, and map projections. Map scale is concerned with reducing geographical features of interest to manageable proportions, coordinate systems help us define the positions of features on the surface of the earth, and map projections are concerned with moving from the three-dimensional world to the two dimensions of a flat map or display, all of which are discussed in greater detail in this chapter.
Map Scale
The world is a big place…really big. One of the challenges behind mapping the world and its resident features, patterns, and processes is reducing it to a manageable size. What exactly is meant by “manageable” is open to discussion and largely depends on the purpose and needs of the map at hand. Nonetheless, all maps reduce or shrink the world and its geographic features of interest by some factor. Map scale refers to the factor of reduction of the world so it fits on a map.
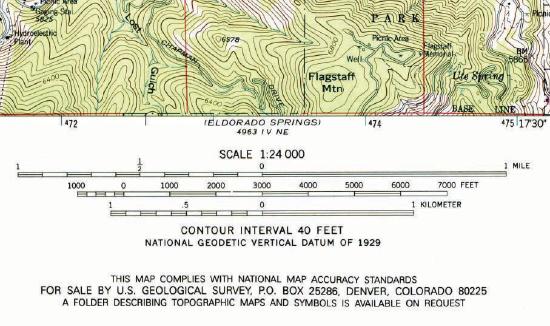
Map scale can be represented by text, a graphic, or some combination of the two. For example, it is common to see “one inch represents one kilometer” or something similar written on a map to give map users an idea of the scale of the map. Map scale can also be portrayed graphically with what is called a scale bar. Scale bars are usually used on reference maps and allow map users to approximate distances between locations and features on a map, as well as to get an overall idea of the scale of the map.
The representative fraction (RF) describes scale as a simple ratio. The numerator, which is always set to one (i.e., 1), denotes map distance and the denominator denotes ground or “real-world” distance. One of the benefits of using a representative fraction to describe scale is that it is unit neutral. In other words, any unit of measure can be used to interpret the map scale. Consider a map with an RF of 1:10,000. This means that one unit on the map represents 10,000 units on the ground. Such units could be inches, centimeters, or even pencil lengths; it really does not matter.
Map scales can also be described as either “small” or “large.” Such descriptions are usually made in reference to representative fractions and the amount of detail represented on a map. For instance, a map with an RF of 1:1,000 is considered a large-scale map when compared to a map with an RF of 1:1,000,000 (i.e., 1:1,000 > 1:1,000,000). Furthermore, while the large-scale map shows more detail and less area, the small-scale map shows more area but less detail. Clearly, determining the thresholds for small- or large-scale maps is largely a judgment call.
All maps possess a scale, whether it is formally expressed or not. Though some say that online maps and GISs are “scaleless” because we can zoom in and out at will, it is probably more accurate to say that GISs and related mapping technology are multiscalar. Understanding map scale and its overall impact on how the earth and its features are represented is a critical part of both map making and GISs.
Coordinate Systems
Just as all maps have a map scale, all maps have locations, too. Coordinate systems are frameworks that are used to define unique positions. For instance, in geometry we use x (horizontal) and y (vertical) coordinates to define points on a two-dimensional plane. The coordinate system that is most commonly used to define locations on the three-dimensional earth is called the geographic coordinate system (GCS), and it is based on a sphere or spheroid. A spheroid (a.k.a. ellipsoid) is simply a sphere that is slightly wider than it is tall and approximates more closely the true shape of the earth. Spheres are commonly used as models of the earth for simplicity.
The unit of measure in the GCS is degrees, and locations are defined by their respective latitude and longitude within the GCS. Latitude is measured relative to the equator at zero degrees, with maxima of either ninety degrees north at the North Pole or ninety degrees south at the South Pole. Longitude is measured relative to the prime meridian at zero degrees, with maxima of 180 degrees west or 180 degrees east.
Note that latitude and longitude can be expressed in degrees-minutes-seconds (DMS) or in decimal degrees (DD). When using decimal degrees, latitudes above the equator and longitudes east of the prime meridian are positive, and latitudes below the equator and longitudes west of the prime meridian are negative (see the following table for examples).
| Nominal location | Absolute location (DMS) | Absolute location (DD) |
|---|---|---|
| Los Angeles, US | 34° 3′ North, 118° 15′ West | +34.05, –118.25 |
| Mumbai, India | 18° 58′ North, 72° 49′ East | +18.975, +72.8258 |
| Sydney, Australia | 33° 51′ South, 151° 12′ East | –33.859, 151.211 |
| Sao Paolo, Brazil | 23° 33′ South, 46° 38′ West | –23.550, –46.634 |
Converting from DMS to DD is a relatively straightforward exercise. For example, since there are sixty minutes in one degree, we can convert 118° 15 minutes to 118.25 (118 + 15/60). Note that an online search of the term “coordinate conversion” will return several coordinate conversion tools.
When we want to map things like mountains, rivers, streets, and buildings, we need to define how the lines of latitude and longitude will be oriented and positioned on the sphere. A datum serves this purpose and specifies exactly the orientation and origins of the lines of latitude and longitude relative to the center of the earth or spheroid.
Depending on the need, situation, and location, there are several datums to choose from. For instance, local datums try to match closely the spheroid to the earth’s surface in a local area and return accurate local coordinates. A common local datum used in the United States is called NAD83 (i.e., North American Datum of 1983). For locations in the United States and Canada, NAD83 returns relatively accurate positions, but positional accuracy deteriorates when outside of North America.
The global WGS84 datum (i.e., World Geodetic System of 1984) uses the center of the earth as the origin of the GCS and is used for defining locations across the globe. Because the datum uses the center of the earth as its origin, locational measurements tend to be more consistent regardless where they are obtained on the earth, though they may be less accurate than those returned by a local datum. Note that switching between datums will alter the coordinates (i.e., latitude and longitude) for all locations of interest.
Map Projections
Previously we noted that the earth is really big. Not only is it big, but it is a big round spherical shape called a spheroid. A globe is a very common and very good representation of the three-dimensional, spheroid earth. One of the problems with globes, however, is that they are not very portable (i.e., you cannot fold a globe and put in it in your pocket), and their small scale makes them of limited practical use (i.e., geographic detail is sacrificed). To overcome these issues, it is necessary to transform the three-dimensional shape of the earth to a two-dimensional surface like a flat piece of paper, computer screen, or mobile device display in order to obtain more useful map forms and map scales. Enter the map projection.
Map projections refer to the methods and procedures that are used to transform the spherical three-dimensional earth into two-dimensional planar surfaces. Specifically, map projections are mathematical formulas that are used to translate latitude and longitude on the surface of the earth to x and y coordinates on a plane. Since there are an infinite number of ways this translation can be performed, there are an infinite number of map projections. The mathematics behind map projections are beyond the scope of this introductory overview (but see Robinson et al. 1995; Muehrcke and Muehrcke 1998),Muehrcke, P., and J. Muehrcke. 1998. Map Use. Madison, WI: JP Publications. and for simplicity, the following discussion focuses on describing types of map projections, the distortions inherent to map projections, and the selection of appropriate map projections.
To illustrate the concept of a map projection, imagine that we place a light bulb in the center of a translucent globe. On the globe are outlines of the continents and the lines of longitude and latitude called the graticule. When we turn the light bulb on, the outline of the continents and the graticule will be “projected” as shadows on the wall, ceiling, or any other nearby surface. This is what is meant by map “projection.”
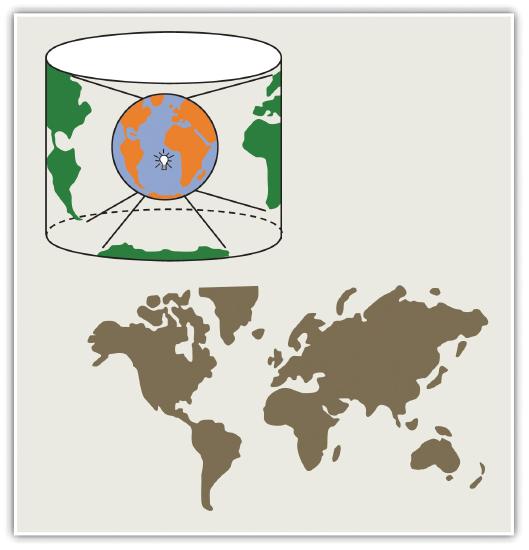
Within the realm of maps and mapping, there are three surfaces used for map projections (i.e., surfaces on which we project the shadows of the graticule). These surfaces are the plane, the cylinder, and the cone. Referring again to the previous example of a light bulb in the center of a globe, note that during the projection process, we can situate each surface in any number of ways. For example, surfaces can be tangential to the globe along the equator or poles, they can pass through or intersect the surface, and they can be oriented at any number of angles.
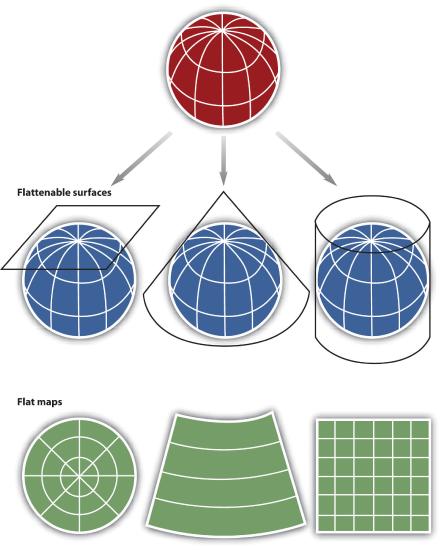
In fact, naming conventions for many map projections include the surface as well as its orientation. For example, as the name suggests, “planar” projections use the plane, “cylindrical” projections use cylinders, and “conic” projections use the cone. For cylindrical projections, the “normal” or “standard” aspect refers to when the cylinder is tangential to the equator (i.e., the axis of the cylinder is oriented north–south). When the axis of the cylinder is perfectly oriented east–west, the aspect is called “transverse,” and all other orientations are referred to as “oblique.” Regardless the orientation or the surface on which a projection is based, a number of distortions will be introduced that will influence the choice of map projection.
When moving from the three-dimensional surface of the earth to a two-dimensional plane, distortions are not only introduced but also inevitable. Generally, map projections introduce distortions in distance, angles, and areas. Depending on the purpose of the map, a series of trade-offs will need to be made with respect to such distortions.
Map projections that accurately represent distances are referred to as equidistant projections. Note that distances are only correct in one direction, usually running north–south, and are not correct everywhere across the map. Equidistant maps are frequently used for small-scale maps that cover large areas because they do a good job of preserving the shape of geographic features such as continents.
Maps that represent angles between locations, also referred to as bearings, are called conformal. Conformal map projections are used for navigational purposes due to the importance of maintaining a bearing or heading when traveling great distances. The cost of preserving bearings is that areas tend to be quite distorted in conformal map projections. Though shapes are more or less preserved over small areas, at small scales areas become wildly distorted. The Mercator projection is an example of a conformal projection and is famous for distorting Greenland.
As the name indicates, equal area or equivalent projections preserve the quality of area. Such projections are of particular use when accurate measures or comparisons of geographical distributions are necessary (e.g., deforestation, wetlands). In an effort to maintain true proportions in the surface of the earth, features sometimes become compressed or stretched depending on the orientation of the projection. Moreover, such projections distort distances as well as angular relationships.
As noted earlier, there are theoretically an infinite number of map projections to choose from. One of the key considerations behind the choice of map projection is to reduce the amount of distortion. The geographical object being mapped and the respective scale at which the map will be constructed are also important factors to think about. For instance, maps of the North and South Poles usually use planar or azimuthal projections, and conical projections are best suited for the middle latitude areas of the earth. Features that stretch east–west, such as the country of Russia, are represented well with the standard cylindrical projection, while countries oriented north–south (e.g., Chile, Norway) are better represented using a transverse projection.
If a map projection is unknown, sometimes it can be identified by working backward and examining closely the nature and orientation of the graticule (i.e., grid of latitude and longitude), as well as the varying degrees of distortion. Clearly, there are trade-offs made with regard to distortion on every map. There are no hard-and-fast rules as to which distortions are more preferred over others. Therefore, the selection of map projection largely depends on the purpose of the map.
Within the scope of GISs, knowing and understanding map projections are critical. For instance, in order to perform an overlay analysis like the one described earlier, all map layers need to be in the same projection. If they are not, geographical features will not be aligned properly, and any analyses performed will be inaccurate and incorrect. Most GISs include functions to assist in the identification of map projections, as well as to transform between projections in order to synchronize spatial data. Despite the capabilities of technology, an awareness of the potential and pitfalls that surround map projections is essential.
Key Takeaways
- Map scale refers to the factor by which the real world is reduced to fit on a map.
- A GIS is multiscalar.
- Map projections are mathematical formulas used to transform the three-dimensional earth to two dimensions (e.g., paper maps, computer monitors).
- Map projections introduce distortions in distance, direction, and area.
Exercises
- Determine and discuss the most appropriate representative fractions for the following verbal map scale descriptions: individual, neighborhood, urban, regional, national, and global.
- Go to the National Atlas website and read about map projections (nationalatlas.gov/articles/mapping/a_projections.html). Define the following terms: datum, developable surface, secant, azimuth, rhumb line, and zenithal.
- Describe the general properties of the following projections: Universe Transverse Mercator (UTM), State plane system, and Robinson projection.
- What are the scale, projection, and contour interval of the USGS topographic map that you downloaded for your place of residence?
- Find the latitude and longitude of your hometown. Explain how you can convert the coordinates from DD to DMS or vice versa.