
7.9: Weather Systems
- Page ID
- 45560
\( \newcommand{\vecs}[1]{\overset { \scriptstyle \rightharpoonup} {\mathbf{#1}} } \)
\( \newcommand{\vecd}[1]{\overset{-\!-\!\rightharpoonup}{\vphantom{a}\smash {#1}}} \)
\( \newcommand{\dsum}{\displaystyle\sum\limits} \)
\( \newcommand{\dint}{\displaystyle\int\limits} \)
\( \newcommand{\dlim}{\displaystyle\lim\limits} \)
\( \newcommand{\id}{\mathrm{id}}\) \( \newcommand{\Span}{\mathrm{span}}\)
( \newcommand{\kernel}{\mathrm{null}\,}\) \( \newcommand{\range}{\mathrm{range}\,}\)
\( \newcommand{\RealPart}{\mathrm{Re}}\) \( \newcommand{\ImaginaryPart}{\mathrm{Im}}\)
\( \newcommand{\Argument}{\mathrm{Arg}}\) \( \newcommand{\norm}[1]{\| #1 \|}\)
\( \newcommand{\inner}[2]{\langle #1, #2 \rangle}\)
\( \newcommand{\Span}{\mathrm{span}}\)
\( \newcommand{\id}{\mathrm{id}}\)
\( \newcommand{\Span}{\mathrm{span}}\)
\( \newcommand{\kernel}{\mathrm{null}\,}\)
\( \newcommand{\range}{\mathrm{range}\,}\)
\( \newcommand{\RealPart}{\mathrm{Re}}\)
\( \newcommand{\ImaginaryPart}{\mathrm{Im}}\)
\( \newcommand{\Argument}{\mathrm{Arg}}\)
\( \newcommand{\norm}[1]{\| #1 \|}\)
\( \newcommand{\inner}[2]{\langle #1, #2 \rangle}\)
\( \newcommand{\Span}{\mathrm{span}}\) \( \newcommand{\AA}{\unicode[.8,0]{x212B}}\)
\( \newcommand{\vectorA}[1]{\vec{#1}} % arrow\)
\( \newcommand{\vectorAt}[1]{\vec{\text{#1}}} % arrow\)
\( \newcommand{\vectorB}[1]{\overset { \scriptstyle \rightharpoonup} {\mathbf{#1}} } \)
\( \newcommand{\vectorC}[1]{\textbf{#1}} \)
\( \newcommand{\vectorD}[1]{\overrightarrow{#1}} \)
\( \newcommand{\vectorDt}[1]{\overrightarrow{\text{#1}}} \)
\( \newcommand{\vectE}[1]{\overset{-\!-\!\rightharpoonup}{\vphantom{a}\smash{\mathbf {#1}}}} \)
\( \newcommand{\vecs}[1]{\overset { \scriptstyle \rightharpoonup} {\mathbf{#1}} } \)
\(\newcommand{\longvect}{\overrightarrow}\)
\( \newcommand{\vecd}[1]{\overset{-\!-\!\rightharpoonup}{\vphantom{a}\smash {#1}}} \)
\(\newcommand{\avec}{\mathbf a}\) \(\newcommand{\bvec}{\mathbf b}\) \(\newcommand{\cvec}{\mathbf c}\) \(\newcommand{\dvec}{\mathbf d}\) \(\newcommand{\dtil}{\widetilde{\mathbf d}}\) \(\newcommand{\evec}{\mathbf e}\) \(\newcommand{\fvec}{\mathbf f}\) \(\newcommand{\nvec}{\mathbf n}\) \(\newcommand{\pvec}{\mathbf p}\) \(\newcommand{\qvec}{\mathbf q}\) \(\newcommand{\svec}{\mathbf s}\) \(\newcommand{\tvec}{\mathbf t}\) \(\newcommand{\uvec}{\mathbf u}\) \(\newcommand{\vvec}{\mathbf v}\) \(\newcommand{\wvec}{\mathbf w}\) \(\newcommand{\xvec}{\mathbf x}\) \(\newcommand{\yvec}{\mathbf y}\) \(\newcommand{\zvec}{\mathbf z}\) \(\newcommand{\rvec}{\mathbf r}\) \(\newcommand{\mvec}{\mathbf m}\) \(\newcommand{\zerovec}{\mathbf 0}\) \(\newcommand{\onevec}{\mathbf 1}\) \(\newcommand{\real}{\mathbb R}\) \(\newcommand{\twovec}[2]{\left[\begin{array}{r}#1 \\ #2 \end{array}\right]}\) \(\newcommand{\ctwovec}[2]{\left[\begin{array}{c}#1 \\ #2 \end{array}\right]}\) \(\newcommand{\threevec}[3]{\left[\begin{array}{r}#1 \\ #2 \\ #3 \end{array}\right]}\) \(\newcommand{\cthreevec}[3]{\left[\begin{array}{c}#1 \\ #2 \\ #3 \end{array}\right]}\) \(\newcommand{\fourvec}[4]{\left[\begin{array}{r}#1 \\ #2 \\ #3 \\ #4 \end{array}\right]}\) \(\newcommand{\cfourvec}[4]{\left[\begin{array}{c}#1 \\ #2 \\ #3 \\ #4 \end{array}\right]}\) \(\newcommand{\fivevec}[5]{\left[\begin{array}{r}#1 \\ #2 \\ #3 \\ #4 \\ #5 \\ \end{array}\right]}\) \(\newcommand{\cfivevec}[5]{\left[\begin{array}{c}#1 \\ #2 \\ #3 \\ #4 \\ #5 \\ \end{array}\right]}\) \(\newcommand{\mattwo}[4]{\left[\begin{array}{rr}#1 \amp #2 \\ #3 \amp #4 \\ \end{array}\right]}\) \(\newcommand{\laspan}[1]{\text{Span}\{#1\}}\) \(\newcommand{\bcal}{\cal B}\) \(\newcommand{\ccal}{\cal C}\) \(\newcommand{\scal}{\cal S}\) \(\newcommand{\wcal}{\cal W}\) \(\newcommand{\ecal}{\cal E}\) \(\newcommand{\coords}[2]{\left\{#1\right\}_{#2}}\) \(\newcommand{\gray}[1]{\color{gray}{#1}}\) \(\newcommand{\lgray}[1]{\color{lightgray}{#1}}\) \(\newcommand{\rank}{\operatorname{rank}}\) \(\newcommand{\row}{\text{Row}}\) \(\newcommand{\col}{\text{Col}}\) \(\renewcommand{\row}{\text{Row}}\) \(\newcommand{\nul}{\text{Nul}}\) \(\newcommand{\var}{\text{Var}}\) \(\newcommand{\corr}{\text{corr}}\) \(\newcommand{\len}[1]{\left|#1\right|}\) \(\newcommand{\bbar}{\overline{\bvec}}\) \(\newcommand{\bhat}{\widehat{\bvec}}\) \(\newcommand{\bperp}{\bvec^\perp}\) \(\newcommand{\xhat}{\widehat{\xvec}}\) \(\newcommand{\vhat}{\widehat{\vvec}}\) \(\newcommand{\uhat}{\widehat{\uvec}}\) \(\newcommand{\what}{\widehat{\wvec}}\) \(\newcommand{\Sighat}{\widehat{\Sigma}}\) \(\newcommand{\lt}{<}\) \(\newcommand{\gt}{>}\) \(\newcommand{\amp}{&}\) \(\definecolor{fillinmathshade}{gray}{0.9}\)dWherever we live, we know from everyday experience that winds do not always blow in the directions of the climatic winds depicted in Figure 7-11. Furthermore, contrary to the average climatic zone characteristics discussed previously, we know that some days are cloudy and rainy, and others are sunny and dry. These short-term variations, called “weather,” are caused by temporal and spatial variability in the motions of air in the atmosphere that can result from local variations in evaporation rate or in heating or cooling of the atmosphere. They can also result from friction as air flows over land or ocean surfaces. We can see this effect by observing how a smooth-flowing stream becomes churned as it interacts with rocks in rapids.
Atmospheric air movements are chaotic, and precise motions of any individual particle of air cannot be predicted (CC11). Therefore, we cannot ever hope to forecast weather precisely. Any forecast will be progressively less reliable the further ahead in time it is made. Weather forecasts made more than a few days ahead are unreliable and always will be. At best, future longer-range weather forecasts will be able to predict only trends in average weather that might occur over many days.
A complete discussion of weather systems is beyond the scope of this book. However, the behavior of high- and low-pressure zones, hurricanes, and extratropical cyclones is described briefly in the sections that follow.
High- and Low-Pressure Zones
Atmospheric pressure at the Earth’s surface varies at any given location from day to day and over distances of tens or hundreds of kilometers across the surface at any given time. Once created, areas of slightly higher or lower pressure, which may cover hundreds or thousands of square kilometers, can persist for days or weeks. Atmospheric high- or low-pressure zones (“highs” and “lows” in weather media jargon) generate winds because air tends to flow on the pressure gradient outward from a high-pressure zone and inward toward a low-pressure zone. The moving air does not flow directly away from a high-pressure zone or toward a low-pressure zone, because the Coriolis Effect deflects the moving air mass (CC12).
The Coriolis Effect deflects moving air cum sole (which means “with the sun”)—that is, to the right in the Northern Hemisphere and to the left in the Southern Hemisphere. Thus, in the Northern Hemisphere, air that flows toward a low-pressure zone is deflected to the right. The deflection continues until the pressure gradient balances the Coriolis Effect. This balance results in a situation known as geostrophic flow, as discussed in CC13. A pattern is established in which winds flow counterclockwise around the low-pressure zone (Fig. 7-26b). Similarly, clockwise winds are established around a high-pressure zone (Fig. 7-26a). In the Southern Hemisphere, winds flow in the opposite direction: clockwise around a low-pressure zone and counterclockwise around a high-pressure zone. Friction between the moving air and the ground or ocean surface reduces the Coriolis deflection. Consequently, winds at, and near, the surface tend to spiral toward the center of low-pressure zones and away from the center of high-pressure zones.
Near-surface winds are influenced by friction and are therefore not true geostrophic winds, but they are in approximate geostrophic balance. As a result, their speed and direction can be reasonably estimated from isobaric charts that show the geographical variations of air pressure (CC13). Therefore, atmospheric pressure is among the most important measurements made at weather stations worldwide, and isobaric charts are a major tool for weather forecasting. Wave height forecasts also can be made from such charts because the relationships among wave height and wind speed, duration, and distance over which the wind blows (called fetch) are known (Chap. 9).

High- and low-pressure zones continuously form and re-form in the atmosphere and vary substantially in size and persistence. Low-pressure zones can be formed over the ocean where slightly higher ocean surface temperatures and/or higher evaporation rates occur. The result is an air mass in the low-pressure zone that has a temperature and water vapor content that is elevated compared to surrounding air. As increasing temperature and water content lead to a decrease in density, this air mass rises as a plume (Fig. 7-26b).
Tropical Cyclones
Tropical cyclones are among the most destructive forces of nature. These intense storms form mostly during local summer or fall in both the Northern and Southern Hemispheres. Tropical cyclones develop over the warm ocean waters of tropical regions where a low-pressure zone develops that draws air inward across the ocean surface. If conditions are favorable, the low-pressure zone deepens (that is, the pressure drops further), and a tropical cyclone may form. In the Indian and western Pacific Oceans, tropical cyclones are called “cyclones” north of the equator and “typhoons” south of the equator. They are also called “baguios” around the Philippines and “willy willys” near Australia (Fig. 7-29). They are known as “hurricanes” only in the Atlantic and eastern Pacific Oceans, but they are the same phenomenon regardless of the name.
Winds in the developing low-pressure system are deflected by the Coriolis effect (Fig. 7-26b) until they flow around the low-pressure zone. Additionally, a centripetal (“center-seeking”) force helps confine motion to a curved path. As the air flows in toward and around the low-pressure zone across the ocean surface, it is warmed, gains moisture, and tends to rise. The winds thus blow toward the center, or “eye,” of the tropical cyclone in a rising helical pattern (Fig. 7-27). Because winds do not reach the eye to alleviate the low pressure, the low-pressure zone continues to intensify. The horizontal pressure gradient increases, and the wind speeds increase (CC13).


A well-formed tropical cyclone has an eye, usually about 20 to 25 km in diameter, within which winds are light and there are few clouds (Fig. 7-27). The eye forms when the low-pressure zone deepens enough to draw warm, relatively dry air downward into the eye, as winds are deflected from the eye in their rising helical pattern (Fig. 7-27). The eye is surrounded by a wall of clouds (the eye wall) where winds are moderate, but intense thunderstorms are created as the rotating air mass rises. Outside the eye wall is a region of intense winds that blow across the ocean surface (Fig. 7-27). The winds are counterclockwise in the Northern Hemisphere and clockwise in the Southern Hemisphere.

Tropical cyclones drift to the west in the prevailing trade wind direction at about 10 to 30 km•h–1, and sometimes faster. Their westward paths are deflected by the Coriolis Effect, and they generally turn away from the equator. Over warm ocean water, hurricanes maintain or gain intensity as high temperatures and high winds encourage evaporation and feed more latent heat energy into the storm. When a hurricane moves over cold water or land, it quickly loses energy and releases its moisture as intense rainfall (10 to 20 billion tonnes of rainfall per day from an average hurricane).
Storm surge, freshwater flooding, wind, tornadoes, and surf and rip currents are all significant tropical cyclone hazards, some occurring far from the storm's landfall. The potentially most destructive and life-threatening effect of a hurricane has historically been the storm surge, or wave that pushes ahead of the storm. Storm surges cause flooding of low-lying coastal areas. However, improved early warning and evacuation procedures have reduced storm surge deaths, and drowning due to inland flooding and landslides caused by wind and rainfall from the tropical cyclone are now the largest cause of cyclone-related deaths in most areas.
The deadliest hurricane in U.S. history was the Galveston hurricane of 1900, that killed 8000 people, followed by the 1928 Okeechobee hurricane, that killed 2500. However, since 1961, satellite imagery and progressively improved forecasting have provided early warnings of approaching storms, which has dramatically reduced loss of lives.
In 1969, Hurricane Camille took more than 250 lives, and most of the victims drowned in the storm surge, which crested at nearly 7.5 m. Camille also caused almost $1.5 billion in damage along the Gulf Coast. Hurricane Hugo, which hit South Carolina in 1988, and Hurricane Andrew, which hit South Florida in 1992, caused much greater damage than Camille but took few lives. Hurricane Andrew is estimated to have caused more than $30 billion in damage. Hurricane Katrina came ashore in Louisiana and Mississippi in 2005, causing more than $125 billion in damage and about 1500 deaths. In 2017, Hurricane Harvey hit Houston, Texas and killed at least 70, followed weeks later by Hurricane Irma that killed 134 as it travelled across Puerto Rico, Cuba, the Bahamas, and South Florida. This was the first year on record when two strong (category 4 on a scale of 1–5) hurricanes made landfall in the continental U.S., and the total damages are estimated to be as much as $200 billion. Hurricane Harvey (2017) caused more than 100 deaths and Hurricane Helene (2024) caused over 250 deaths in the U.S. and both caused significant damage in inland areas. In the case of Helene, the majority of fatalities were caused by excessive rainfall well inland in the mountainous region of western North Carolina. The cost of damages in this region are estimated at almost $80 billion.
Tropical cyclones form in all tropical oceans, but they are rare in the South Atlantic and eastern South Pacific (Fig. 7-29). Before March of 2004, only two tropical cyclones had ever been recorded in the South Atlantic Ocean, and neither had reached hurricane strength. However, in that month, Hurricane Catarina formed east of Brazil. The storm caused at least two deaths and substantial property damage when it came ashore on the southern coast of Brazil. Tropical cyclone damage and deaths are generally greater in the Islands of the western Pacific and mainland Asia than those in the U.S., as the frequency of these cyclones in the Pacific and Indian Oceans is higher than that in the Atlantic. The most vulnerable locations include the Philippines, which lie in the region with the highest frequency of these storms, and the densely populated low-lying areas of Bangladesh, India, Southern China, and mainland Southeast Asia, where evacuation of the large populations remains difficult and storm surge remains a major threat.

Tropical cyclones form only over surface waters with temperatures above about 26°C and do not generally form closer to the equator than 5°N or 5°S, because the Coriolis Effect is too weak in this equatorial band.
Historical records suggest that the frequency and intensity of hurricanes may vary on a cycle lasting several decades. Climate models predict that hurricane frequency will not change significantly due to climate change in the next several decades, but they will become stronger on average, and the most powerful damaging storms will be more frequent and may maintain strength into progressively higher latitudes. For the U.S. and many other countries, this prediction is important. Coastal development has been intense over the past several decades, particularly in the southeastern U.S. and Gulf Coast communities within the hurricane band. In addition, sea level is rising, exposing more coastline to wave action. In the future, large coastal cities of the northeastern United States could be exposed to the full force of devastating hurricanes. Perhaps worse, future hurricanes might have much higher winds than the approximate maximum of 200 km•h–1 observed in the most intense recent hurricanes. Studies of sediment deposited by ancient storms have provided evidence of “super” cyclones in Earth’s past with wind speeds probably higher than any ever directly observed and greater than what most buildings can withstand.
Extratropical Cyclones
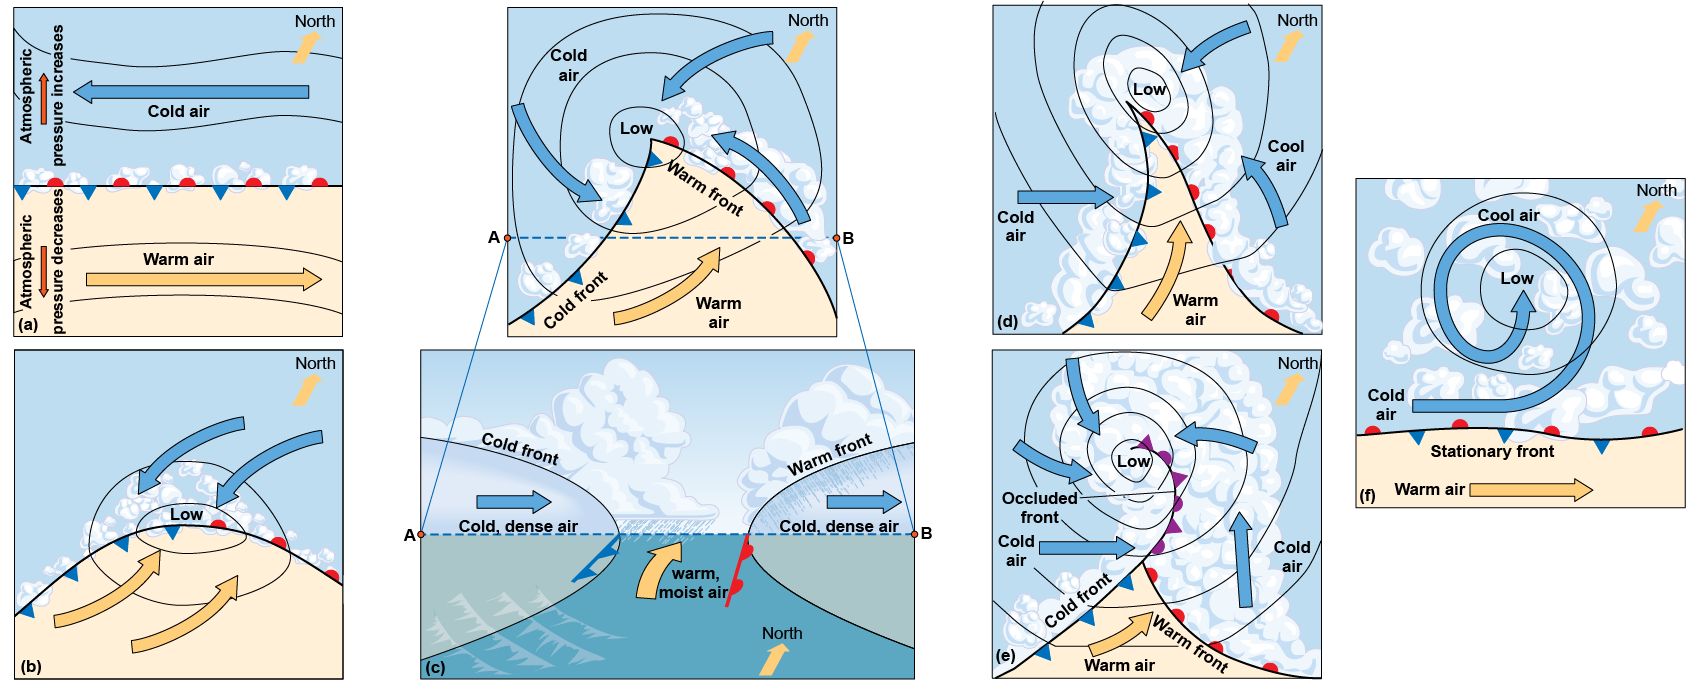
Powerful cyclonic storms form in the westerly wind regions in winter. Such storms form primarily at the polar front, where cold polar air moving toward the equator and the west and warmer mid-latitude air flowing east and toward the pole converge. Along the front between these two air masses, which are moving in opposite directions, waves periodically develop. The waves develop into cyclonic storms as the warm air flows over the top of the cold, denser air, and each moving air mass is deflected by the Coriolis Effect (Fig. 7-30).
Storms that form at the polar front are called “extratropical cyclones.” They can be extremely large and carry huge amounts of moisture. They move eastward with the prevailing winds. Extratropical cyclones move more slowly than hurricanes and generally have somewhat lower, although still very high, wind speeds. They can be much larger than hurricanes and can cause storm surges. Consequently, they can cause severe and extensive wave erosion on exposed shores. The massive Pacific storms that bring winter rains, winds, and beach erosion to California and the Pacific Northwest are extratropical cyclones.
Extratropical cyclones can also intensify or deepen by interacting with a warm western boundary current. For example, the nor’easters that often strike the Mid-Atlantic coast of the United States in winter are extratropical cyclones that often undergo explosive intensification near the Gulf Stream after passing over the North American land mass.