
8.14: Severe Weather
- Page ID
- 10275

\( \newcommand{\vecs}[1]{\overset { \scriptstyle \rightharpoonup} {\mathbf{#1}} } \)
\( \newcommand{\vecd}[1]{\overset{-\!-\!\rightharpoonup}{\vphantom{a}\smash {#1}}} \)
\( \newcommand{\dsum}{\displaystyle\sum\limits} \)
\( \newcommand{\dint}{\displaystyle\int\limits} \)
\( \newcommand{\dlim}{\displaystyle\lim\limits} \)
\( \newcommand{\id}{\mathrm{id}}\) \( \newcommand{\Span}{\mathrm{span}}\)
( \newcommand{\kernel}{\mathrm{null}\,}\) \( \newcommand{\range}{\mathrm{range}\,}\)
\( \newcommand{\RealPart}{\mathrm{Re}}\) \( \newcommand{\ImaginaryPart}{\mathrm{Im}}\)
\( \newcommand{\Argument}{\mathrm{Arg}}\) \( \newcommand{\norm}[1]{\| #1 \|}\)
\( \newcommand{\inner}[2]{\langle #1, #2 \rangle}\)
\( \newcommand{\Span}{\mathrm{span}}\)
\( \newcommand{\id}{\mathrm{id}}\)
\( \newcommand{\Span}{\mathrm{span}}\)
\( \newcommand{\kernel}{\mathrm{null}\,}\)
\( \newcommand{\range}{\mathrm{range}\,}\)
\( \newcommand{\RealPart}{\mathrm{Re}}\)
\( \newcommand{\ImaginaryPart}{\mathrm{Im}}\)
\( \newcommand{\Argument}{\mathrm{Arg}}\)
\( \newcommand{\norm}[1]{\| #1 \|}\)
\( \newcommand{\inner}[2]{\langle #1, #2 \rangle}\)
\( \newcommand{\Span}{\mathrm{span}}\) \( \newcommand{\AA}{\unicode[.8,0]{x212B}}\)
\( \newcommand{\vectorA}[1]{\vec{#1}} % arrow\)
\( \newcommand{\vectorAt}[1]{\vec{\text{#1}}} % arrow\)
\( \newcommand{\vectorB}[1]{\overset { \scriptstyle \rightharpoonup} {\mathbf{#1}} } \)
\( \newcommand{\vectorC}[1]{\textbf{#1}} \)
\( \newcommand{\vectorD}[1]{\overrightarrow{#1}} \)
\( \newcommand{\vectorDt}[1]{\overrightarrow{\text{#1}}} \)
\( \newcommand{\vectE}[1]{\overset{-\!-\!\rightharpoonup}{\vphantom{a}\smash{\mathbf {#1}}}} \)
\( \newcommand{\vecs}[1]{\overset { \scriptstyle \rightharpoonup} {\mathbf{#1}} } \)
\(\newcommand{\longvect}{\overrightarrow}\)
\( \newcommand{\vecd}[1]{\overset{-\!-\!\rightharpoonup}{\vphantom{a}\smash {#1}}} \)
\(\newcommand{\avec}{\mathbf a}\) \(\newcommand{\bvec}{\mathbf b}\) \(\newcommand{\cvec}{\mathbf c}\) \(\newcommand{\dvec}{\mathbf d}\) \(\newcommand{\dtil}{\widetilde{\mathbf d}}\) \(\newcommand{\evec}{\mathbf e}\) \(\newcommand{\fvec}{\mathbf f}\) \(\newcommand{\nvec}{\mathbf n}\) \(\newcommand{\pvec}{\mathbf p}\) \(\newcommand{\qvec}{\mathbf q}\) \(\newcommand{\svec}{\mathbf s}\) \(\newcommand{\tvec}{\mathbf t}\) \(\newcommand{\uvec}{\mathbf u}\) \(\newcommand{\vvec}{\mathbf v}\) \(\newcommand{\wvec}{\mathbf w}\) \(\newcommand{\xvec}{\mathbf x}\) \(\newcommand{\yvec}{\mathbf y}\) \(\newcommand{\zvec}{\mathbf z}\) \(\newcommand{\rvec}{\mathbf r}\) \(\newcommand{\mvec}{\mathbf m}\) \(\newcommand{\zerovec}{\mathbf 0}\) \(\newcommand{\onevec}{\mathbf 1}\) \(\newcommand{\real}{\mathbb R}\) \(\newcommand{\twovec}[2]{\left[\begin{array}{r}#1 \\ #2 \end{array}\right]}\) \(\newcommand{\ctwovec}[2]{\left[\begin{array}{c}#1 \\ #2 \end{array}\right]}\) \(\newcommand{\threevec}[3]{\left[\begin{array}{r}#1 \\ #2 \\ #3 \end{array}\right]}\) \(\newcommand{\cthreevec}[3]{\left[\begin{array}{c}#1 \\ #2 \\ #3 \end{array}\right]}\) \(\newcommand{\fourvec}[4]{\left[\begin{array}{r}#1 \\ #2 \\ #3 \\ #4 \end{array}\right]}\) \(\newcommand{\cfourvec}[4]{\left[\begin{array}{c}#1 \\ #2 \\ #3 \\ #4 \end{array}\right]}\) \(\newcommand{\fivevec}[5]{\left[\begin{array}{r}#1 \\ #2 \\ #3 \\ #4 \\ #5 \\ \end{array}\right]}\) \(\newcommand{\cfivevec}[5]{\left[\begin{array}{c}#1 \\ #2 \\ #3 \\ #4 \\ #5 \\ \end{array}\right]}\) \(\newcommand{\mattwo}[4]{\left[\begin{array}{rr}#1 \amp #2 \\ #3 \amp #4 \\ \end{array}\right]}\) \(\newcommand{\laspan}[1]{\text{Span}\{#1\}}\) \(\newcommand{\bcal}{\cal B}\) \(\newcommand{\ccal}{\cal C}\) \(\newcommand{\scal}{\cal S}\) \(\newcommand{\wcal}{\cal W}\) \(\newcommand{\ecal}{\cal E}\) \(\newcommand{\coords}[2]{\left\{#1\right\}_{#2}}\) \(\newcommand{\gray}[1]{\color{gray}{#1}}\) \(\newcommand{\lgray}[1]{\color{lightgray}{#1}}\) \(\newcommand{\rank}{\operatorname{rank}}\) \(\newcommand{\row}{\text{Row}}\) \(\newcommand{\col}{\text{Col}}\) \(\renewcommand{\row}{\text{Row}}\) \(\newcommand{\nul}{\text{Nul}}\) \(\newcommand{\var}{\text{Var}}\) \(\newcommand{\corr}{\text{corr}}\) \(\newcommand{\len}[1]{\left|#1\right|}\) \(\newcommand{\bbar}{\overline{\bvec}}\) \(\newcommand{\bhat}{\widehat{\bvec}}\) \(\newcommand{\bperp}{\bvec^\perp}\) \(\newcommand{\xhat}{\widehat{\xvec}}\) \(\newcommand{\vhat}{\widehat{\vvec}}\) \(\newcommand{\uhat}{\widehat{\uvec}}\) \(\newcommand{\what}{\widehat{\wvec}}\) \(\newcommand{\Sighat}{\widehat{\Sigma}}\) \(\newcommand{\lt}{<}\) \(\newcommand{\gt}{>}\) \(\newcommand{\amp}{&}\) \(\definecolor{fillinmathshade}{gray}{0.9}\)Severe Weather
Severe weather conditions can occur anywhere, but some area are more susceptible to severe weather than others due to regional geography and climate factors. Severe weather includes strong convective thunderstorms, winter storms (severe cold, blizzards, and ice storms), damaging wind storms and tornadoes, flooding, dust storms, extreme heat, and firestorms.
Atmospheric scientists are constantly monitoring weather conditions to make predictions of potential severe weather conditions (and potential disasters), using ground-based weather observations combined with remote sensing data (satellite, airplane, Doppler radar, etc.). These are combined with historic weather data in order to make weather predictions.
The Federal government has been recording statistics of deaths and property damage due to weather-related activity for many decades. Floods and droughts (with associated famines) have remained the most deadly disasters worldwide. In the United States, extreme heat events and floods remain the numbers 1 and 2 killers (Figure 8.39). Tornadoes are number 3, but they are perhaps the most terrifying because of their unpredictable occurrence and suddenly destructive behavior.
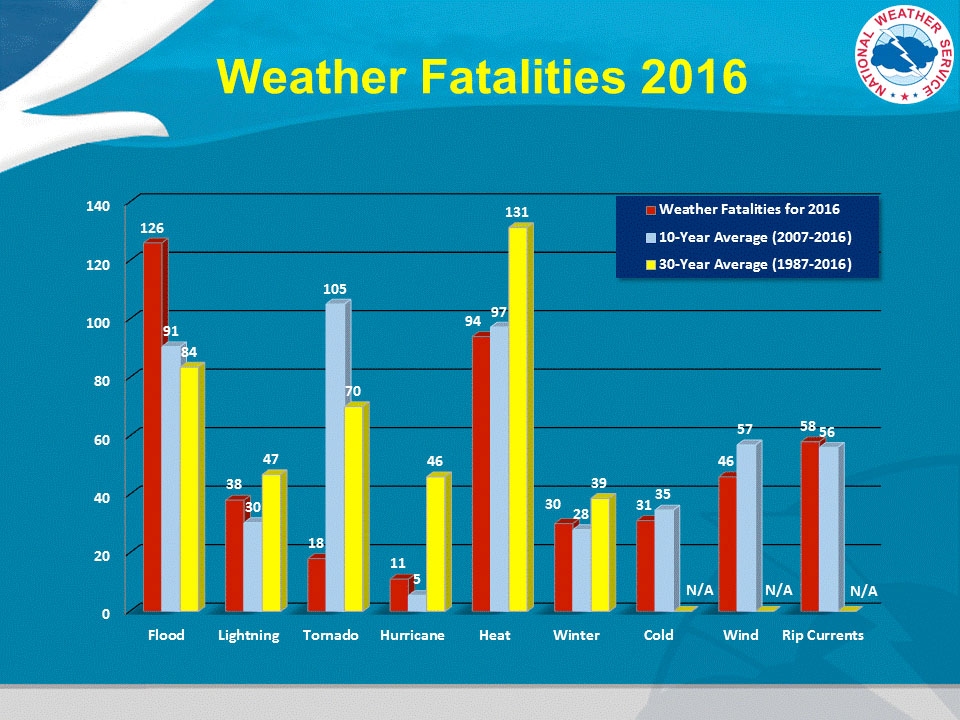
Figure 8.39. NOAA severe weather statistics averages for the United States.
Tornadoes
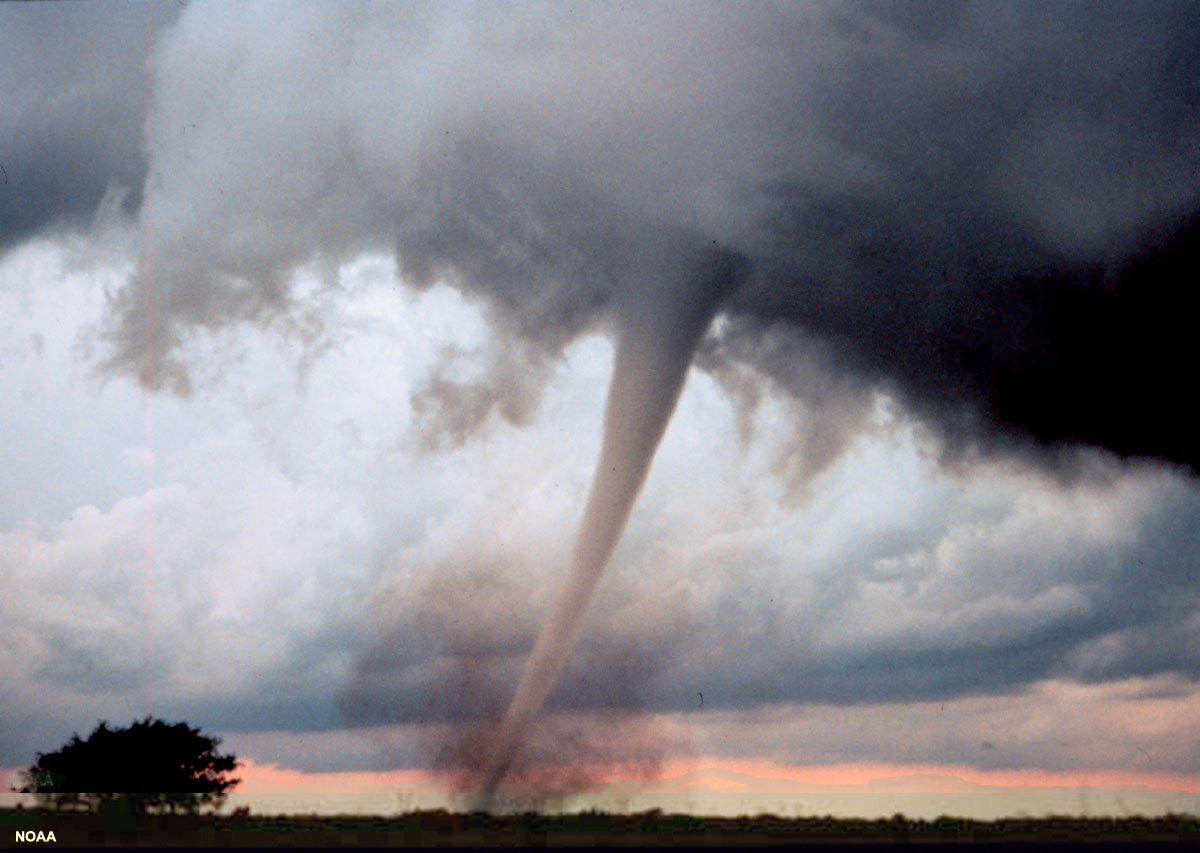
Tornadoes are mobile funnel-shaped rotating vortexes of wind that form and advance beneath large storm systems (Figure 8.40). Tornadoes vary considerably in their destructive power—how strong their winds are, how long they are in contact with the land surface, and the distance they travel. Storm systems can often produce multiple tornadoes (called a tornado outbreak). A single storm cell can sometimes produce multiple tornadoes simultaneously. The 2011 Super Outbreak (April 25-28) produced 392 "confirmed" tornado in 21 states (between Texas and New York) with four rated as F5 tornado on the Fugita tornado intensity scale (see table below).
Fugita Tornado Intensity Scale |
||
| F-Scale # | Wind Speed | Intensity Phrase |
| F0 | 40-72 mph | light damage - branches off trees, minor damage to roofs |
| F1 | 73-112 mph | moderate damage - roof and window damage, mobile homes overturned, cars pushed off roads |
| F2 | 113-157 mph | significant damage - roofs off homes, mobile homes destroyed, large trees down/uprooted, cars push off roads |
| F3 | 158-206 mph | severe damage - roofs and walls torn from well constructed homes, most trees uprooted, heavy cars lifted off ground and thrown |
| F4 | 207-260 mph | devastating damage - well-constructed homes leveled, cars thrown and large object moved like battering missiles |
| F5 | 261-318 mph | incredible damage - homes lifted off foundations and ripped apart, trees debarked, concrete structures damaged, skyscrapers topple |
 |
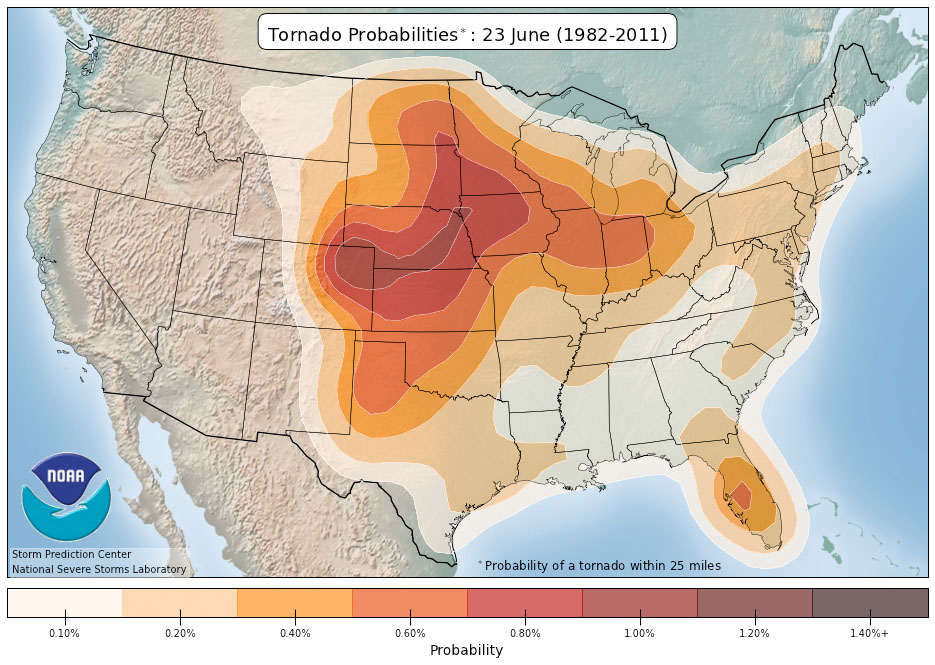 |
| Figure 8.40. this F3 tornado occurred on May 3, 1993 in Oklahoma. | Figure 8.41. Tornado probability map of the United States showing the likelihood of a tornado occur based on historic data for June 23 of any year. |
Figure 8.41 shows a tornado probability map of a typical day (June 23) in the United States based of historical tornado data; data for each day of the year shows that tornado activity in the country varies significantly from season to season and from one region to another. The central Great Plains region is commonly called Tornado Alley because it statistically experiences the greatest number of tornadoes in any given year, but weather and climate data show that trends are changing (as well as better recording of data). The Great Plains and Midwest typically experience clashing air masses—cool and dry air masses that move east from the Rocky Mountains and Canada collide with warm, moist air masses moving north from the Gulf of Mexico and Atlantic regions. When conditions are right, large thunderstorms that display intense convection and rotation can generate vortexes that descend as funnel clouds—these become tornadoes when the start to impact the surface.
Drought
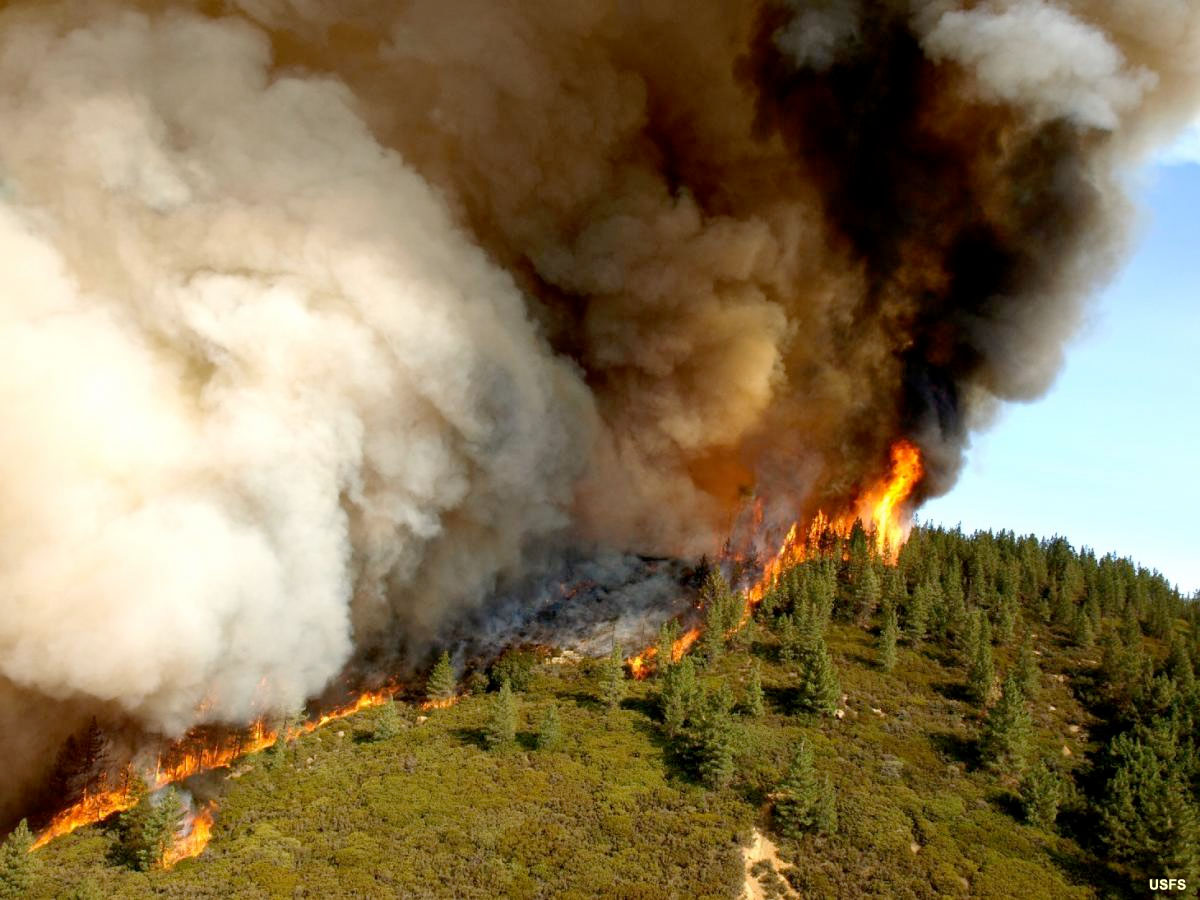
Drought is a prolonged period of abnormally low rainfall. Drought conditions commonly lead to other disastrous weather conditions including dust storms, heat waves, and firestorms, all of which can be catastrophic. The worst droughts in US history occurred in the 1930s and 1950s, resulting in Dust Bowl conditions throughout the Great Plains and Midwest that lead to severe economic damage and social upheaval and migrations. Drought periods have alternated with serious flooding in intervening years. Figure 8.27 (above) shows the cyclic nature of droughts and flooding periods for the State of California. During recent droughts, devastating firestorms have ravaged communities throughout the regions around San Diego, Los Angeles, Santa Barbara, San Francisco, and throughout the Sierra Nevada region—as urban development has spread into areas where vegetation is naturally apt to burn on a frequent basis during drought conditions (Figure 8.42). Conversely, flood conditions during wet El Niño years can potentially be more catastrophic to California than drought. Recent investigations into the impact of a California mega-flood event that happened in California in the winter of 1871-1872 suggest that if were a similar event were to happen today it could potentially be the most destructive natural disaster to impact the United States—possibly causing nearly three times as much damage than a great earthquake in the region.
 |
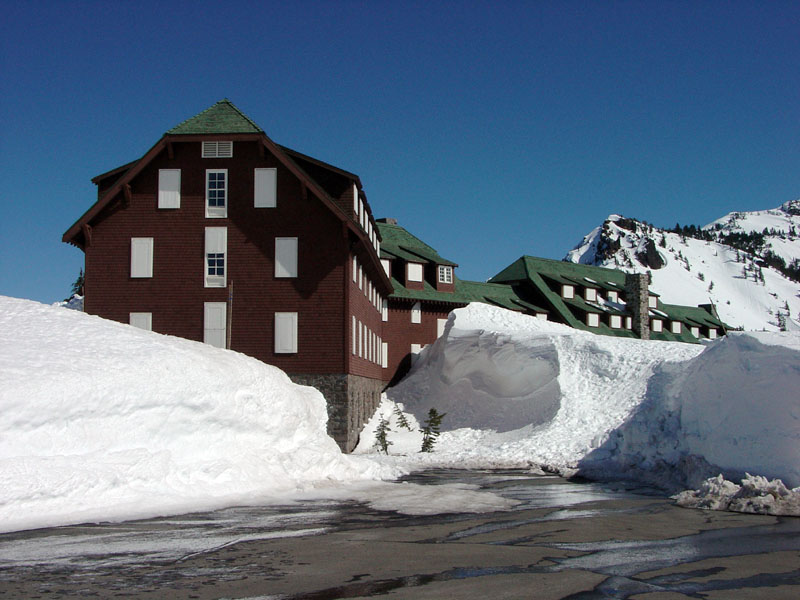 |
| Figure 8.42. A flame front of a firestorm near Santa Barbara in 2007. | Figure 8.43. Massive snow accumulation can be anticipated in places like Crater Lake, OR. However, giant winter storms can have long lasting effects, not just the cold and ice, but the shutting down of regional infrastructure and economies. |
To see information about current and forecasts of regional storm activity see:
NOAA/National Weather Service Storm Prediction Center