
18.2: Channel Geometry and Flow Characteristics
- Page ID
- 16641

\( \newcommand{\vecs}[1]{\overset { \scriptstyle \rightharpoonup} {\mathbf{#1}} } \)
\( \newcommand{\vecd}[1]{\overset{-\!-\!\rightharpoonup}{\vphantom{a}\smash {#1}}} \)
\( \newcommand{\id}{\mathrm{id}}\) \( \newcommand{\Span}{\mathrm{span}}\)
( \newcommand{\kernel}{\mathrm{null}\,}\) \( \newcommand{\range}{\mathrm{range}\,}\)
\( \newcommand{\RealPart}{\mathrm{Re}}\) \( \newcommand{\ImaginaryPart}{\mathrm{Im}}\)
\( \newcommand{\Argument}{\mathrm{Arg}}\) \( \newcommand{\norm}[1]{\| #1 \|}\)
\( \newcommand{\inner}[2]{\langle #1, #2 \rangle}\)
\( \newcommand{\Span}{\mathrm{span}}\)
\( \newcommand{\id}{\mathrm{id}}\)
\( \newcommand{\Span}{\mathrm{span}}\)
\( \newcommand{\kernel}{\mathrm{null}\,}\)
\( \newcommand{\range}{\mathrm{range}\,}\)
\( \newcommand{\RealPart}{\mathrm{Re}}\)
\( \newcommand{\ImaginaryPart}{\mathrm{Im}}\)
\( \newcommand{\Argument}{\mathrm{Arg}}\)
\( \newcommand{\norm}[1]{\| #1 \|}\)
\( \newcommand{\inner}[2]{\langle #1, #2 \rangle}\)
\( \newcommand{\Span}{\mathrm{span}}\) \( \newcommand{\AA}{\unicode[.8,0]{x212B}}\)
\( \newcommand{\vectorA}[1]{\vec{#1}} % arrow\)
\( \newcommand{\vectorAt}[1]{\vec{\text{#1}}} % arrow\)
\( \newcommand{\vectorB}[1]{\overset { \scriptstyle \rightharpoonup} {\mathbf{#1}} } \)
\( \newcommand{\vectorC}[1]{\textbf{#1}} \)
\( \newcommand{\vectorD}[1]{\overrightarrow{#1}} \)
\( \newcommand{\vectorDt}[1]{\overrightarrow{\text{#1}}} \)
\( \newcommand{\vectE}[1]{\overset{-\!-\!\rightharpoonup}{\vphantom{a}\smash{\mathbf {#1}}}} \)
\( \newcommand{\vecs}[1]{\overset { \scriptstyle \rightharpoonup} {\mathbf{#1}} } \)
\( \newcommand{\vecd}[1]{\overset{-\!-\!\rightharpoonup}{\vphantom{a}\smash {#1}}} \)
\(\newcommand{\avec}{\mathbf a}\) \(\newcommand{\bvec}{\mathbf b}\) \(\newcommand{\cvec}{\mathbf c}\) \(\newcommand{\dvec}{\mathbf d}\) \(\newcommand{\dtil}{\widetilde{\mathbf d}}\) \(\newcommand{\evec}{\mathbf e}\) \(\newcommand{\fvec}{\mathbf f}\) \(\newcommand{\nvec}{\mathbf n}\) \(\newcommand{\pvec}{\mathbf p}\) \(\newcommand{\qvec}{\mathbf q}\) \(\newcommand{\svec}{\mathbf s}\) \(\newcommand{\tvec}{\mathbf t}\) \(\newcommand{\uvec}{\mathbf u}\) \(\newcommand{\vvec}{\mathbf v}\) \(\newcommand{\wvec}{\mathbf w}\) \(\newcommand{\xvec}{\mathbf x}\) \(\newcommand{\yvec}{\mathbf y}\) \(\newcommand{\zvec}{\mathbf z}\) \(\newcommand{\rvec}{\mathbf r}\) \(\newcommand{\mvec}{\mathbf m}\) \(\newcommand{\zerovec}{\mathbf 0}\) \(\newcommand{\onevec}{\mathbf 1}\) \(\newcommand{\real}{\mathbb R}\) \(\newcommand{\twovec}[2]{\left[\begin{array}{r}#1 \\ #2 \end{array}\right]}\) \(\newcommand{\ctwovec}[2]{\left[\begin{array}{c}#1 \\ #2 \end{array}\right]}\) \(\newcommand{\threevec}[3]{\left[\begin{array}{r}#1 \\ #2 \\ #3 \end{array}\right]}\) \(\newcommand{\cthreevec}[3]{\left[\begin{array}{c}#1 \\ #2 \\ #3 \end{array}\right]}\) \(\newcommand{\fourvec}[4]{\left[\begin{array}{r}#1 \\ #2 \\ #3 \\ #4 \end{array}\right]}\) \(\newcommand{\cfourvec}[4]{\left[\begin{array}{c}#1 \\ #2 \\ #3 \\ #4 \end{array}\right]}\) \(\newcommand{\fivevec}[5]{\left[\begin{array}{r}#1 \\ #2 \\ #3 \\ #4 \\ #5 \\ \end{array}\right]}\) \(\newcommand{\cfivevec}[5]{\left[\begin{array}{c}#1 \\ #2 \\ #3 \\ #4 \\ #5 \\ \end{array}\right]}\) \(\newcommand{\mattwo}[4]{\left[\begin{array}{rr}#1 \amp #2 \\ #3 \amp #4 \\ \end{array}\right]}\) \(\newcommand{\laspan}[1]{\text{Span}\{#1\}}\) \(\newcommand{\bcal}{\cal B}\) \(\newcommand{\ccal}{\cal C}\) \(\newcommand{\scal}{\cal S}\) \(\newcommand{\wcal}{\cal W}\) \(\newcommand{\ecal}{\cal E}\) \(\newcommand{\coords}[2]{\left\{#1\right\}_{#2}}\) \(\newcommand{\gray}[1]{\color{gray}{#1}}\) \(\newcommand{\lgray}[1]{\color{lightgray}{#1}}\) \(\newcommand{\rank}{\operatorname{rank}}\) \(\newcommand{\row}{\text{Row}}\) \(\newcommand{\col}{\text{Col}}\) \(\renewcommand{\row}{\text{Row}}\) \(\newcommand{\nul}{\text{Nul}}\) \(\newcommand{\var}{\text{Var}}\) \(\newcommand{\corr}{\text{corr}}\) \(\newcommand{\len}[1]{\left|#1\right|}\) \(\newcommand{\bbar}{\overline{\bvec}}\) \(\newcommand{\bhat}{\widehat{\bvec}}\) \(\newcommand{\bperp}{\bvec^\perp}\) \(\newcommand{\xhat}{\widehat{\xvec}}\) \(\newcommand{\vhat}{\widehat{\vvec}}\) \(\newcommand{\uhat}{\widehat{\uvec}}\) \(\newcommand{\what}{\widehat{\wvec}}\) \(\newcommand{\Sighat}{\widehat{\Sigma}}\) \(\newcommand{\lt}{<}\) \(\newcommand{\gt}{>}\) \(\newcommand{\amp}{&}\) \(\definecolor{fillinmathshade}{gray}{0.9}\)Channel Geometry
Channel geometry and characteristics of stream flow are inherently related. Changes in the geometry of the channel can impact stream velocity and discharge.
The cross-sectional area of the stream is determined by multiplying channel depth by channel width along a transverse section of the stream. For a hypothetical stream with a rectangular cross-sectional shape (a stream with a flat bottom and vertical sides) the cross-sectional area (A) is simply the width multiplied by the depth:
A = (W * D)
The wetted perimeter is the portion of the channel that is "wet". The wetted perimeter (WP) is the width plus twice the depth that the water touches:
WP= W + 2D
The greater the cross-sectional area in comparison to the wetted perimeter, the more freely flowing will the stream be because less of the water is in proximity to the frictional bed. So as hydraulic radius increases so will velocity (all other factors being equal).
Studies have shown that width and depth tend to vary regularly with stream discharge. If discharge is held constant and width decreases, then the channel should deepen by scouring. This occurs as a result of the increased velocity and transportation power which accompanies the narrowing of a channel. Studies have also shown that as mean discharge of a stream increases downstream so do channel width, depth, and average current velocity.
The flow velocity is directly related to the hydraulic radius (cross-sectional area divided by the wetted perimeter) and channel slope, and inversely related to channel roughness.
Channel slope or gradient is the difference in elevation between two points on a stream divided by the distance between them measured along the stream channel. The flow velocity, and thus power of the stream to do work is also directly related to the slope of the channel, the steeper the slope, the faster the velocity of flow.
Stream Flow
Sources of Stream Flow
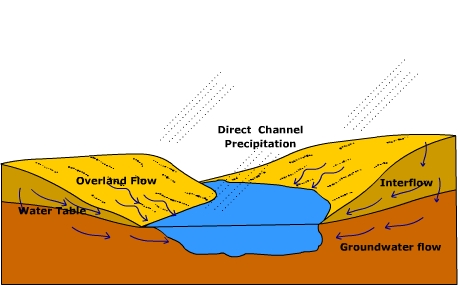
There are four basic sources of stream flow. Groundwater flow into the channel is what provides for the base flow, or normal flow of the stream. For perennial streams the water table is at the height of the surface of the stream as shown below. The base flow of the stream is augmented by interflow from the soil moisture zone. At the surface, direct channel precipitation and surface runoff as overland flow contribute to stream flow during and following storms.
Flow velocity
The flow velocity of a stream is how fast the water is moving through a cross-section. Flow velocity is determined by the balance between the down slope gravitational stress as a result of the slope of the stream, and the loss or expenditure of energy in overcoming the frictional resistance of the channel bed and side. In general, the flow velocity is greatest at the center of the channel, just below the surface. More specifically the highest velocity of flow follows the stream thalweg, a line that connects the deepest part of the stream channel. Here, water moving through the stream encounters the least resistance to flow yielding a higher velocity of flow.
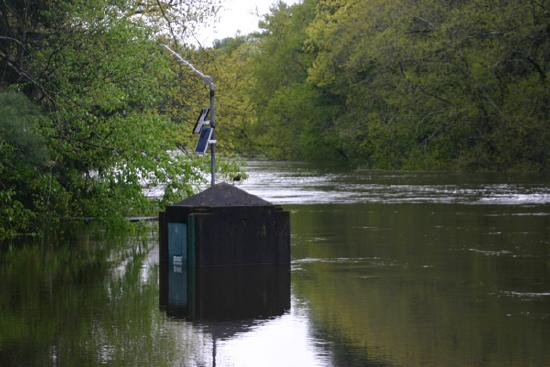
Video: Streamgage - The Silent Superhero (Courtesy USGS)
Flow Regimes
Under very low velocities water flows through a stream as smooth sheets running parallel to the bed called laminar flow. Laminar flow has an appearance much like that of a deck of cards with the top card jutting forward over those below. The tug of the channel bottom slows the water near the bed with the water nearer the surface flowing somewhat faster. Only the finest particles kind be detached, so laminar flow is basically nonerosive.
Under higher flow velocities, resistance within the flow and that caused by the bed and sides of the channel cause the flow to break down into separate currents. The swirling currents of turbulent flow undergo constant variation in speed and direction of flow. The swirls of water created during turbulent flow are more erosive than laminar flow and help suspend material in the stream. Turbulent flow is the "normal" type of flow in most streams.
Stream discharge
Stream discharge is the volume of water passing through a particular cross-section in a unit of time, measured in units like cubic meters per second or cubic feet per second. The discharge of a perennially flowing stream is provided by the influx of groundwater into the channel. This influx provides what is called the "base flow" of the stream. Water is added to the stream by runoff from the surrounding terrain during storm events.
Discharge(Q) can be expressed as
Q = A X V
where,
A= cross-sectional area
V= velocity
The hydrograph is a graphical way of portraying the change in discharge over time, and how it relates to inputs of water and the environment in which the stream is located. The Y-axis of the hydrograph is scaled for discharge, and when investigating the influence of a storm event, precipitation. The X-axis is scaled for time. Discharge is plotted as a line and precipitation as a bar graph. The hydrograph shows discharge starting at its base flow, rising to a peak (the rising limb) and then declining (recessional limb) back to its base flow. Notice how the peak in precipitation does not occur at the same time as the peak in discharge. In other words, there is a lag period between the time when the most precipitation occurs and when the most discharge is recorded.
A number of factors influence the shape of the hydrograph and the length of the lag period. Elongate basins tend to exhibit flatter hydrographs because it takes a longer time for water to move from the head to the recording station at the mouth of the basin. Travel time is less for circular basins resulting in a more peaked hydrograph.

Land cover is another important control over the shape of a stream hydrograph. Under natural conditions, vegetation slows surface runoff and encourages infiltration. As a result, the hydrograph is less peaked and the lag time is longer than a basin with little vegetation. Urbanization of a watershed can have a drastic effect on runoff, discharge, and the resulting hydrograph. Urbanization replaces permeable surface with impermeable ones, streets, parking lots, buildings etc. Water runs off the surface more efficiently and is diverted to nearby streams by the construction of storm sewers. Storm sewers effectively increase the urbanized watershed drainage density. As a result, urbanized watersheds tend to exhibit more peaked hydrographs with shorter lag periods.
Stream energy
The energy that a stream possesses is closely related to its discharge because discharge determines flow velocity. Flow velocity controls the stream's capacity to erode and transport sediment through its channel. Generally, the larger the discharge, the smoother the channel, greater the stream velocity. Cross-sectional area and discharge increases down stream due to tributary and ground water flow into the channel. As a result, one might expect flow velocity to increase in the down stream direction as well. However, as streams grow larger their down stream slope decreases, preventing a continuous buildup of energy and creating a more uniform distribution of stream energy along its length.
Floods and Flooding
A flood occurs when a stream channel can no longer contain the water moving through it. Floods usually are local, short-lived events, others can be catastrophic, happening with little or no warning. Floods are most often caused by prolonged rainfall that saturates the ground causing surface runoff into nearby streams increasing their discharge. Flooding occurs when the water spills out of the channel and on to the adjacent terrain. Though viewed as a "natural hazard" to humans, flooding is a natural, rejuvenating process.
Causes and Conditions
Generally speaking there are two types of floods, 1) where water slowly rises and spills over the banks of a stream or river and 2) flash floods. Floods can occur at anytime of year, but particular seasonal weather patterns are more conducive to the creation of floods than others in different geographic regions. In the United States, cyclonic storms roaring off the ocean and into the Pacific coast states during the winter and early spring can cause flooding. In the southwest, summer and fall thunderstorms release torrents of water that rush down dry stream beds or arroyos as flash floods. Flooding can occur in the north central states during the winter as rain fall or snow melt runs off the frozen ground surface, or ice jams rivers causing them to flood. Flooding in the mid portion of the United States tends to occur in spring and summer as polar front cyclones march across the North American continent. Hurricanes and large convective complexes create flooding in the late summer and fall along the Gulf coast of the United States.

In tropical regions like Bangla Desh, monsoon rains saturate the ground causing severe flooding. Europe floods from the sea may occur as a result of Atlantic storms pushing water to the coast and can be particularly damaging when occurring at high tide. Deforestation greatly increases the risk for flooding.
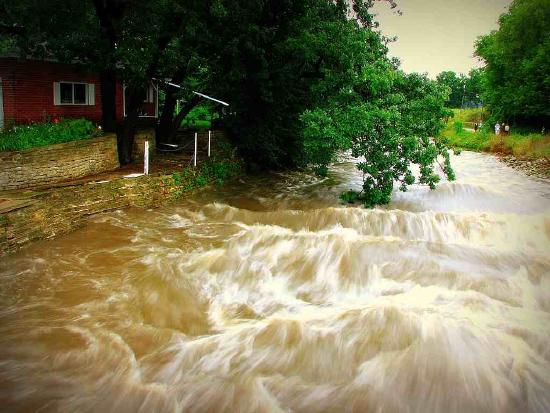
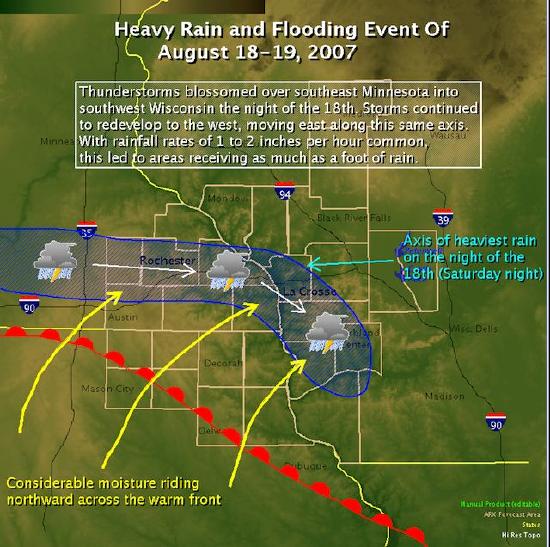
Some of the worst flooding in decades also occurred during the summer of 2007. Flooding in Britain was caused by a persistent jet stream sitting further south than usual at this time of the year. System after system pounded the British Isles. During August of 2007, widespread flooding occurred in the midwest United States causing damage exceeding $115 million. A warm front advanced northward into Iowa and Illinois during mid-August where it stalled and became a stationary front. Warm, moist air overrunning the front provided the ingredients for showers and thunderstorms. Rainfall over the weekend of August 18-19, 17 inches of precipitation fell in Witoka, MN. Rochester, MN measured 6.9 inches of rainfall. The heavy rain sent streams in the region over their banks. Moisture from Tropical Storm Erin to the south enhanced the stormy conditions.
Flood Frequency

Using frequency analysis, one can estimate the probability of the occurrence of a given flood event The recurrence interval, also known as the return period, is based on the probability that the given event will be equaled or exceeded in any given year. For instance, a one hundred year flood has a 1% chance of occurring in any given year. One hundred year floods are rare but can be devastating. The 100-year flood plain is used for flood plain management and insurance purposes. Those living within this zone are often required to have flood insurance in addition to their regular home owner's insurance.
Channel Types
There are three basic types of channels, straight, meandering and braided. Describing a channel by one of the aforementioned terms does not mean that the entire channel is straight or otherwise. It simply means that some portion of the channel can be described in such a way. In fact, portions of a stream may be straight, some meandering and others braided.
Describing a channel as a straight channel seems pretty obvious, though rarely is a channel perfectly straight in nature. A meandering channel is one that takes twists and turns over its length.![]() Geoscientists use the sinuosity ratio to determine whether a channel is straight or meandering. The sinuosity ratio is the distance between two points on the stream measured along the channel divided by the straight line distance between the two points. If the sinuosity ratio is 1.5 or greater the channel is considered to be a meandering one.
Geoscientists use the sinuosity ratio to determine whether a channel is straight or meandering. The sinuosity ratio is the distance between two points on the stream measured along the channel divided by the straight line distance between the two points. If the sinuosity ratio is 1.5 or greater the channel is considered to be a meandering one.
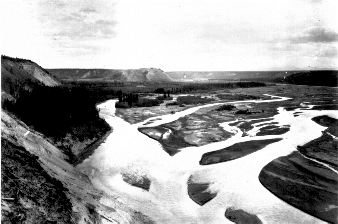
A braided channel ![]() is created when a stream channel is divided into several smaller ones by the accumulation of in-channel deposits. This occurs when the load of flat stream channel is too great for the velocity or discharge. Or, seasonal fluctuations in discharge expose in-channel deposits. Sand or gravel bars accumulate subdividing the flow of water into many smaller channels. Braided streams are common in glaciated areas where melt water streams choked with sediment is discharged at the snout of the glacier.
is created when a stream channel is divided into several smaller ones by the accumulation of in-channel deposits. This occurs when the load of flat stream channel is too great for the velocity or discharge. Or, seasonal fluctuations in discharge expose in-channel deposits. Sand or gravel bars accumulate subdividing the flow of water into many smaller channels. Braided streams are common in glaciated areas where melt water streams choked with sediment is discharged at the snout of the glacier.
Pools and Riffles
We often find a regular sequence of shallow riffles and deeper pools in stream channels, the cause of which is still not well understood. The spacing of the riffle-pool sequence is related to the width of the stream. Riffle-pool sequences usually are 5-7 times the width of the channel. Laboratory experiments with artificial channels in noncohesive sand or silt show that riffle and pool sequences in straight channels tend to evolve into meanders. When this happens, a pool becomes a site for a laterally migrating meander. The stream thalweg meanders back and forth between pools, moving toward the outer bank of each successive curve. Erosion is therefore concentrated at the outside banks where the flow is deepest and stream velocity accelerates around meander.