5.5: Future Geographies - Global Warming and Regional Temperature Patterns
- Page ID
- 15900
\( \newcommand{\vecs}[1]{\overset { \scriptstyle \rightharpoonup} {\mathbf{#1}} } \)
\( \newcommand{\vecd}[1]{\overset{-\!-\!\rightharpoonup}{\vphantom{a}\smash {#1}}} \)
\( \newcommand{\id}{\mathrm{id}}\) \( \newcommand{\Span}{\mathrm{span}}\)
( \newcommand{\kernel}{\mathrm{null}\,}\) \( \newcommand{\range}{\mathrm{range}\,}\)
\( \newcommand{\RealPart}{\mathrm{Re}}\) \( \newcommand{\ImaginaryPart}{\mathrm{Im}}\)
\( \newcommand{\Argument}{\mathrm{Arg}}\) \( \newcommand{\norm}[1]{\| #1 \|}\)
\( \newcommand{\inner}[2]{\langle #1, #2 \rangle}\)
\( \newcommand{\Span}{\mathrm{span}}\)
\( \newcommand{\id}{\mathrm{id}}\)
\( \newcommand{\Span}{\mathrm{span}}\)
\( \newcommand{\kernel}{\mathrm{null}\,}\)
\( \newcommand{\range}{\mathrm{range}\,}\)
\( \newcommand{\RealPart}{\mathrm{Re}}\)
\( \newcommand{\ImaginaryPart}{\mathrm{Im}}\)
\( \newcommand{\Argument}{\mathrm{Arg}}\)
\( \newcommand{\norm}[1]{\| #1 \|}\)
\( \newcommand{\inner}[2]{\langle #1, #2 \rangle}\)
\( \newcommand{\Span}{\mathrm{span}}\) \( \newcommand{\AA}{\unicode[.8,0]{x212B}}\)
\( \newcommand{\vectorA}[1]{\vec{#1}} % arrow\)
\( \newcommand{\vectorAt}[1]{\vec{\text{#1}}} % arrow\)
\( \newcommand{\vectorB}[1]{\overset { \scriptstyle \rightharpoonup} {\mathbf{#1}} } \)
\( \newcommand{\vectorC}[1]{\textbf{#1}} \)
\( \newcommand{\vectorD}[1]{\overrightarrow{#1}} \)
\( \newcommand{\vectorDt}[1]{\overrightarrow{\text{#1}}} \)
\( \newcommand{\vectE}[1]{\overset{-\!-\!\rightharpoonup}{\vphantom{a}\smash{\mathbf {#1}}}} \)
\( \newcommand{\vecs}[1]{\overset { \scriptstyle \rightharpoonup} {\mathbf{#1}} } \)
\( \newcommand{\vecd}[1]{\overset{-\!-\!\rightharpoonup}{\vphantom{a}\smash {#1}}} \)
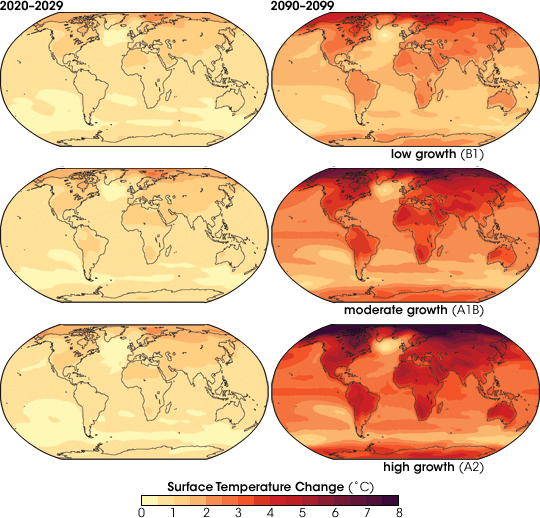
\(\newcommand{\avec}{\mathbf a}\) \(\newcommand{\bvec}{\mathbf b}\) \(\newcommand{\cvec}{\mathbf c}\) \(\newcommand{\dvec}{\mathbf d}\) \(\newcommand{\dtil}{\widetilde{\mathbf d}}\) \(\newcommand{\evec}{\mathbf e}\) \(\newcommand{\fvec}{\mathbf f}\) \(\newcommand{\nvec}{\mathbf n}\) \(\newcommand{\pvec}{\mathbf p}\) \(\newcommand{\qvec}{\mathbf q}\) \(\newcommand{\svec}{\mathbf s}\) \(\newcommand{\tvec}{\mathbf t}\) \(\newcommand{\uvec}{\mathbf u}\) \(\newcommand{\vvec}{\mathbf v}\) \(\newcommand{\wvec}{\mathbf w}\) \(\newcommand{\xvec}{\mathbf x}\) \(\newcommand{\yvec}{\mathbf y}\) \(\newcommand{\zvec}{\mathbf z}\) \(\newcommand{\rvec}{\mathbf r}\) \(\newcommand{\mvec}{\mathbf m}\) \(\newcommand{\zerovec}{\mathbf 0}\) \(\newcommand{\onevec}{\mathbf 1}\) \(\newcommand{\real}{\mathbb R}\) \(\newcommand{\twovec}[2]{\left[\begin{array}{r}#1 \\ #2 \end{array}\right]}\) \(\newcommand{\ctwovec}[2]{\left[\begin{array}{c}#1 \\ #2 \end{array}\right]}\) \(\newcommand{\threevec}[3]{\left[\begin{array}{r}#1 \\ #2 \\ #3 \end{array}\right]}\) \(\newcommand{\cthreevec}[3]{\left[\begin{array}{c}#1 \\ #2 \\ #3 \end{array}\right]}\) \(\newcommand{\fourvec}[4]{\left[\begin{array}{r}#1 \\ #2 \\ #3 \\ #4 \end{array}\right]}\) \(\newcommand{\cfourvec}[4]{\left[\begin{array}{c}#1 \\ #2 \\ #3 \\ #4 \end{array}\right]}\) \(\newcommand{\fivevec}[5]{\left[\begin{array}{r}#1 \\ #2 \\ #3 \\ #4 \\ #5 \\ \end{array}\right]}\) \(\newcommand{\cfivevec}[5]{\left[\begin{array}{c}#1 \\ #2 \\ #3 \\ #4 \\ #5 \\ \end{array}\right]}\) \(\newcommand{\mattwo}[4]{\left[\begin{array}{rr}#1 \amp #2 \\ #3 \amp #4 \\ \end{array}\right]}\) \(\newcommand{\laspan}[1]{\text{Span}\{#1\}}\) \(\newcommand{\bcal}{\cal B}\) \(\newcommand{\ccal}{\cal C}\) \(\newcommand{\scal}{\cal S}\) \(\newcommand{\wcal}{\cal W}\) \(\newcommand{\ecal}{\cal E}\) \(\newcommand{\coords}[2]{\left\{#1\right\}_{#2}}\) \(\newcommand{\gray}[1]{\color{gray}{#1}}\) \(\newcommand{\lgray}[1]{\color{lightgray}{#1}}\) \(\newcommand{\rank}{\operatorname{rank}}\) \(\newcommand{\row}{\text{Row}}\) \(\newcommand{\col}{\text{Col}}\) \(\renewcommand{\row}{\text{Row}}\) \(\newcommand{\nul}{\text{Nul}}\) \(\newcommand{\var}{\text{Var}}\) \(\newcommand{\corr}{\text{corr}}\) \(\newcommand{\len}[1]{\left|#1\right|}\) \(\newcommand{\bbar}{\overline{\bvec}}\) \(\newcommand{\bhat}{\widehat{\bvec}}\) \(\newcommand{\bperp}{\bvec^\perp}\) \(\newcommand{\xhat}{\widehat{\xvec}}\) \(\newcommand{\vhat}{\widehat{\vvec}}\) \(\newcommand{\uhat}{\widehat{\uvec}}\) \(\newcommand{\what}{\widehat{\wvec}}\) \(\newcommand{\Sighat}{\widehat{\Sigma}}\) \(\newcommand{\lt}{<}\) \(\newcommand{\gt}{>}\) \(\newcommand{\amp}{&}\) \(\definecolor{fillinmathshade}{gray}{0.9}\)An enhanced greenhouse effect caused by human activities is expected to upset the radiation balance of the earth system resulting in a variety of changes to the geography of our planet. The most notable change will be the spatial pattern of air temperature. The global temperature anomalies between 1880 and 2010 shown in Figure \(\PageIndex{1}\) show that temperature changes are occurring to a greater degree in some regions more than others. The most notable region is the Arctic where the disappearance of sea ice has made the surface less reflective causing surface and air temperatures to rise.

Predicting changes to the the global patterns of temperature is a challenging undertaking for scientists as they must rely on models for their forecasts. The models are numerical representations based on how our earth system functions. They are limited by our understanding of earth system processes and long-term data sets. Using a variety of models, geoscientists have forecast a range of possible scenarios. One thing is clear from their predictions, that the amount of temperature change varies geographically.

Arctic regions
The arctic regions appear to be impacted the most. Observations of mean annual surface air temperature over the past 50 years has increased 2oC to 3°C in Alaska and Siberia and decreased by 1°C over southern Greenland. Mean annual surface air temperature over the Arctic region (north of 60° latitude) is projected to increase 1.1°F by 2050 and 4.4°C by 2100.
The Midlatitudes
Climate change is expected to increase the frequency of extreme events in midlatitude regions like the midwest United States. A severe drought in 1988, heat waves in 1995 and 1996, flooding on the Mississippi in 1993 (100-year flood) and 2002, and numerous tornadoes and severe thunderstorms can be expected in the future. Illinois will be become warmer, especially in the summer having temperatures more like present-day Oklahoma or Arkansas. Wisconsin temperatures could rise 2.7o-5.5oC in the winter and by 4.4o - 9.4o C during the summer by 2100. Extreme heat will be more common than today. Southern Ontario's winter temperatures are expected to increase by 3o - 7oC and summer's to be 4o-8oC warmer. More southerly states like Illinois will experience less warmer. Winter temperatures are expected to increase by 2.7o-3.8oC during the winter in Indiana while summer temperatures are expected to increase by 4.4o - 5.5oC. Growing seasons could be 4 to 7 weeks longer in Wisconsin and 3 to 6 weeks longer to the south in Illinois. Under a medium-high emissions scenario, the IPCC predicts a 3o- 4.9oC change statewide in California.
Subtropical Regions
Though most geoscientists have felt that the Arctic will show the first true signs of a future climate, dramatic changes have been recorded in subtropical regions. Recent analysis of satellite data has found that each hemisphere's jet stream has moved poleward by about 1 degrees of latitude or 70 miles. Jet streams are found on the poleward limit of the tropics which means they are getting wider. Continued movement will mean the spread of subtropical deserts like the Sahara. Regional climate predictions for southern Africa during summer suggest a warm season increase of 2oC to 4oC over the subcontinent, with the doubling of carbon dioxide. Current climate models project regional temperature increases approximately 2 to 5.5oC by 2100, with an 4.5o to 8.3oC increase in the average summer heat index for the southeastern United States.
Tropical Regions
Most model predictions indicate the smallest change to temperature will occur in tropical latitudes. Depending on model assumptions and location, annual changes on the order of .1oC to 3oC are predicted. Analysis indicates that there may be significant differences within the tropics, especially in Asia, depending on proximity to the sea. Warming is projected to be least in the islands and coastal areas throughout Indonesia, the Philippines, and coastal south Asia and Indo-China and greatest inland. Even with relatively small temperatures, they can be devastating. A 3o Celsius rise in temperature would result in a 60 percent reduction in the arabica coffee area in Brazil, the world's largest producer.


