3.4: Future Geographies - Predicting Atmospheric Composition
- Page ID
- 15174
\( \newcommand{\vecs}[1]{\overset { \scriptstyle \rightharpoonup} {\mathbf{#1}} } \)
\( \newcommand{\vecd}[1]{\overset{-\!-\!\rightharpoonup}{\vphantom{a}\smash {#1}}} \)
\( \newcommand{\id}{\mathrm{id}}\) \( \newcommand{\Span}{\mathrm{span}}\)
( \newcommand{\kernel}{\mathrm{null}\,}\) \( \newcommand{\range}{\mathrm{range}\,}\)
\( \newcommand{\RealPart}{\mathrm{Re}}\) \( \newcommand{\ImaginaryPart}{\mathrm{Im}}\)
\( \newcommand{\Argument}{\mathrm{Arg}}\) \( \newcommand{\norm}[1]{\| #1 \|}\)
\( \newcommand{\inner}[2]{\langle #1, #2 \rangle}\)
\( \newcommand{\Span}{\mathrm{span}}\)
\( \newcommand{\id}{\mathrm{id}}\)
\( \newcommand{\Span}{\mathrm{span}}\)
\( \newcommand{\kernel}{\mathrm{null}\,}\)
\( \newcommand{\range}{\mathrm{range}\,}\)
\( \newcommand{\RealPart}{\mathrm{Re}}\)
\( \newcommand{\ImaginaryPart}{\mathrm{Im}}\)
\( \newcommand{\Argument}{\mathrm{Arg}}\)
\( \newcommand{\norm}[1]{\| #1 \|}\)
\( \newcommand{\inner}[2]{\langle #1, #2 \rangle}\)
\( \newcommand{\Span}{\mathrm{span}}\) \( \newcommand{\AA}{\unicode[.8,0]{x212B}}\)
\( \newcommand{\vectorA}[1]{\vec{#1}} % arrow\)
\( \newcommand{\vectorAt}[1]{\vec{\text{#1}}} % arrow\)
\( \newcommand{\vectorB}[1]{\overset { \scriptstyle \rightharpoonup} {\mathbf{#1}} } \)
\( \newcommand{\vectorC}[1]{\textbf{#1}} \)
\( \newcommand{\vectorD}[1]{\overrightarrow{#1}} \)
\( \newcommand{\vectorDt}[1]{\overrightarrow{\text{#1}}} \)
\( \newcommand{\vectE}[1]{\overset{-\!-\!\rightharpoonup}{\vphantom{a}\smash{\mathbf {#1}}}} \)
\( \newcommand{\vecs}[1]{\overset { \scriptstyle \rightharpoonup} {\mathbf{#1}} } \)
\( \newcommand{\vecd}[1]{\overset{-\!-\!\rightharpoonup}{\vphantom{a}\smash {#1}}} \)
\(\newcommand{\avec}{\mathbf a}\) \(\newcommand{\bvec}{\mathbf b}\) \(\newcommand{\cvec}{\mathbf c}\) \(\newcommand{\dvec}{\mathbf d}\) \(\newcommand{\dtil}{\widetilde{\mathbf d}}\) \(\newcommand{\evec}{\mathbf e}\) \(\newcommand{\fvec}{\mathbf f}\) \(\newcommand{\nvec}{\mathbf n}\) \(\newcommand{\pvec}{\mathbf p}\) \(\newcommand{\qvec}{\mathbf q}\) \(\newcommand{\svec}{\mathbf s}\) \(\newcommand{\tvec}{\mathbf t}\) \(\newcommand{\uvec}{\mathbf u}\) \(\newcommand{\vvec}{\mathbf v}\) \(\newcommand{\wvec}{\mathbf w}\) \(\newcommand{\xvec}{\mathbf x}\) \(\newcommand{\yvec}{\mathbf y}\) \(\newcommand{\zvec}{\mathbf z}\) \(\newcommand{\rvec}{\mathbf r}\) \(\newcommand{\mvec}{\mathbf m}\) \(\newcommand{\zerovec}{\mathbf 0}\) \(\newcommand{\onevec}{\mathbf 1}\) \(\newcommand{\real}{\mathbb R}\) \(\newcommand{\twovec}[2]{\left[\begin{array}{r}#1 \\ #2 \end{array}\right]}\) \(\newcommand{\ctwovec}[2]{\left[\begin{array}{c}#1 \\ #2 \end{array}\right]}\) \(\newcommand{\threevec}[3]{\left[\begin{array}{r}#1 \\ #2 \\ #3 \end{array}\right]}\) \(\newcommand{\cthreevec}[3]{\left[\begin{array}{c}#1 \\ #2 \\ #3 \end{array}\right]}\) \(\newcommand{\fourvec}[4]{\left[\begin{array}{r}#1 \\ #2 \\ #3 \\ #4 \end{array}\right]}\) \(\newcommand{\cfourvec}[4]{\left[\begin{array}{c}#1 \\ #2 \\ #3 \\ #4 \end{array}\right]}\) \(\newcommand{\fivevec}[5]{\left[\begin{array}{r}#1 \\ #2 \\ #3 \\ #4 \\ #5 \\ \end{array}\right]}\) \(\newcommand{\cfivevec}[5]{\left[\begin{array}{c}#1 \\ #2 \\ #3 \\ #4 \\ #5 \\ \end{array}\right]}\) \(\newcommand{\mattwo}[4]{\left[\begin{array}{rr}#1 \amp #2 \\ #3 \amp #4 \\ \end{array}\right]}\) \(\newcommand{\laspan}[1]{\text{Span}\{#1\}}\) \(\newcommand{\bcal}{\cal B}\) \(\newcommand{\ccal}{\cal C}\) \(\newcommand{\scal}{\cal S}\) \(\newcommand{\wcal}{\cal W}\) \(\newcommand{\ecal}{\cal E}\) \(\newcommand{\coords}[2]{\left\{#1\right\}_{#2}}\) \(\newcommand{\gray}[1]{\color{gray}{#1}}\) \(\newcommand{\lgray}[1]{\color{lightgray}{#1}}\) \(\newcommand{\rank}{\operatorname{rank}}\) \(\newcommand{\row}{\text{Row}}\) \(\newcommand{\col}{\text{Col}}\) \(\renewcommand{\row}{\text{Row}}\) \(\newcommand{\nul}{\text{Nul}}\) \(\newcommand{\var}{\text{Var}}\) \(\newcommand{\corr}{\text{corr}}\) \(\newcommand{\len}[1]{\left|#1\right|}\) \(\newcommand{\bbar}{\overline{\bvec}}\) \(\newcommand{\bhat}{\widehat{\bvec}}\) \(\newcommand{\bperp}{\bvec^\perp}\) \(\newcommand{\xhat}{\widehat{\xvec}}\) \(\newcommand{\vhat}{\widehat{\vvec}}\) \(\newcommand{\uhat}{\widehat{\uvec}}\) \(\newcommand{\what}{\widehat{\wvec}}\) \(\newcommand{\Sighat}{\widehat{\Sigma}}\) \(\newcommand{\lt}{<}\) \(\newcommand{\gt}{>}\) \(\newcommand{\amp}{&}\) \(\definecolor{fillinmathshade}{gray}{0.9}\)It is undeniable that the climate of Earth has seen numerous changes over time. Our current climate is undergoing changes in unprecedented ways for modern times. Measurements of atmospheric temperature show a clear upward trend while many regions are gripped in years-long drought. Most geoscientists concur that the current warming trend is related to human activities. Some disagree and suggest it is a natural fluctuation similar to that which the earth has experienced in the past.
To understand how climate has changed in the past, and more importantly, what will happen in the future, geoscientists must rely on models. Models are merely representations of the real world and are constrained by our understanding of earth processes. Scientist must make assumptions to fill in gaps where understanding or data is lacking. As a result, the output of a model inherently has a degree of uncertainty associated with it.
Predicting the changes in gaseous composition of the atmosphere is a difficult exercise. How the gaseous composition of the atmosphere will change in the future depends a great deal on the impact of human activities and our ability to control emissions. In addition to changes brought about by humans, increasing temperatures as a result of an enhanced greenhouse effect will impact the concentration of various gases in earth's atmosphere.
Prediction versus Projection
Uncertainty over how population will grow, economies develop, and technological advancement makes it difficult at best to predict the future composition of the atmosphere. Bodies like the Intergovernmental Panel on Climate Change (IPCC) make projections based on models. Though quite sophisticated, models of earth systems are constrained by our knowledge of environmental processes. The unpredictability of human advancement and the state of our understanding of climate dynamics leaves uncertainty in these projections. Thus geoscientists use statistics and their expert judgment for factors that elude quantification to determine the likelihood for the outcome of their model projections.
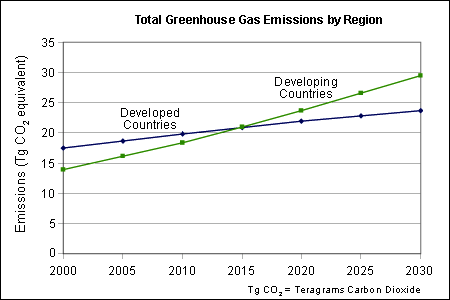
Future concentrations will not necessarily be geographically defined due to the fluid nature of the atmosphere. The exception may be water vapor, due to the unequal distribution of available water to evaporate into the air. However, the sources of future contributions to the gaseous composition of the atmosphere are certainly geographically distributed, especially those from human activities. The race toward economic development will shift the largest contributors to the developing world.

IPCC Storylines and Scenarios
The Intergovernmental Panel on Climate Change (IPCC) is recognized by many as the foremost authority on climate change. Their most recent analysis of climate change (2007) utilized four different "storylines" that represent the range of driving forces and emission behind climate change. Each storyline posed several different scenarios, grouped as "families" to examine the outcome of models that use similar assumptions about the driving forces, and some that do not.
|
A1 Storyline |
A2 Storyline |
B1 Storyline |
B2 Storyline |
|
|
|
|
Projected increases in greenhouse gases
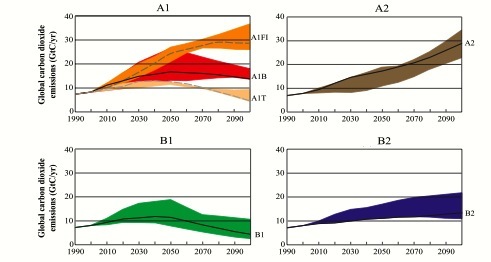
Projected increases from the four story lines are shown in Figure \(\PageIndex{2}\). All but the A2 show an increase in CO2 followed by a decrease or leveling in CO2 emissions the coming century. The A2 scenario show an increasing rate of emissions through time. In some sense, this is the "worst case scenario" with a continuously increasing population using more resources, slow technological change, and lack of global unity in tackling these issues.
At the opposite end of the spectrum is the "utopian" B1 scenario. The B1 scenario assumes low fertility with low mortality and central migration rates, global population peaks mid-century, then continually decreases toward 2100. Resource-efficient and renewable technology adoption diffuses rapidly through the world economy. The greening of material production and energy use helps lower carbon dioxide emissions from industry and transportation.

The A2 and B1 scenarios represent two ends of the spectrum of possible outcomes. But in both cases, the importance of global population change and attendant demand for resources has a strong impact on emissions of greenhouse gases and stress on the physical environment. It may be just as likely for the changes in the composition of the atmosphere to lie somewhere between these extremes. The A1 market-driven scenarios of decreasing population growth coupled with rapid expansion of technology can yield reductions of greenhouse gases as well.
The IPCC does not suggest the likelihood of any particular outcome. They should be seen for what they are, scenarios, what could happen given particular conditions. Thus they serve policy makers with a kind of roadmap to the future, however uncertain it might be.
Video: Projecting Future Climate Change. The late Professor Stephen Schneider explains the factors that influence uncertainty in predicting future climate. (Source)
Assess you understanding of the preceding material by Looking Back at the Greenhouse Effect, and Future Geographies or skip and continue reading.
Describe how the greenhouse effect works.
- Answer
-
Gases such as carbon dioxide and methane absorb radiation emitted by the earth and warm, raising the temperature of the air.
List the four IPCC Scenarios and their world type/focus.
- Answer
-
A1- Homogenous world - market focus. A2 - Heterogeneous world - market focus. B1 - Homogenous world - environmental focus. B2 - Heterogeneous world - environmental market focus.


