1.2.4: Geography and the Scientific Method
- Page ID
- 15316
\( \newcommand{\vecs}[1]{\overset { \scriptstyle \rightharpoonup} {\mathbf{#1}} } \)
\( \newcommand{\vecd}[1]{\overset{-\!-\!\rightharpoonup}{\vphantom{a}\smash {#1}}} \)
\( \newcommand{\id}{\mathrm{id}}\) \( \newcommand{\Span}{\mathrm{span}}\)
( \newcommand{\kernel}{\mathrm{null}\,}\) \( \newcommand{\range}{\mathrm{range}\,}\)
\( \newcommand{\RealPart}{\mathrm{Re}}\) \( \newcommand{\ImaginaryPart}{\mathrm{Im}}\)
\( \newcommand{\Argument}{\mathrm{Arg}}\) \( \newcommand{\norm}[1]{\| #1 \|}\)
\( \newcommand{\inner}[2]{\langle #1, #2 \rangle}\)
\( \newcommand{\Span}{\mathrm{span}}\)
\( \newcommand{\id}{\mathrm{id}}\)
\( \newcommand{\Span}{\mathrm{span}}\)
\( \newcommand{\kernel}{\mathrm{null}\,}\)
\( \newcommand{\range}{\mathrm{range}\,}\)
\( \newcommand{\RealPart}{\mathrm{Re}}\)
\( \newcommand{\ImaginaryPart}{\mathrm{Im}}\)
\( \newcommand{\Argument}{\mathrm{Arg}}\)
\( \newcommand{\norm}[1]{\| #1 \|}\)
\( \newcommand{\inner}[2]{\langle #1, #2 \rangle}\)
\( \newcommand{\Span}{\mathrm{span}}\) \( \newcommand{\AA}{\unicode[.8,0]{x212B}}\)
\( \newcommand{\vectorA}[1]{\vec{#1}} % arrow\)
\( \newcommand{\vectorAt}[1]{\vec{\text{#1}}} % arrow\)
\( \newcommand{\vectorB}[1]{\overset { \scriptstyle \rightharpoonup} {\mathbf{#1}} } \)
\( \newcommand{\vectorC}[1]{\textbf{#1}} \)
\( \newcommand{\vectorD}[1]{\overrightarrow{#1}} \)
\( \newcommand{\vectorDt}[1]{\overrightarrow{\text{#1}}} \)
\( \newcommand{\vectE}[1]{\overset{-\!-\!\rightharpoonup}{\vphantom{a}\smash{\mathbf {#1}}}} \)
\( \newcommand{\vecs}[1]{\overset { \scriptstyle \rightharpoonup} {\mathbf{#1}} } \)
\( \newcommand{\vecd}[1]{\overset{-\!-\!\rightharpoonup}{\vphantom{a}\smash {#1}}} \)
\(\newcommand{\avec}{\mathbf a}\) \(\newcommand{\bvec}{\mathbf b}\) \(\newcommand{\cvec}{\mathbf c}\) \(\newcommand{\dvec}{\mathbf d}\) \(\newcommand{\dtil}{\widetilde{\mathbf d}}\) \(\newcommand{\evec}{\mathbf e}\) \(\newcommand{\fvec}{\mathbf f}\) \(\newcommand{\nvec}{\mathbf n}\) \(\newcommand{\pvec}{\mathbf p}\) \(\newcommand{\qvec}{\mathbf q}\) \(\newcommand{\svec}{\mathbf s}\) \(\newcommand{\tvec}{\mathbf t}\) \(\newcommand{\uvec}{\mathbf u}\) \(\newcommand{\vvec}{\mathbf v}\) \(\newcommand{\wvec}{\mathbf w}\) \(\newcommand{\xvec}{\mathbf x}\) \(\newcommand{\yvec}{\mathbf y}\) \(\newcommand{\zvec}{\mathbf z}\) \(\newcommand{\rvec}{\mathbf r}\) \(\newcommand{\mvec}{\mathbf m}\) \(\newcommand{\zerovec}{\mathbf 0}\) \(\newcommand{\onevec}{\mathbf 1}\) \(\newcommand{\real}{\mathbb R}\) \(\newcommand{\twovec}[2]{\left[\begin{array}{r}#1 \\ #2 \end{array}\right]}\) \(\newcommand{\ctwovec}[2]{\left[\begin{array}{c}#1 \\ #2 \end{array}\right]}\) \(\newcommand{\threevec}[3]{\left[\begin{array}{r}#1 \\ #2 \\ #3 \end{array}\right]}\) \(\newcommand{\cthreevec}[3]{\left[\begin{array}{c}#1 \\ #2 \\ #3 \end{array}\right]}\) \(\newcommand{\fourvec}[4]{\left[\begin{array}{r}#1 \\ #2 \\ #3 \\ #4 \end{array}\right]}\) \(\newcommand{\cfourvec}[4]{\left[\begin{array}{c}#1 \\ #2 \\ #3 \\ #4 \end{array}\right]}\) \(\newcommand{\fivevec}[5]{\left[\begin{array}{r}#1 \\ #2 \\ #3 \\ #4 \\ #5 \\ \end{array}\right]}\) \(\newcommand{\cfivevec}[5]{\left[\begin{array}{c}#1 \\ #2 \\ #3 \\ #4 \\ #5 \\ \end{array}\right]}\) \(\newcommand{\mattwo}[4]{\left[\begin{array}{rr}#1 \amp #2 \\ #3 \amp #4 \\ \end{array}\right]}\) \(\newcommand{\laspan}[1]{\text{Span}\{#1\}}\) \(\newcommand{\bcal}{\cal B}\) \(\newcommand{\ccal}{\cal C}\) \(\newcommand{\scal}{\cal S}\) \(\newcommand{\wcal}{\cal W}\) \(\newcommand{\ecal}{\cal E}\) \(\newcommand{\coords}[2]{\left\{#1\right\}_{#2}}\) \(\newcommand{\gray}[1]{\color{gray}{#1}}\) \(\newcommand{\lgray}[1]{\color{lightgray}{#1}}\) \(\newcommand{\rank}{\operatorname{rank}}\) \(\newcommand{\row}{\text{Row}}\) \(\newcommand{\col}{\text{Col}}\) \(\renewcommand{\row}{\text{Row}}\) \(\newcommand{\nul}{\text{Nul}}\) \(\newcommand{\var}{\text{Var}}\) \(\newcommand{\corr}{\text{corr}}\) \(\newcommand{\len}[1]{\left|#1\right|}\) \(\newcommand{\bbar}{\overline{\bvec}}\) \(\newcommand{\bhat}{\widehat{\bvec}}\) \(\newcommand{\bperp}{\bvec^\perp}\) \(\newcommand{\xhat}{\widehat{\xvec}}\) \(\newcommand{\vhat}{\widehat{\vvec}}\) \(\newcommand{\uhat}{\widehat{\uvec}}\) \(\newcommand{\what}{\widehat{\wvec}}\) \(\newcommand{\Sighat}{\widehat{\Sigma}}\) \(\newcommand{\lt}{<}\) \(\newcommand{\gt}{>}\) \(\newcommand{\amp}{&}\) \(\definecolor{fillinmathshade}{gray}{0.9}\)The steps in geographic inquiry are embodied in the "scientific method". The scientific method consists of systematic observation, formulation, testing and revision of hypotheses. If a hypothesis withstands the scrutiny of repeated experimentation and review it may be elevated to a theory. Theories may undergo revision as new data and research methods are improved.

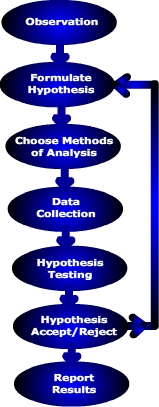
The scientific method includes:
- Observation
- Hypothesis Formulation
- Choose methods of analysis
- Data collection
- Analysis: Hypothesis testing
- Hypothesis acceptance or rejection
- Report results
Let's look at a very simple example of how you as a geographer could use the scientific method.
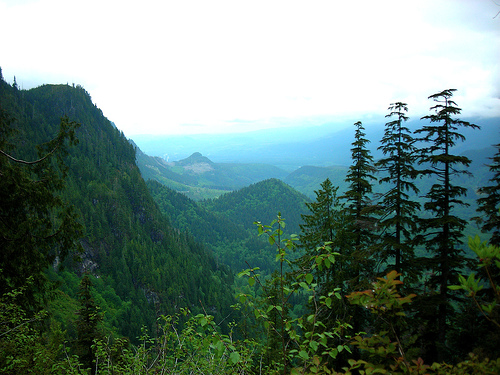
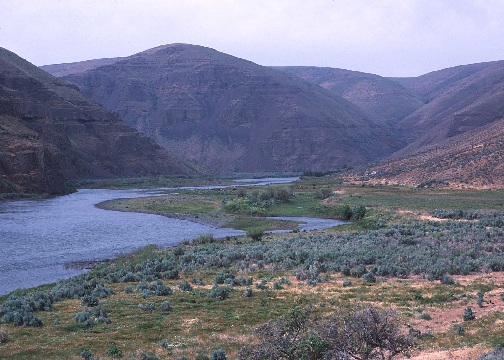
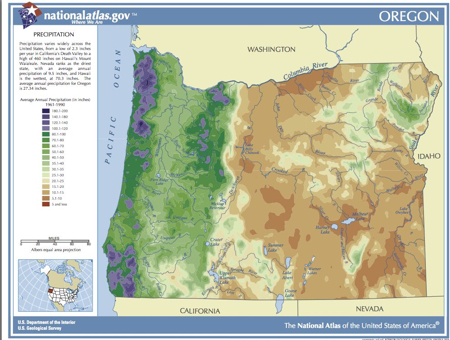
Observation. During a trip through the Cascade Range of Oregon you notice that the western slope tends to have more lush vegetation than the eastern slope and wonder why. Our experience tells us that vegetation requires moisture to live, and more lush vegetation is found where precipitation is abundant. Could it be that the western slopes are rainier than the eastern slopes given the spatial variation in vegetation?


Hypothesis formulation. A hypothesis is referred to as "an educated guess". That is, upon recognizing a particular pattern displayed by earth phenomenon, the geographer offers a "guess" or explanation as to what caused it. Previous research serves as the foundation for constructing hypotheses. Given our initial observation and past experience we suggest that there is a relationship between slope orientation and precipitation.
A hypothesis is stated in a clear and concise way so that it can be tested through data collection and analysis.When constructing a hypothesis, scientists actually formulate two hypotheses related to their problem. The null hypothesis is a statement of no relationship. This is the hypothesis we will either reject or not reject. The null hypothesis (Ho) for our problem is:
Ho: There is no relationship between slope orientation and precipitation.
The alternative hypothesis is a statement of relationship. The alternate hypothesis is:
Ha: There is a relationship between slope orientation and precipitation.
Determine the methods used to test our hypothesis is the next step. There are a variety of quantitative and qualitative methods to test our hypothesis. One could calculate the average precipitation for the western and eastern slopes and apply a difference of means test (t-test).
Data collection. In order to test our hypothesis we must collect a sample of data. For most cases, a sample set of 30 will suffice. Primary data can be collected in the field and analyzed, or secondary data that has already been published can be used. Precipitation data is available from a variety of public and private sources.

Analysis: Testing the hypothesis. A geographer often starts their analysis using some way to visualize the spatial pattern of precipitation. A map showing the geographic pattern of precipitation can be created if data from several places have been obtained. Or a graph of precipitation with the y-axis scaled for precipitation and x-axis for distance between locations along a transect. Statistics describing the data are usually calculated. The mean or average of each data set (west side and east side of the mountains) are determined and finally the hypothesis is tested using the difference of means test.
Hypothesis Acceptance/Rejection (Explanation). After testing our hypothesis we will either accept or reject our null hypothesis. In reality, we can't prove our hypothesis correct, we can only disprove it based on our analysis. That is, we reject the null hypothesis that there is no difference in precipitation based on the data that we have collected. If new data or better data collection techniques are available in the future, they may lead us to conclude that we cannot reject our null hypothesis. Hence it is hard to prove a hypothesis is correct as new information and understanding may present itself in the future.
Report Results. If we can accepted out hypothesis then we can report our results so others can scrutinize our work and test our hypothesis under different circumstances.If our null hypothesis is rejected we can turn to our alternative hypothesis or restate the null hypothesis in a different way. Thus, applying the scientific method can be an iterative process. If our work can be replicated many times under different circumstance the hypothesis can be elevated to a theory. A theory can be a hypothesis or group of hypotheses that has been validated through repeated experiments and coming to the same conclusion.
Assess your basic understanding of the preceding material by "Looking Back: The Discipline of Geography" or continue reading.


