
2.4: Remote Sensing
- Page ID
- 2239

Remote sensing is very important to physical geography. It allows geographers to look at change over a large area over time. In addition, remote sensing takes advantage of the interaction of earth materials with various wavelengths of the electromagnetic spectrum (recall last week’s lecture). The chemical properties of some materials preferentially absorb or reflect certain wavelengths. For example, the iron in chlorophyll (the ‘energy’ producing element of all green plants) reflects very strongly in the near infrared (the wavelength slightly longer than red, and just outside the range of human vision). Chlorophyll also absorbs very strongly in the blue wavelengths. Therefore by looking at the near infrared wavelength and comparing it with the blue, you can pick out the vegetated areas by looking for areas that reflect strongly in red, and not in blue.
The following web pages are excerpts from a NASA tutorial on remote sensing. Some of the material is pretty technical, but read it carefully, and pay particular attention to the graphs:
- Electromagnetic Spectrum: Spectral Signatures
- Processing and Classification of Remotely Sensed Data
In the first graph, which compares Pinewood, Grassland, Red Sand Pit and Silty water, if you were looking at a remotely sensed image at 0.8 micrometers wavelength, which would you expect to appear the brightest? Which would appear the least bright?
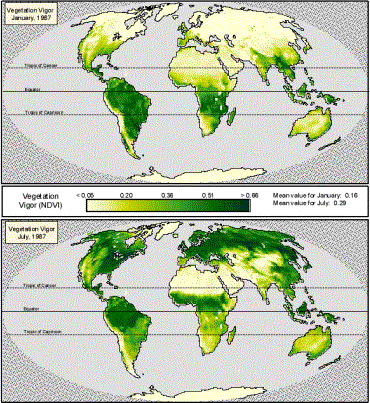
The Grasslands would appear the brightest, as it reflects the most electromagnetic energy at that wavelength. The silty water would appear the darkest, as it would reflect the least at that wavelength. An example of this type of remote sensing is the Normalized Difference Vegetation Index or NDVI. NDVI is a ratio of near infrared wavelengths to visible wavelengths, and can be thought of as ‘vegetation vigor’. The figure below is an example of global NDVI for January and July. Recall that December and June are the solstices or the height of summer or winter. The figures below are selected as January and July because vegetation generally has a lag-time between when the conditions are at a maximum (height of summer or winter) and when they are at their greenest. In the figure below, light colors indicate low vegetation vigor, while dark colors indicate high vegetation vigor.
In addition to optical remote sensing (remote sensing that uses the visible and near infrared portion of the electromagnetic spectrum), another common type of remote sensing is radar. Radar remote sensing measures the ‘roughness’ of a surface. It is very useful for studies which look at land-use change because man-made features tend to be very smooth compared to vegetation which is rough. Think about if you were in an airplane looking down at a city and a forest. The forest looks ‘fuzzy’ and ‘soft’ while the buildings and roads of the city have large flat, ‘smooth’ surfaces. See a radar image of the San Francisco Bay Area. Note that the urban areas (smooth) reflect very strongly (have a bright color) and the vegetated hills surrounding the Bay Area (rough) do not reflect (appear dark).